Abstract
Purpose: The purpose of this work was to assess the monitor unit (MU) values and position accuracy of spot scanning proton beams as recorded by the daily treatment logs of the treatment control system, and furthermore establish the feasibility of using the delivered spot positions and MU values to calculate and evaluate delivered doses to patients.
Methods: To validate the accuracy of the recorded spot positions, the authors generated and executed a test treatment plan containing nine spot positions, to which the authors delivered ten MU each. The spot positions were measured with radiographic films and Matrixx 2D ion-chambers array placed at the isocenter plane and compared for displacements from the planned and recorded positions. Treatment logs for 14 patients were then used to determine the spot MU values and position accuracy of the scanning proton beam delivery system. Univariate analysis was used to detect any systematic error or large variation between patients, treatment dates, proton energies, gantry angles, and planned spot positions. The recorded patient spot positions and MU values were then used to replace the spot positions and MU values in the plan, and the treatment planning system was used to calculate the delivered doses to patients. The results were compared with the treatment plan.
Results: Within a treatment session, spot positions were reproducible within ±0.2 mm. The spot positions measured by film agreed with the planned positions within ±1 mm and with the recorded positions within ±0.5 mm. The maximum day-to-day variation for any given spot position was within ±1 mm. For all 14 patients, with ∼1 500 000 spots recorded, the total MU accuracy was within 0.1% of the planned MU values, the mean (x, y) spot displacement from the planned value was (−0.03 mm, −0.01 mm), the maximum (x, y) displacement was (1.68 mm, 2.27 mm), and the (x, y) standard deviation was (0.26 mm, 0.42 mm). The maximum dose difference between calculated dose to the patient based on the plan and recorded data was within 2%.
Conclusions: The authors have shown that the treatment log file in a spot scanning proton beam delivery system is precise enough to serve as a quality assurance tool to monitor variation in spot position and MU value, as well as the delivered dose uncertainty from the treatment delivery system. The analysis tool developed here could be useful for assessing spot position uncertainty and thus dose uncertainty for any patient receiving spot scanning proton beam therapy.
Keywords: proton therapy, scanning beam proton therapy, patient specific QA, dose verification
INTRODUCTION
Proton pencil beam scanning1, 2, 3 is a promising radiotherapeutic technology that offers better dose conformality and possibly lower neutron dose than the conventional passive scattering beam technique.4, 5 The spot scanning proton beam delivery system at The University of Texas MD Anderson Cancer Center Proton Therapy Center in Houston6 uses monoenergetic proton pencil beams, or spots, to deposit a radiotherapeutic dose in the target volume.1 The synchrotron can generate proton beams with 94 distinctive energies, ranging from 72.5 to 221.8 MeV, which correspond to a proton distal range at R90 of 4.0 to 30.6 cm in water. The accurate delivery of dose [in terms of monitor units (MUs)] and spots to the planned position is essential for scanning proton beam therapy, particularly for intensity-modulated proton therapy.7, 8, 9, 10 In every treatment session, all spot positions and the MU values delivered by each spot are recorded in the treatment log file in DICOM format (RT Ion Beams Treatment Record). Information about the spot MU value and position, which is analogous to information about the MU value and position of each leaf in a multileaf collimator (MLC) recorded by the delivery system in intensity-modulated radiation therapy (IMRT),11, 12, 13 provides a unique opportunity to verify the dose delivery for every single spot and evaluate the performance of the delivery system as a whole. It is not known, however, whether the information in a spot scanning system's treatment log file is sufficiently accurate to confirm these values and therefore whether it might be suitable for patient-specific quality assurance (QA) in spot scanning proton therapy. In the study reported here, we assessed the amount of uncertainty in the recorded spot positions and MU values of scanning pencil beams by comparing planned and measured values under experimental conditions and by analyzing daily treatment log files for actual patients, then using the recorded data with the treatment planning system (TPS) to evaluate the dose uncertainty due to variations in the spot scanning delivery system.
MATERIALS AND METHODS
Spot scanning proton beam
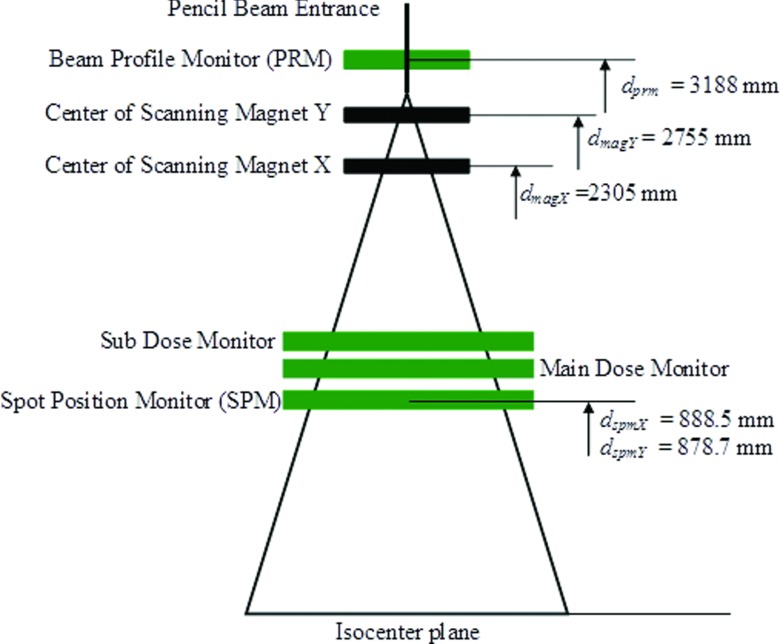
Figure 1 is a schematic depiction of the Hitachi PROBEAT proton scanning beam delivery system (Hitachi, Ltd., Tokyo, Japan), showing only the components relevant to the current work. When the pencil beam enters the nozzle, the beam profile monitor (PRM) monitors and records the center of the incident proton beam and beam profile (spot size in both x and y directions). The full width at half maximum (FWHM) for the spot size in the air decreases with increasing energy and varies from 1.2 cm for 221.8 MeV to 3.4 cm for 72.5 MeV at the isocenter plane. The pencil beam is then deflected by two scanning magnets (X and Y) to deliver the dose to a planned location. The MU values of each spot are monitored and recorded by the main dose and subdose monitors, and the center location of each delivered spot is detected and recorded by the spot position monitor (SPM). It is worth noting that the SPM does not interact with the scanning magnets and serves only as independent verification of the spot position. The time required to deliver one spot is 1 to 10 ms, and the maximum and minimum MU values that can be delivered in one spot are 0.04 and 0.005 MU, respectively. The proton beam delivery pauses if the spot dose deviates ± 0.0026 MU from the prescribed value and aborts if the spot dose deviates ± 0.0093 MU from the prescribed value.
Figure 1.
Diagram of relevant components in the proton scanning beam delivery system studied.
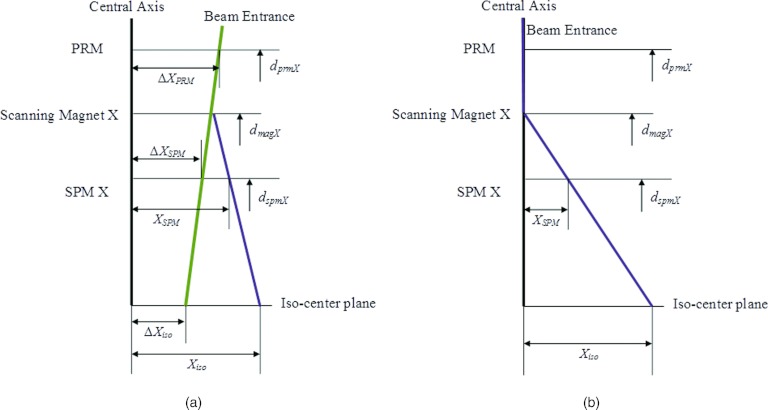
Since spot positions are defined at the isocenter plane in the TPS (Eclipse 8.9; Varian Medical Systems, Inc., Palo Alto, CA), to compare the recorded spot position with planned position, we first needed to translate the recorded spot positions at the SPM plane, (XSPM, YSPM), to the isocenter plane, (Xiso, Yiso). To do this, we considered the central path of an incident pencil beam without scanning magnet fields. The scanning nozzle is designed such that the pencil beam is “focused” to the isocenter under this condition. If the center of the proton beam is offset from the center of the PRM by (ΔXPRM, ΔYPRM), the amounts by which the centers are offset (hereafter referred to as the off-centers) at the SPM (ΔXSPM, ΔYSPM) and at the isocenter plane (ΔXiso, ΔYiso) would then be less than that at the PRM plane and are related by a simple geometric relation of trapezoids (Fig. 2a). The off-center at the isocenter plane can therefore be determined as
| (1) |
| (2) |
where dPRM = 3188 mm, the effective distance from the PRM to the isocenter plane, and dSPMX = 888.5 mm and dSPMY = 878.7 mm, the effective distances from the SPM for the X and Y axes to the isocenter plane, respectively. (ΔXPRM, ΔYPRM) and (ΔXSPM, ΔYSPM), along with the coincidence of radiation (proton) and imaging isocenter were measured once daily/weekly as part of routine quality assurance,6, 14 and the maximum deviation at both the PRM and SPM planes was determined to be <0.1 mm and the mean <0.01 mm, while the imaging and the radiation isocenter was within 0.5 mm. Therefore, to simplify the procedure, we ignored the focusing effect and used the geometry shown in Fig. 2b to project the recorded spot positions at the SPM plane (XSPM, YSPM) to the isocenter plane (Xiso, Yiso), which can then be compared with spot positions from the treatment plan. The tolerance between the delivered spot position and the planned position at isocenter plane is 1.5 mm for proton energies higher than 145 MeV and increases to 2.8 mm as the energy decreases to the lowest level, 72.5 MeV. The tolerance level is higher for lower energies because the spot size (FWHM) is larger for lower energies, increasing to 3.4 cm for 72.5 MeV at the isocenter plane. There is also a warning level of 1 mm for higher energies (>145 MeV) and up to 2 mm for the lowest energy. The delivery system is designed such that the beam pauses if either the spot MU value or the spot position is detected to be out of tolerance for a delivered spot. These tolerance values were determined by assuming that the overall acceptable dose error for a uniform spread-out Bragg peak (SOBP) dose distribution delivered by spot scanning beam was 3%, considering the intrinsic nonuniformity, distal dose distribution error, and lateral dose distribution error.15 The spot position error contributes to the lateral dose distribution error.
Figure 2.
Diagram of the method used to calculate spot position at the isocenter plane on the x axis, (a) considering the focusing effect of the pencil beam and (b) ignoring the focusing effect.
Monitor unit calibration for scanning beam and spot monitor verification with ion chamber measurements
The MU value for the scanning proton beam represents a certain amount of charge collected by the main dose monitor at the reference condition: a uniform dose of 2.17 Gy delivered to 1 liter of water centered at isocenter using pencil beams with 18 energies between 178.6 and 221.8 MeV (corresponding to proton ranges of 21.0–30.6 g/cm2 and a nominal SOBP width of 10 cm), a 10 × 10 cm2 field size, and a total of 217 MU. More details on the definition of MU value for the spot scanning beam have been published elsewhere.1 Repeat measurements were made with two Accredited Dosimetry Calibration Laboratory (ADCL)-calibrated waterproof Farmer-type chambers (TN30013; PTW, Freiburg, Germany) placed at isocenter (these measurements were not part of calibration of the beam). The recorded spot MU values for each measurement were compared with the planned spot MU value for the reference condition and correlated to the absolute dose through the calibration. It is expected that the recorded spot MU value follow the planned MU value with minimum variation for all measurements. While comparing the individual spot MU value is not part of the calibration, verifying the individual value ensures that the monitor and recording system work as designed.
Spot position verification with film and Matrixx
Film dosimetry was used to validate the system geometry, the accuracy of recorded spot position (relative to both planned position and delivered position on film), and the reproducibility of spot delivery within a treatment section. A treatment plan was generated (in the Eclipse 8.9 TPS) to deliver 10 MU to 9 locations on the isocenter plane [at (x, y) coordinates of (0 mm, 0 mm), (50 mm, 0 mm), (−50 mm, 0 mm), (0 mm, 50 mm), (0 mm, −50 mm), (100 mm, 100 mm), (−100 mm, 100 mm), (100 mm, −100 mm), and (−100 mm, −100 mm)] at three proton energies (146.9 MeV, 173.7 MeV, and 198.3 MeV). Two hundred fifty identical spots of 0.04 MU each were delivered to compose the 10-MU dose at each location. The FWHM of spots for these three energies were 1.8 cm, 1.6 cm, and 1.4 cm, and the 90% ranges of the proton beams were 14.9 cm, 20 cm, and 25.2 cm, respectively. For each proton energy, GafChromic EBT2 radiochromic film (International Specialty Products, Inc., Wayne, NJ) was placed at the isocenter plane in air (aligned with laser); the irradiated film was then scanned with an Epson Expression 10000XL scanner (Epson, Long Beach, CA). The shape of each location was fitted with a 2D Gaussian function, and the centers of the Gaussian functions were compared with those of the treatment plan and the recorded log file. The recorded spot positions were on the SPM plane and were projected onto the isocenter plane using the geometry shown in Fig. 2b. This experiment also allowed us to validate the reproducibility of actual positioning of the spot and recording of the position in the log file.
The same experiment was repeated with gantry mounted Matrixx 2D ion-chamber array (Scanditronix Wellhofer, Schwarzenbruck, Germany) at isocenter-plane on four gantry angles (0°, 90°, 180°, and 270°) to evaluate the gantry angle dependence of the spot position uncertainty. X-ray images of the Matrixx were taken at each gantry angle with onboard imager to determine the center of the detector array, and the displacement between the planned spot positions and the measured spot positions by Matrixx were compared with the displacement between the planned positions and the recorded spot positions by the treatment log, as a function of the gantry angle.
Spot monitor unit and position verification for patients
Patient treatment plans were exported from TPS in DICOM format. For typical patients, the treatment consists of 20 to 38 fractions, with two or three proton fields delivering 1.6 to 2.8 Gy, and up to 64 energies and ∼10 000 spots in each field. The treatment plans contain necessary information for the treatment machine to deliver the designed spot pattern and hence desired dose to patient, which include, for each treatment field, the gantry angle, number of proton energies (also called layers), number of spots and spot size for each layer, and spot position and MU value for each spot. The treatment plans also contain patient demographic and setup information.
Each patient log file records a single delivery of one proton field. The log files, recorded at the time of actual delivery for the given field, contain the same delivery information of the field as the treatment plan. We focused on the spot positions and MU value for each spot from the daily treatment log file for every treatment session for each patient for our analysis. For this study, ten patients with prostate cancer and four with other cancers (two with brain cancer, one with lung cancer, and one with sarcoma) who underwent proton spot scanning beam treatment between August 1, 2009, and June 1, 2010, were randomly selected. As part of patient specific QA, Matrixx measurement was performed for each treatment field as described by Zhu et al.16
Statistical methods
All 14 patients in this study received multiple fractions of proton treatments; each treatment consisted of at least two fields delivered at different gantry angles, with each field of multiple energies and each energy of multiple spots. We denoted each recorded spot position as Si(p, d, g, e, x, y, MU), where i is the spot index, p ∈ {p1, p2, …pM} represents the patient, d ∈ {d1, d2, …dN} represents the treatment fraction (date), g represents the gantry angle, e represents the proton energy, (x, y) is the recorded position for this spot on the isocenter plane, and MU is the recorded MU value. The corresponding planned spot positions were denoted as Si(p, d, g, e, x0, y0, MU0). The displacement of the recorded spot position from the planned position can be written as Ex = Si(…x − x0…), Ey = Si(…y − y0…), , and the difference between the recorded and planned MU values as EMU = Si(…MU − MU0). We report the difference in measured MU value as a percentage for easier interpretation because the difference between recorded and planned MU values was only a small fraction of the maximum spot MU value, 0.04.
The overall displacement of the recorded spot MU value and position from those in the plan was evaluated by calculating the mean (,, and ), standard deviation (,, and ), and range; frequency distributions of these distances were also created. Univariate analyses were then performed on patient ( and ), treatment date ( and ), gantry angle ( and ), planned spot position ( and ), and proton energy ( and ) to detect any systematic errors or large variation within the groups defined according to these variables.
Assuming the centers of the delivered spots are Gaussian distributed around the planned position (x, y) with standard deviation (σx, σy), it is easy to show that the mean distance (μDist) is a function of σx×σy. Therefore, monitoring distance is effectively monitoring both σx and σy, while change in the mean distance could be interpreted as change in the distribution of spots.
Delivered patient dose reconstruction with recorded data
The recorded treatment data for all delivered fields were imported into the TPS, and the doses calculated using these parameters. The resulting doses were compared with the planned doses to verify the doses delivered to patients for target volumes and organs at risk. This study assumed no setup uncertainty, motion, or anatomy change throughout the course of treatment.
RESULTS
Spot monitor unit verification with ion chamber measurements
Multiple measurements were made with two Farmer-type ion chambers under the reference condition described above, and the recorded MU values for all spots were compared to the planned MU values for those deliveries. Variation of the ion chamber measurements was <1%, the maximum recorded MU deviation from the planned value for a single spot during these deliveries was <0.001 MU, and the total recorded MU deviation from the planned values (217 MU) was <0.5%.
Spot position verification with film and Matrixx
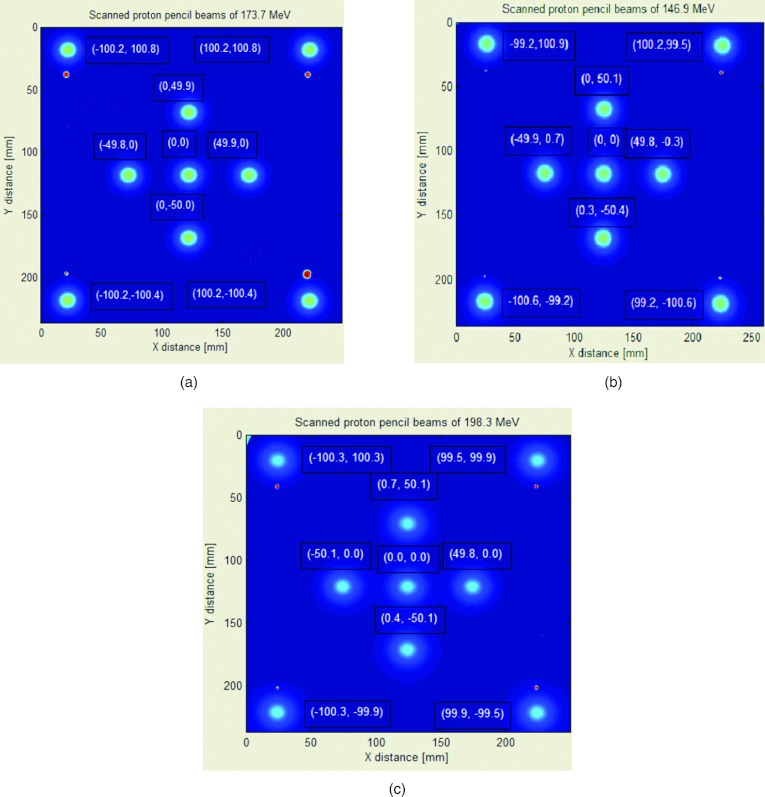
Figure 3 shows the results from film experiments for proton beams with energies of 146.9, 173.7, and 198.3 MeV. The centers of the 2D Gaussian fit are shown next to each of the nine locations described in Sec. 2, and they were all consistent with those in the treatment plan (maximum deviation, 0.92 mm) and with the mean of recorded spot positions (maximum deviation, 0.65 mm). The reproducibility of recorded spot positions delivered to the same x-y coordinates was within ±0.18 mm (2σ = 0.07 mm) in both directions, based on the recorded treatment log file.
Figure 3.
Film results for three energies of the proton scanning beam: (a) 146.9 MeV, (b) 173.7 MeV, and (c) 198.3 MeV. Ten MU (250 spots of 0.04 MU each) were delivered to each location and measured at isocenter in air.
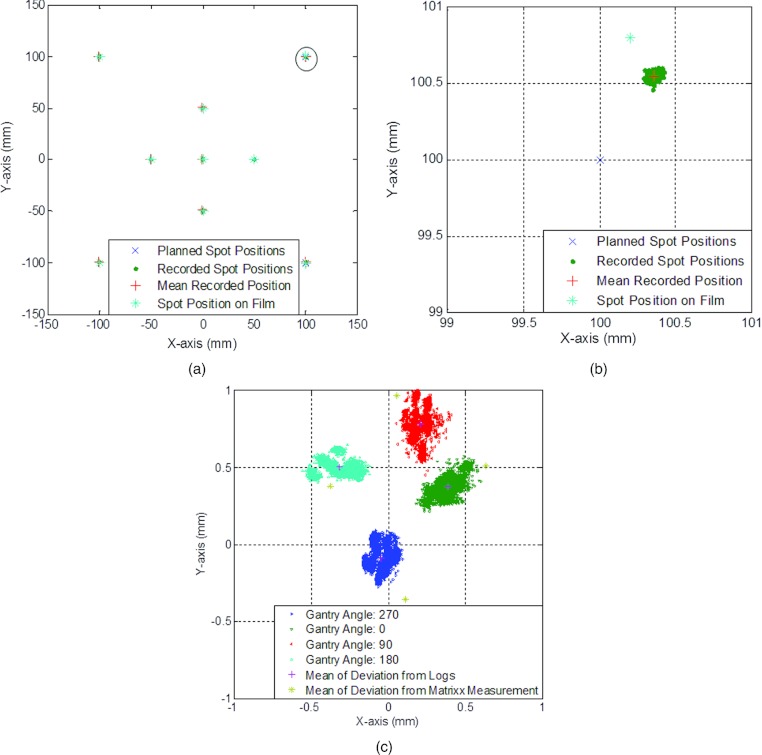
Figure 4a shows the recorded spot positions for proton beams with energy of 173.7 MeV overlaid with the planned positions and the spot positions on film. The planned position for the spot in Fig. 4b was (100 mm, 100 mm), the mean recorded position was (100.40 mm, 100.60 mm), and the spot position on film was (100.2 mm, 100.8 mm). The spread of delivered spots was within 0.3 mm in both the x and y directions. Figure 4c shows the results for measurement with Matrixx compared to the recorded positions. The centers of the nine spots were found on the Matrixx measurement for each of the gantry angle, and the mean displacement of the center of the spots were plotted against the mean displacement of the recorded spot positions. It can be observed that the deviation from the plan position is a function of gantry angle, and the difference between the logs and the Matrixx measurement is <0.3 mm on both x and y directions. Note that the figure only presents results of deliveries on one day, and the purpose of this experiment was to validate that the treatment parameters were recorded correctly to enable patient data analysis.
Figure 4.
Results for the 173.7 MeV proton scanning beam. Ten MU (250 spots of 0.04 MU each) were delivered to each location and measured at isocenter in air. (a) Recorded, planned, and film-measured positions. (b) Zoom-in for spot position (100 mm, 100 mm).
Spot monitor unit and position verification for patients
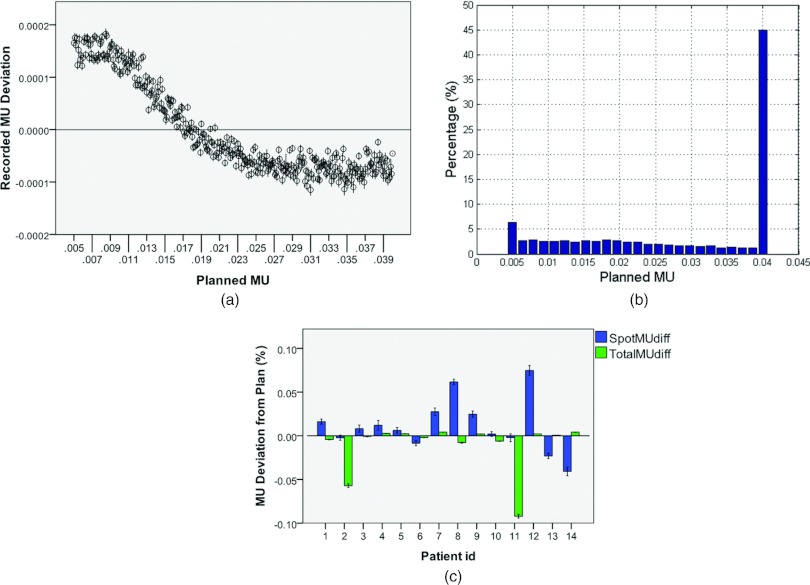
For all Matrixx measurements for all 14 patients, the percentage of pixels that met the 3%/3 mm γ-index criteria was >95%. For all the recorded spots from all 14 patients, the mean MU difference from plan, , was −0.01%, and the standard deviation, , was 0.50%. Of the recorded MUs, 96.97% deviated from the plan by <1%, and >99.99% of the spots deviated by <3%. The maximum deviation was −8.8% or −0.0035 MU.
Figure 5 shows deviation of recorded MU values from planned MU values. Figure 5a shows deviations for all delivered spots. As can be observed, the deviation decreased as the planned MU value increased. Figure 5c shows the spot and total MU deviations (as a percentage of planned MU values) for all patients. Spot MU deviations were calculated for all spots delivered for the patient over all fractions, and total MU deviation was the deviation over all fractions of the cumulative total of MUs delivered in each fraction. The maximum mean MU deviation from the planned value for any patient was ∼0.1%. Similar results (minimum deviation and no trend) were found for recorded MU deviation vs date, gantry angle, proton energy, and planned spot position and therefore are not shown here.
Figure 5.
Results of MU values in the treatment plan and recorded in the delivery system for 14 patients. (a) Recorded MU deviations vs planned MUs. (b) Histogram of planned MUs for all patients. (c) Spot and total MU deviations from planned values (as a percentage) for each patient. For each patient, spot MU deviations were calculated for all single spots delivered, and total MU deviation was the deviation of the cumulative MUs in each fraction. Error bars represent 95% confidence intervals.
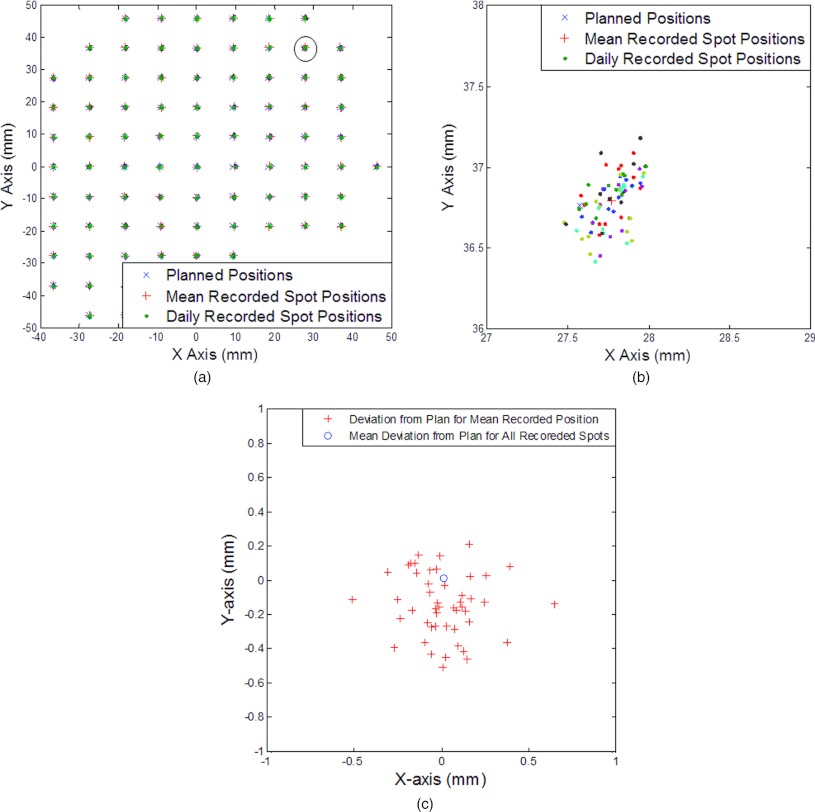
Figure 6 illustrates the spot position information extracted from daily log files for one patient. Figure 6a shows the recorded spot positions overlaid with the planned positions for 1 energy (163.9 MeV) throughout the course of treatment. Different colors for recorded spot positions represent recorded positions on different days, and the mean recorded position for every spot was also calculated. The ranges of displacement of mean recorded position from the planned position were −0.51 to 0.65 mm on the x axis and −0.50 to 0.21 mm on the y axis, and the maximum distance was 0.66 mm. Figure 6b is zoomed in to show the planned spot position (27.6 mm, 36.8 mm). Figure 6c shows a scatter plot of displacements in the x and y directions for each recorded spot on different treatment days, and Fig. 6d shows the mean displacement of recorded position from each planned position (total of 48) and the mean displacement of all spots at this energy (0.03 mm, 0 mm).
Figure 6.
Spot position map from the treatment planning system and from recorded data for a single proton energy (163.9 MeV). (a) Recorded position vs planned position. (b) Zoom-in for spot position (27.6 mm, 36.8 mm). This spot had the maximum mean displacement from the planned position. (c) Displacement of daily recorded position from planned position for spots with an energy of 163.9 MeV. Dots of different colors represent spot positions recorded on different days. (d) Displacement from the planned position of the mean recorded position for each spot position (total of 48) and mean displacement from the planned position for all recorded spots at this energy.
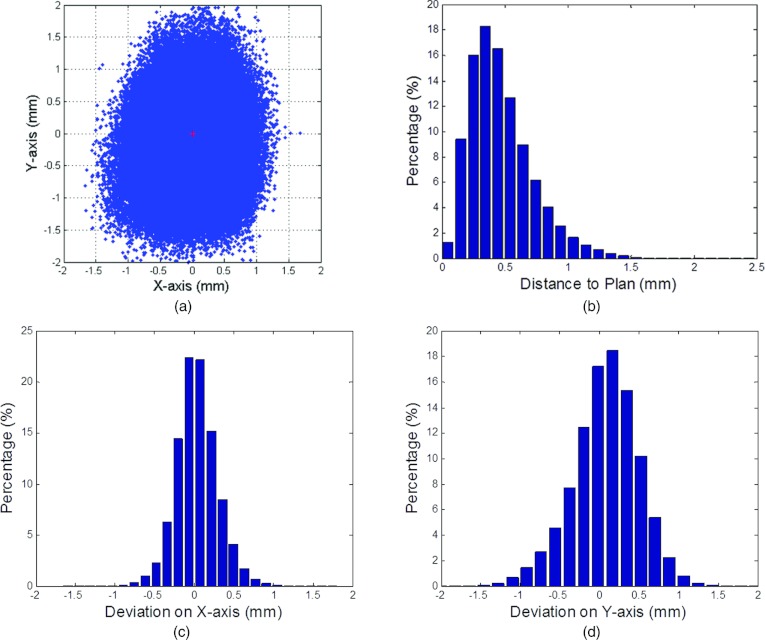
Figure 7a is a scatter plot of deviations from the planned positions for a total of ∼1 500 000 spots for all 14 patients. The red cross indicates (,) at (−0.03 mm, −0.01 mm). Figures 7c, 7d show the histograms for Ex and Ey, respectively, with = 0.26 mm and = 0.42 mm. The range of Ex was −1.66–1.68 mm, and the range of Ey was −2.27–2.06 mm. Figure 7b shows the histogram of EDist; the range of EDist was 0 to 2.39 mm, and 96.76% of the recorded spot positions were <1 mm from the planned position (99.82% were <1.5 mm away).
Figure 7.
Displacement of spot recorded position from planned position for all patients. (a) Scatter plot of all spots with the red cross at (,). (b) Histogram of the percentage distances from recorded position to planned position. (c) Histogram of displacements of spot position on the x axis. (d) Histogram of displacements of spot position on the y axis.
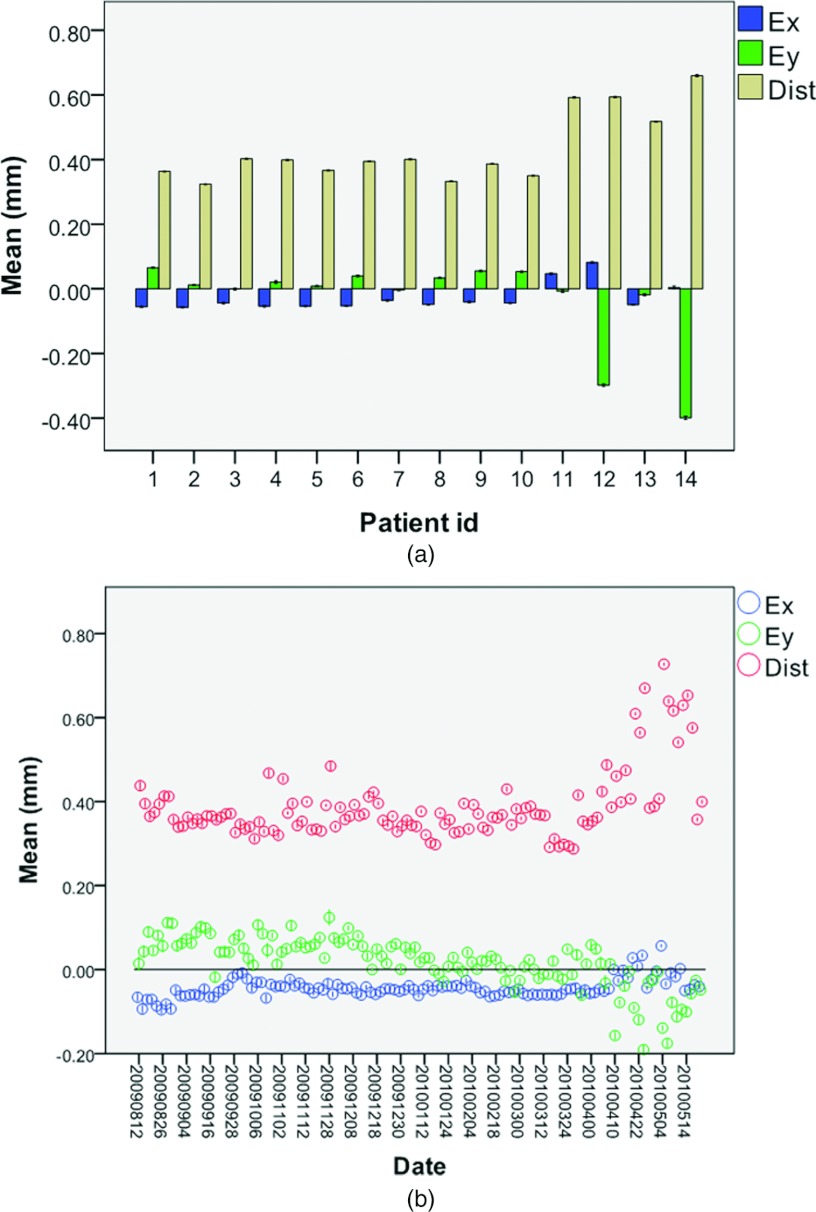
Figure 8 shows the variation of spot position between patients and between treatment dates. The variation between patients and between dates did not impact delivered spot position uncertainty. The amount of spot position deviation from the plan was slightly higher for nonprostate cancer patients (patients 11–14, mean distance ∼0.6 mm) than for prostate cancer patients (patients 1–10, mean distance ∼0.4 mm).
Figure 8.
Displacement of recorded position from planned position for different patients and dates. Means and 95% CIs (error bars) for distance to planned position on the x and y axes for (a) different patients and (b) different treatment dates.
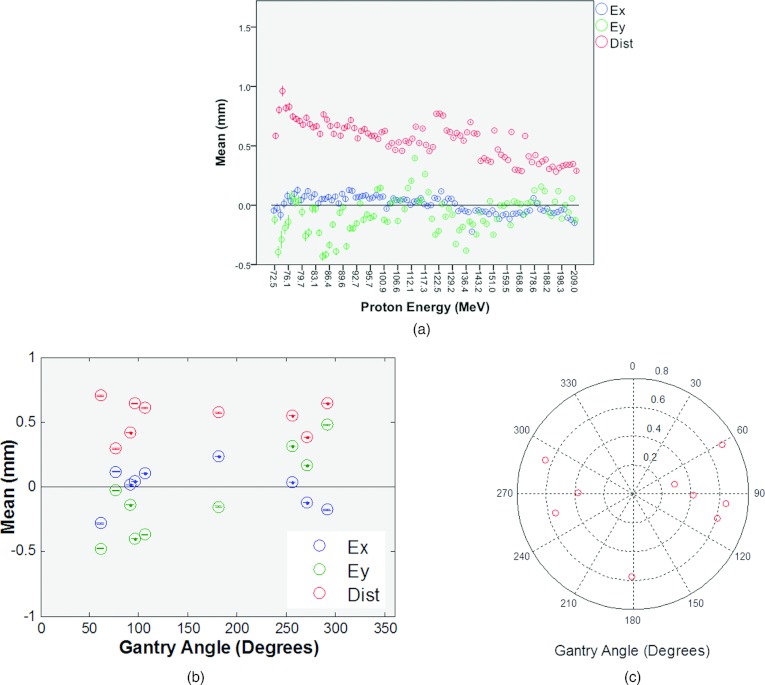
Figures 9a, 9b show the displacement of recorded spot position for different proton energies and different gantry angles, respectively. The mean distance from the planned position was greater for lower proton energies. For different gantry angles, not only did the mean distance from the planned position change (Fig. 9c), but the mean displacements in the x and y directions also had different signs. This may be due to the small beam position change at the entrance of the nozzle with different gantry rotation.
Figure 9.
Displacement of recorded position from planned position for different energies and gantry angles. Means and 95% CIs (error bars) for distance to planned position on the x and y axes for (a) different energies and (b) different gantry angles. (c) Polar plot of the mean distance vs angle.
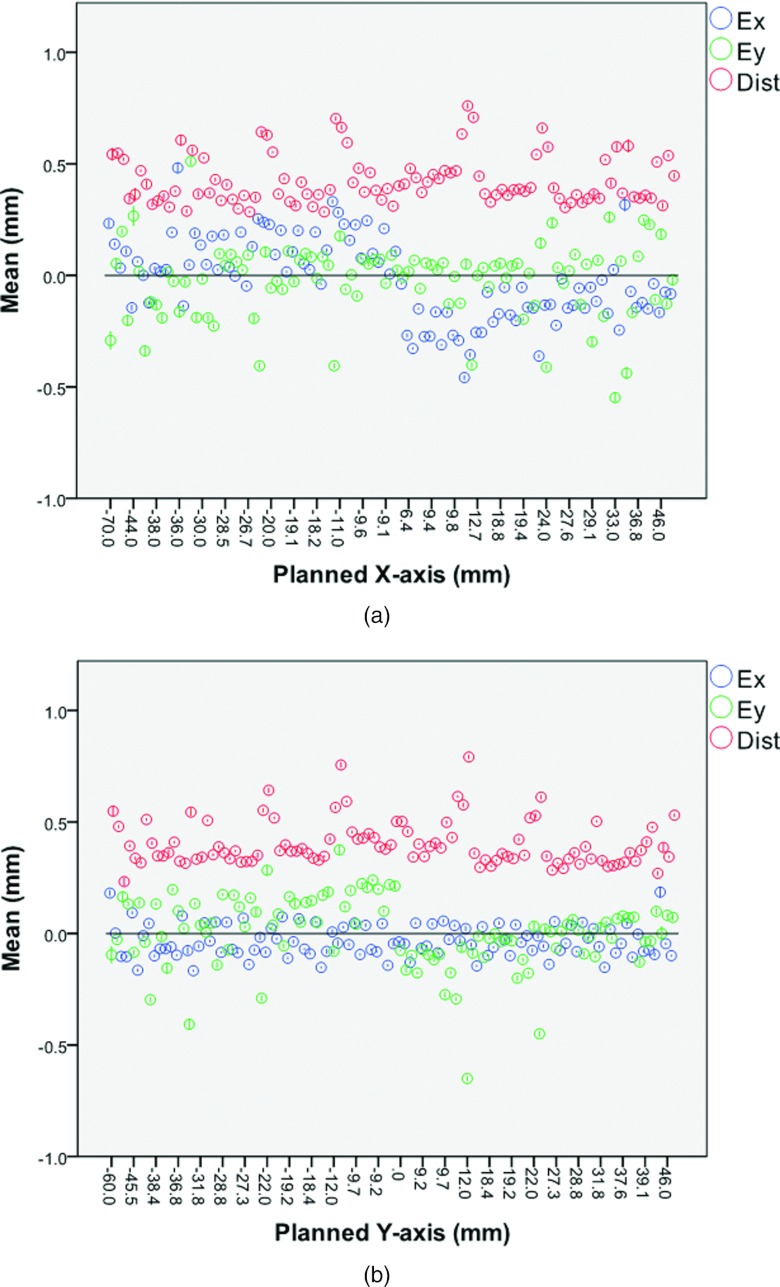
Figures 10a, 10b show the displacement of the recorded spot position vs the planned spot position on the x and y axes, respectively. Displacement in the x direction was independent of the planned y position and vice versa, as expected. However, the mean displacement on the x axis did vary with the planned position on the x axis, and the mean displacement on the y axis also varied with the planned position on the y axis.
Figure 10.
Displacement of recorded position vs planned position. Means and 95% CIs (error bars) for distance to planned position on the x and y axes for (a) different planned positions on the x axis and (b) different planned positions on the y axis.
Delivered patient dose reconstruction with recorded data
Figure 11a shows the reconstructed patient dose with delivered spot positions and MU values compared to the planned dose for a prostate cancer patient in the isocenter plane. Figure 11b shows the dose-volume histogram comparison for this patient. The maximum dose difference was within 2% for this patient.
Figure 11.
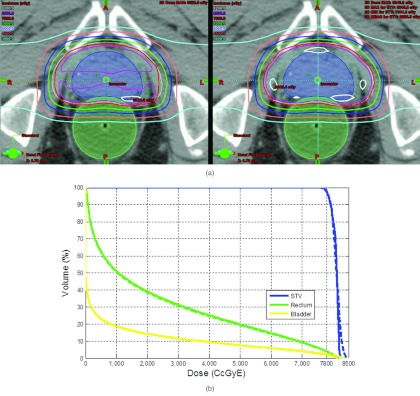
Reconstructed patient dose with delivered spot positions and MUs compared to the planned dose for a prostate patient (a) at isocenter plane, plan (left) vs log (right). (b) Dose volume histogram, plan (solid) vs log (dash).
DISCUSSION
Spot MU and position accuracy are key parameters for scanning beam delivery systems. Therefore, it is critically important not only to establish an effective quality assurance program1 but also to record and verify these parameters, if possible.
For the scanning proton beam delivery system at the MD Anderson Proton Therapy Center in Houston, the maximum and minimum MU values for each spot are limited to 0.04 and 0.005 MU, respectively. As can be observed from Fig. 7b, MUs at both the upper and lower limits were used more in patient plans than intermediate MUs. The deviation between the recorded MU and the planned MU values decreased as the planned MU value increased. Nevertheless, the total MU value delivered in each fraction to all patients, or the total dose to patients given that MU value was calibrated correctly, was accurate within 0.1%. This finding is consistent with measurement results for MU linearity during the commission1 and annual QA. Also note that this result does not take into account the position at which the dose was delivered or uncertainty in the spot position. The variation of MU deviations from planned values was minimal with respect to date, gantry angle, proton energy, and spot position.
As noted earlier, the spot position tolerance of the delivery system studied here was 1.5 mm (alarm level, 1 mm) for proton energies higher than 145 MeV and increased to up to 2.8 mm (alarm level, up to 2 mm) for lower energies. This increase is associated with the larger spot size at lower proton energy and permits wider spread of delivered spot positions at low energies, and was confirmed by the increased mean distance to planned position for different energies [Fig. 9a], which is a function of σx × σy. Nevertheless, as shown in Fig. 7, all displacements in both the x and y directions fell well within the tolerance level (maximum displacement was 1.68 mm on the x axis and 2.27 mm on the y axis). Variation in the y direction was higher than that in the x direction ( = 0.26 mm and = 0.42 mm). This phenomenon is partly due to the beam optics from the synchrotron to the scanning nozzle, and also contributed by the fact that scanning magnet Y is further than scanning magnet X from the isocenter plane (Fig. 1).
Periodic QA measurements were performed to validate the recorded spot positions in the treatment of log files. Specifically, film measurements were performed weekly to QA the coincidence between the center of the central spot (the incident spot without scanning magnetic fields) and the imaging system central axis. On a monthly basis, the spot positions in the treatment logs were validated using measurements similar to in Figs. 34. The spot positions measured with film are relative to the central spot. More recently, a gantry mounted Matrixx detector was used to validate the spot positions at different gantry angles. The alignment of the Matrixx was checked by the onboard x-ray imaging system. Every patient fields were also measured at several depth with Matrixx before patient treatment15 as part of patient specific QA. The series of measurements established and QA the accuracy of the recorded spot positions.
While patient or treatment date did not have an impact on the spot position accuracy, we did find that proton energy and gantry angle worked together to affect the level of spot uncertainty. The spot position at the entrance of the nozzle may have small gantry angle dependence that causes ΔX, ΔY at the PRM to not be zero. Figure 9b shows that the deviation of spot position on the y axis varied with gantry angle, and could be up to 0.6 mm, while the deviation on the x axis was relatively constant. As can be observed in Fig. 8a, our nonprostate cancer patients had a higher mean EDist (∼0.6 mm) than did prostate cancer patients (∼0.4 mm). This finding is clinically relevant because prostate cancer patients were treated with 2 lateral (90° and 270°) fields with higher proton energies because of tumor depth, while other disease sites were treated with different gantry angles and usually lower proton energies. Figure 10 demonstrates that the displacements in both directions were linked to the sign of the planned position [that is, relative to isocenter at (0,0)]. This finding could be due to the fact that we used simplified geometry (Fig. 2) in our calculation and ignored ΔX, ΔY at the PRM. Although the spot position errors could occur at any spot position, most spot position errors occur within the target volume because most of the spots were planned to deliver dose inside the target volume. Figure 11 confirmed that while the most significant change occurred to the target dose, the target coverage was still maintained.
The current patient specific QA program, which usually consists of pretreatment point dose measurement and plane dose measurements at several depths for each treatment field.16 By validating the treatment records for each patient with point and plane dose measurements, treatment logs can then be used to complement the patient specific QA program by verifying every delivered spots in all treatment sessions. The records of MLC position and MU values from the delivery system in IMRT have been used as a quality assurance tool and for reconstructing the dose to patient.11, 12, 13 Analogous to the MLC in IMRT, records of MU values and spot positions also provide a unique opportunity to study the patient dose uncertainty due to the delivery system. To study the feasibility of using the records for patient dose verification and evaluate the dose uncertainty from the delivery chain alone, this study assumed no setup uncertainty, motion, or anatomy change throughout the course of treatment. However, if real-time patient imaging were available during the course of treatment, the recorded spot positions and MU values could be used in combination with the real-time patient imaging to establish a true in vivo dosimetric system. The dosimetric impact of uncertainty in spot MU value and position are being investigated in parallel to this work.
CONCLUSION
We have shown that the treatment log file in a spot scanning proton beam delivery system is precise enough to serve as a quality assurance tool to monitor variation in spot position and MU value during treatment delivery. We also demonstrate the feasibility of using the log files to analysis patient dose uncertainty from the treatment delivery system. The analysis tool developed here could be useful for assessing spot position uncertainty and thus dose uncertainty for any patient receiving spot scanning proton beam therapy.
ACKNOWLEDGMENTS
We thank Kathryn Carnes, Sarah Bronson, and Sunita Patterson from the Department of Scientific Publications at MD Anderson Cancer Center for editorial review of this manuscript. MD Anderson Cancer Center is supported by the National Institutes of Health (Grant No. CA16672).
References
- Gillin M. T., Sahoo N., Bues M., Ciangaru G., Sawakuchi G., Poenisch F., Arjomandy B., Martin C., Titt U., Suzuki K., Smith A. R., and Zhu X. R., “Commissioning of the discrete spot scanning proton beam delivery system at the University of Texas M.D. Anderson Cancer Center, Proton Therapy Center, Houston,” Med. Phys. 37, 154–163 (2010). 10.1118/1.3259742 [DOI] [PMC free article] [PubMed] [Google Scholar]
- Meyer J., Bluett J., Amos R., Levy L., Choi S., Nguyen Q. N., Zhu X. R., Gillin M., and Lee A., “Spot scanning proton beam therapy for prostate cancer: treatment planning technique and analysis of consequences of rotational and translational alignment errors,” Int. J. Radiat. Oncol. Biol. Phys. 78, 428–434 (2010). 10.1016/j.ijrobp.2009.07.1696 [DOI] [PubMed] [Google Scholar]
- Lomax A. J., Bohringer T., Bolsi A., Coray D., Emert F., Goitein G., Jermann M., Lin S., Pedroni E., Rutz H., Stadelmann O., Timmermann B., Verwey J., and Weber D. C., “Treatment planning and verification of proton therapy using spot scanning: initial experiences,” Med. Phys. 31, 3150–3157 (2004). 10.1118/1.1779371 [DOI] [PubMed] [Google Scholar]
- Koehler A. M., Schneider R. J., and Sisterson J. M., “Range modulators for protons and heavy ions,” Nucl. Instrum. Methods 131, 437–440 (1975). 10.1016/0029-554X(75)90430-9 [DOI] [Google Scholar]
- Suit H. D., Goitein M., Tepper J. E., Verhey L., Koehler A. M., Schneider R., and Gragoudas E., “Clinical experience and expectation with protons and heavy ions,” Int. J. Radiat. Oncol., Biol., Phys. 3, 115–125 (1977). 10.1016/0360-3016(77)90237-1 [DOI] [PubMed] [Google Scholar]
- Smith A., Gillin M., Bues M., Zhu X. R., Suzuki K., Mohan R., Woo S., Lee A., Komaki R., Cox J., Hiramoto K., Akiyama H., Ishida T., Sasaki T., and Matsuda K., “The M. D. Anderson proton therapy system,” Med. Phys. 36, 4068–4083 (2009). 10.1118/1.3187229 [DOI] [PubMed] [Google Scholar]
- Lin S., Boehringer T., Coray A., Grossmann M., and Pedroni E., “More than 10 years experience of beam monitoring with the Gantry 1 spot scanning proton therapy facility at PSI,” Med. Phys. 36, 5331–5340 (2009). 10.1118/1.3244034 [DOI] [PubMed] [Google Scholar]
- Lomax A., “Intensity modulation methods for proton radiotherapy,” Phys. Med. Biol. 44, 185–205 (1999). 10.1088/0031-9155/44/1/014 [DOI] [PubMed] [Google Scholar]
- Lomax A. J., Boehringer T., Coray A., Egger E., Goitein G., Grossmann M., Juelke P., Lin S., Pedroni E., Rohrer B., Roser W., Rossi B., Siegenthaler B., Stadelmann O., Stauble H., Vetter C., and Wisser L., “Intensity modulated proton therapy: A clinical example,” Med. Phys. 28, 317–324 (2001). 10.1118/1.1350587 [DOI] [PubMed] [Google Scholar]
- Zhu X. R., Sahoo N., Zhang X., Robertson D., Li H., Choi S., Lee A. K., and Gillin M. T., “Intensity modulated proton therapy treatment planning using single-field optimization: The impact of monitor unit constraints on plan quality,” Med. Phys. 37, 1210–1219 (2010). 10.1118/1.3314073 [DOI] [PMC free article] [PubMed] [Google Scholar]
- Haga A., Nakagawa K., Shiraishi K., Itoh S., Terahara A., Yamashita H., Ohtomo K., Saegusa S., Imae T., Yoda K., and Pellegrini R., “Quality assurance of volumetric modulated arc therapy using Elekta Synergy,” Acta Oncol. 48, 1193–1197 (2009). 10.3109/02841860903081905 [DOI] [PubMed] [Google Scholar]
- Qian J., Lee L., Liu W., Chu K., Mok E., Luxton G., Le Q. T., and Xing L., “Dose reconstruction for volumetric modulated arc therapy (VMAT) using cone-beam CT and dynamic log files,” Phys. Med. Biol. 55, 3597–3610 (2010). 10.1088/0031-9155/55/13/002 [DOI] [PubMed] [Google Scholar]
- Li J. G., Dempsey J. F., Ding L., Liu C., and Palta J. R., “Validation of dynamic MLC-controller log files using a two-dimensional diode array,” Med. Phys. 30, 799–805 (2003). 10.1118/1.1567951 [DOI] [PubMed] [Google Scholar]
- Arjomandy B., Sahoo N., Zhu X. R., Zullo J. R., Wu R. Y., Zhu M., Ding X., Martin C., Ciangaru G., and Gillin M. T., “An overview of the comprehensive proton therapy machine quality assurance procedures implemented at The University of Texas M. D. Anderson Cancer Center Proton Therapy Center-Houston,” Med. Phys. 36, 2269–2282 (2009). 10.1118/1.3120288 [DOI] [PubMed] [Google Scholar]
- Hitachi Ltd, “Tolerance scenario for the spot dose, spot position, and spot size for pencil beam scanning nozzle” MDA-40E-0538R32007.
- Zhu X. R., Poenisch F., Song X., Johnson J. L., Ciangaru G., Taylor M. B., Lii M., Martin C., Arjomandy B., Lee A. K., Choi S., Nguyen Q. N., Gillin M. T., and Sahoo N., “Patient-specific quality assurance for prostate cancer patients receiving spot scanning proton therapy using single-field uniform dose,” Int. J. Radiat. Oncol., Biol., Phys. 81, 552–559 (2011). 10.1016/j.ijrobp.2010.11.071 [DOI] [PubMed] [Google Scholar]


