

Abstract
Purpose: Due to the combination of high-frequency use and relatively high diagnostic radiation dose (>9 mSv for one scan), there is a need to lower the radiation dose used in myocardial perfusion imaging (MPI) studies in cardiac gated single photon emission computed tomography (GSPECT) in order to reduce its population based cancer risk. The aim of this study is to assess quantitatively the potential utility of advanced 4D reconstruction for GSPECT for significantly lowered imaging dose.
Methods: For quantitative evaluation, Monte Carlo simulation with the 4D NURBS-based cardiac-torso (NCAT) phantom is used for GSPECT imaging at half and quarter count levels in the projections emulating lower injected activity (dose) levels. Both 4D and 3D reconstruction methods are applied at these lowered dose levels, and compared with standard clinical spatiotemporal reconstruction (ST121) at full dose using a number of metrics on the reconstructed images: (1) overall reconstruction accuracy of the myocardium, (2) regional bias-variance analysis of the left ventricle (LV) wall, (3) uniformity of the LV wall, (4) accuracy of the time activity curve (TAC) of the LV wall, and (5) detectability of perfusion defects using channelized Hotelling observer. As a preliminary demonstration, two sets of patient data acquired in list-mode are used to illustrate the conservation of both image quality and LV ejection fraction (LVEF) by 4D reconstruction where only a portion of the acquired counts at each projection angle are used to mimic low-dose acquisitions.
Results: Compared to ST121 at standard dose, even at quarter dose 4D achieved better performance on overall reconstruction accuracy of the myocardium (28.7% improvement on relative root mean square error: standard vs 4D quarter p-value < 10−30), regional bias-variance analysis, and similar performance on accuracy of the TAC of the LV wall and detectability of perfusion defects. A slight degradation in uniformity of the LV wall was observed in 4D at quarter dose due to use of scatter correction which increases reconstruction variance. The reconstructed images from simulated and patient data show that 4D at quarter dose is visually comparable to ST121 at standard dose, if not better. Compared to ST121 and 3D, 4D images exhibit less noise artifacts and better definition of the LV wall. The 4D images are also observed to be more consistent between half dose and quarter dose. 4D also yields more consistent LVEF results at different count levels on the patient data.
Conclusions: With various quantitative metrics 4D reconstruction is demonstrated to achieve better or comparable performance at quarter dose (∼2.25 mSv, 75% dose reduction) compared to conventional clinical reconstruction at standard dose (∼9 mSv). Preliminary results from two patient datasets also show that 4D at an equivalent quarter dose can achieve better performance than clinical and 3D methods at higher dose levels. Such a significant dose reduction (75%) has not been demonstrated quantitatively in previous studies in GSPECT. These promising results warrant further investigations on the lower bound of dose reduction with different reconstruction strategies and more comprehensive clinical studies with greater patient variability.
Keywords: cardiac gated SPECT (GSPECT), 4D reconstruction, ionizing radiation, dose level
INTRODUCTION
Myocardial perfusion imaging (MPI) by single-photon emission computed tomography (SPECT) is the most frequently performed study in clinical nuclear medicine, where it plays an important role in detection and evaluation of coronary artery disease (CAD). Currently, 5–7 million SPECT MPI studies are performed per year in the United States (US) alone1, 2 and over 90% of them are ECG gated studies (GSPECT).3 The combination of high-frequency use and relatively high diagnostic radiation dose (averaged from 9 mSv for stress-only test to 35 mSv for dual-isotope test) leads to an estimated contribution of 20% of the annual collective radiation dose to the US population received from diagnostic procedures.4 During a decade of follow-up in survivors of acute myocardial infarction, it was found that age and gender adjusted cancer risk increased by 3% for every 10 mSv of radiation used for MPI.5 Based on the linear no-threshold theory,6 a recent study1 projected that the number of future cancers caused by the annual 99mTc MPI scans (more than 80% of the total MPI scans) would be over 5000. Even though there is a controversial opinion that radiation dose has a threshold below which there is no cancer risk, such a threshold likely requires a single dose less than 10 mSv.7 Therefore, there is an urgent need to lower the radiation dose used in SPECT MPI in order to reduce this population based cancer risk.
There are several possible ways to reduce the radiotracer dose for SPECT MPI, e.g., using stress-only imaging in the absence of perfusion defects on stress images for patients with low or moderate risk of CAD.8 However, more general and significant dose reduction can only be made through the advance of the SPECT technologies, either hardware or software. Although new SPECT MPI systems using solid-state detectors and customized collimators can replace conventional systems for dose reduction, we will focus on the utility of 4D reconstruction algorithms in this work, which can benefit not only the large number of existing conventional systems but also the emerging new systems.
Some preliminary results demonstrated the feasibility of using advanced three-dimensional (3D) reconstruction, which incorporated noise suppression and resolution recovery, for dose reduction in SPECT MPI,9, 10 as well as for shortening the imaging time.11, 12, 13, 14 Even though they serve for either dose or imaging time reduction, the combination of standard acquisition time with half dose injection can be deemed roughly equivalent to that of half acquisition time with standard injection given that the background activities are much lower than the high radiotracer uptake sites, such as the myocardium and liver. An iterative reconstruction algorithm (“wide beam reconstruction,” WBR) that incorporates both noise suppression and resolution recovery12 has been demonstrated to yield superior image quality with half dose and standard acquisition time over the ordered-subset expectation-maximization (OSEM) reconstruction with the standard dose.9 Subsequently, the WBR algorithm was applied in a study of two groups of patients.10 The patients in one group were injected with a standard dose of tracer and those in the other group with a half dose of tracer, and underwent both standard-time and half-time acquisitions. In both standard dose and half dose groups, the WBR reconstruction on half-time data generally showed no statistically significant difference in perfusion scores from filtered backprojection (FBP) reconstruction of standard-time data. However, this study did not directly compare between standard dose and half dose data in the same group of patients. Another recent patient study15 demonstrated that GSPECT using imaging dose with 31% reduction can yield comparable results to standard dose in terms of myocardial perfusion and left ventricular ejection fraction scores. A numerical observer study also suggested that there is some room to reduce either acquisition time or injected activity without degrading performance of myocardial perfusion defect detection using 3D reconstruction with better imaging models.16 A technical limitation in these studies is that a conventional frame-by-frame reconstruction without attenuation or scatter correction was used, thus the dose reduction capability afforded by the improvement in reconstruction algorithms has not been fully exploited.
The quality of SPECT images is limited by a number of factors, including Poisson noise, distance-dependent point spread function (PSF), attenuation, and scatter. The noise problem is particularly serious in GSPECT, where the counts are further divided among different (8 or 16) gated intervals of the cardiac cycle. In order to achieve clinically satisfactory image quality, the tracer dose of GSPECT is typically threefold of that in nongated SPECT. In recent years, 4D reconstruction methods that exploit the temporal correlation among the gated frames have been developed to improve image quality in GSPECT, aiming to achieve better perfusion defect detectability and functional assessment.17, 18, 19, 20, 21, 22, 23 Indeed, in our recent work,23 it was demonstrated that use of temporal processing in GSPECT reconstruction can have greater impact on the accuracy of the myocardium than correction of other degrading factors. However, all these 4D studies were conducted at the standard dose level with the focus on image quality improvement. The utility of 4D reconstruction methods for dose reduction has been overlooked even though lowering the radiation dose, while maintaining (or improving) image quality can also significantly improve the quality of patient care. As an added benefit of low dose imaging, the demand on the radioisotope, such as 99mTc, can be substantially decreased at the same time.
In our previous work,22 attenuation and scatter compensation as well as resolution recovery were integrated with motion-compensated temporal smoothing in 4D reconstruction. Based on previous reports that imaging dose can be halved using advanced 3D reconstruction9, 10 and that 4D reconstruction can achieve superior performance over 3D reconstruction,22, 23 we hypothesize that advanced 4D reconstruction can yield images at even lower (e.g., quarter) dose with comparable or even better quality to clinically reconstructed images at standard dose. To test our hypothesis, we used Monte Carlo simulation24 to simulate GSPECT acquisition of different dose levels (standard, half, and quarter dose) with the 4D NURBS-based cardiac-torso (NCAT) phantom25 and 99mTc-Sestamibi as the imaging agent. Images reconstructed by different reconstruction methods were used to quantitatively assess the reconstruction accuracy and perfusion defect detection performance. In addition, as preliminary demonstration, GSPECT data acquired in list-mode from two patients were used to mimic lower dose acquisitions for comparison of image quality. It is noted that the previous studies22, 23 focused on 4D reconstruction development and the effects of different degrading factors at standard dose. The purpose of this work is to investigate the important question of whether 4D reconstruction can be utilized to significantly lower the imaging dose of GSPECT.
METHODS
4D reconstruction
In GSPECT the cardiac cycle is divided into K intervals. We model the imaging process as
| (1) |
in which gk, fk, and rk are vectors representing the projection data, original image, and expected scatter component, respectively, of the kth gate interval, E[•] is the expectation operator, and H is a matrix describing the imaging system, i.e., system matrix.
The goal is to estimate the images fk from the data gk, for k = 1,2,…,K. The conventional clinical approach has been to reconstruct each gate frame separately using FBP or OSEM. In 4D reconstruction, we seek a simultaneous solution of all the frames fk from Eq. 1, aiming to take advantage of both the spatial and temporal correlations among the gate frames. In addition, both the distance-dependent PSF and the attenuation effect are directly modeled in the system matrix H based on the distance from the point of interest to the detector face, the collimator geometry, and the attenuation map acquired through the transmission images. The scatter component is estimated by the triple-energy window method27 in this study.
Let , i.e., a vector consisting of all gate frames, and as a vector of all projection data. Then F can be obtained by maximum a posteriori (MAP) estimation as
| (2) |
where p(G; F) is the likelihood function of G parameterized by F, which follows a Poisson distribution, and p(F) is a prior distribution of F. The prior term p(F) is defined to be proportional to exp[−βsUs(F) − βtUt(F)], where Us(F) consists of the differences of each voxel from its spatial neighbors in a gate frame and Ut(F) consists of the motion-prediction errors of a gate frame from its temporal neighboring frames. This definition is used to enforce spatial and temporal smoothing, respectively. The degree of spatial and temporal smoothing is controlled by their respective weighting parameters βs and βt. More details of the 4D reconstruction algorithm can be found in Refs. 21 and 22.
Phantom simulation data
In our experiments, the 4D NCAT 2.0 phantom25 was used to generate the source and attenuation distribution. A female phantom [of which one transverse slice is shown in Fig. 1a] was generated with the following body size: 35.2 cm (long-axis) × 26.7 cm (short-axis) × 41.7 cm (height) and rib size: 24 cm (long-axis) × 18.2 cm (short-axis) × 29.8 cm (height). The simulated breast dimensions were 18.2 cm (long-axis) × 7.0 cm (short-axis) × 14.0 cm (height). The female phantom was used to manifest significant attenuation.
Figure 1.

(a) A transverse slice of the female NCAT phantom; (b) defect location and ROIs for bias-variance analysis and CHO assessment; and (c) ROIs for TAC and uniformity calculations.
The SIMIND Monte Carlo package24 was used to simulate gated SPECT imaging with 99mTc-labeled Sestamibi as the imaging agent and with the Picker Prism3000 with low-energy high-resolution (LEHR) collimator as the imaging system. The projection matrix was 64 × 64 with a pixel size 0.634 cm. For a circular camera rotation of 28.5 cm radius, 64 projection sets were collected for each gate frame of total 16 gates. Two energy windows were used: the photopeak window was 20% (28 keV) centered at 140 keV and a 3.5 keV window abutted to the lower side of the photopeak window for scatter correction. The scattered counts in the photopeak window were 34.98% of the total counts. The activities in myocardium, liver, lungs, blood pool, and muscles were simulated for a typical 99mTc-labeled Sestamibi study28 at a very high count level in SIMIND to produce almost noiseless projection data. Afterward, Poisson noise was introduced at a level of 8 million (8M) total acquired counts for a standard dose acquisition; the corresponding number of acquired counts from the myocardium was 0.64M. This level was typical of a clinical acquisition at standard dose (as seen in the two sets of clinical data below). In addition, Poisson noise was introduced also at a level of 4M total acquired counts for a half dose acquisition (i.e., 50% dose reduction), and at a level of 2M total acquired counts for a quarter dose acquisition (i.e., 75% dose reduction), respectively. The simulated acquisition time was adjusted to produce counts consistent with radiation dose of 9 mSv for standard dose, 4.5 mSv for half dose, 2.25 mSv for quarter dose.
For each dose level, two datasets were generated, one with a perfusion defect and the other without. A transmural perfusion defect with 50% intensity reduction was introduced in the anterior-lateral region of the left ventricle (LV) wall [Fig. 1b]. Each dataset included 30 noise realizations for the purpose of statistical evaluation.
Note that in our previous work21 4M total counts were used with the gMCAT phantom,29 but neither attenuation nor scatter were included. It was equivalent to a standard dose study in that the primary photon counts from the heart were at the same level as in this study using 8M total counts with attenuation and scatter included.
Clinical data
As a preliminary demonstration, we also used two sets of clinical data: one female (BMI 42.8, age 69) and one male (BMI 37.7, age 70). The female patient had a history of chest pain. These studies were under IRB approval with informed content. For both patients, a two-day stress-rest protocol was used with 30 mCi (1110 MBq) Tc-99 m Tetrofosmin injection for each of stress and then rest imaging. The effective dose equivalent was estimated at 9.6 mSv for stress and 12.4 mSv for rest. The stress protocol was pharmacological using Persantine as the stress agent.
These datasets were acquired in list-mode by a dual-head IRIX system30 with 68 projection views (three-degree steps) and a 128 × 128 projection matrix. The pixel size was 0.467 cm. The acquisition started from right anterior oblique, passed through anterior and left anterior oblique, and ended at left posterior oblique. The acquisition time was 14.2 min in total (25 s per angle for 34 angles), plus approximately 5 min for transmission imaging. A total of eight gates were used. The photopeak window was 15% centered at 147.5 keV. For attenuation correction (AC), the attenuation maps were estimated from the transmission images of the patients using the Beacon system.30 Note that in these sets of clinical data the photopeak window was set to be centered at 147.5 keV so that it was asymmetric to the high side in order to decrease scatter within the acquired photopeak window data.31 An examination of the data reveals that the total number of acquired counts from the heart is 0.8 M for the female patient and 0.33 M for the male patient.
To avoid directly testing the new low dose imaging protocols on patients, we mimicked the half dose and quarter dose data from standard rest acquisition of list-mode with ECG signal present. The stress images for clinical study were not used because the list-mode data were not available. The photon events in the list-mode data were down-sampled over the entire imaging period with sensitivity reduced by 50% and 75%, which resulted in on average only half and quarter of the total counts recorded, respectively, and subsequently binned into the corresponding gates using list-mode and ECG time markers. The imaging period was kept the same for all three dose levels. Thus, these results are highly indicative of what would happen in real low-dose acquisitions.
Reconstruction methods
The following reconstruction methods are used for comparison in our experiments:
Clinical spatiotemporal method
The different gate frames are first reconstructed by FBP, then processed spatially with a Butterworth lowpass filter (order 2.4 and cutoff frequency of 0.2 cycles/voxel), and further processed along the gate dimension with a temporal filter with impulse response 1/4, 2/4, 1/4. The FBP without AC plus lowpass filtering is currently the standard as per ASNC guidelines,32 while the additional temporal filtering is the standard employed clinically at UMass Medical School.22, 23 This method is referred to as “ST121.”
Frame-by-frame 3D MAP reconstruction
The different gate frames are reconstructed independently by MAP estimation, in which a spatial prior is used to enforce spatial smoothing in each voxel's 3 × 3 × 3 neighborhood. This method amounts to setting the temporal prior equal to zero and varying the spatial prior in Eq. 2 and is referred to as “3D”. This method, in principle, is equivalent to the WBR algorithm,12 in which collimator geometry, detector response, and noise statistics are taken into account.
4D reconstruction
Both the spatial and temporal priors are used in Eq. 2 and all gate frames are reconstructed simultaneously. The temporal parameter is chosen as nonzero, while the spatial parameter is varied in the same way as in 3D. This method is referred to as “4D”.
The distance-dependent PSF, attenuation, and scatter correction are included in both 3D and 4D MAP methods and the modified block sequential regularized expectation-maximization (BSREM) algorithm (16 subsets and 10 iterations) is used for reconstruction.22 All the above three methods are applied to data at the half dose level (Half) and the quarter dose level (Quarter). The ST121 method at the full dose level is used as a standard of the clinical practice, denoted as “Standard”. We focus on the comparison of 3D and 4D methods at lower dose levels with the standard in this work, while the detailed comparison of these three methods at standard dose can be found in previous publications.22, 23
As reference for quantitative analyses, the gated volumetric images are reconstructed using the OSEM algorithm from simulated noiseless projections of the phantom data without attenuation and scatter (by turning off attenuation and scatter in SIMIND). These images represent the ideal case of what would be achievable without degradations of attenuation, scatter, and noise (referred to as “Ideal” hereafter).
For 3D the following smoothing parameter values were used: (1) 3D Half: βs = 5 × 10⁻⁴ and (2) 3D Quarter: βs = 2 × 10⁻³. For 4D the following smoothing parameters were used: (1) 4D Half: βt = 5 × 10⁻⁴, βs = 5 × 10⁻⁵ and (2) 4D Quarter: βt = 1 × 10⁻³, βs = 2 × 10⁻⁴. These parameters were selected according to the best mean square error (MSE) (see Sec. 2E) for each method at each dose level. These parameters were used for all the evaluation results below unless stated otherwise.
It is noted that no compensation for attenuation, scatter, or collimator response was included in the ST121 method. Compared to 3D and 4D, this would lead to an apparent, large bias in ST121 reconstruction owing to lack of correction for these degrading factors. For fair comparison, the reconstructed images from the different methods were all rescaled to have the same count level as that of the acquired data in each realization for the purpose of quantitative evaluation. This scaling step will greatly reduce the apparent bias in ST121.
Evaluation metrics
To evaluate the quality of the reconstructed images, we compute a number of quantitative metrics, including (1) overall reconstruction accuracy of the myocardium, (2) regional bias-variance analysis of the LV wall, (3) uniformity of the LV wall, (4) accuracy of the time activity curve (TAC) of the LV wall, and (5) detectability of perfusion defects using channelized Hotelling observer (CHO).33 These metrics are used to quantify several different aspects of the reconstructed myocardium as defined below.
Overall reconstruction accuracy of the myocardium
The overall reconstruction accuracy in the myocardium is measured by relative root MSE as
| (3) |
where fk and denote the reference and reconstructed images, respectively, of gate k and the norm () is calculated over a 30 × 28 × 20 region of interest (ROI) containing the entire LV, of which a transverse 2D slice is shown in Fig. 1b. Note that the relative root MSE is averaged for the LV myocardium ROI over all the K gate frames. The use of relative root MSE is better suited for comparison of images reconstructed at different dose levels than the absolute MSE used in Refs. 22 and 23 because the reference activities vary with the injected dose and the reconstruction errors need to be normalized according to their reference activities. A higher relative root MSE value indicates that the reconstruction deviates more from the ground truth, thus lower accuracy in reconstruction.
LV regional bias-variance analysis
To quantify the regional accuracy of LV, we conduct bias-variance analyses on ROIs (one normal and one defect) selected on the LV wall as shown in Fig. 1b. Specifically, let μ denote the mean intensity of the ROI in the noiseless reference, i.e.,
| (4) |
where f (i) is the ith voxel of the image f and M is the total number of voxels within the ROI [Fig. 1b “Normal ROI” and “Defect ROI”]. Our goal is to quantify the accuracy and precision of this quantity estimated using different noisy realizations.
Let , q = 1,2,…,Q, denote estimates of μ obtained from Q different noise realizations. In our experiments, a total of Q = 30 noise realizations were used. The mean estimate is computed as
| (5) |
Then, the bias and standard deviation (std) of this mean estimator are estimated, respectively, as
| (6) |
and
| (7) |
LV uniformity
We quantify the image uniformity around the LV wall reconstructed from the normal phantom data. Specifically, a set of 30 voxels are selected along the heart wall in one short-axis slice [Fig. 1c] and the mean of the intensity values in this set of voxels is first computed. Then, the average deviation of the intensity of each voxel from this mean is computed as a measure of the wall uniformity as follows:
| (8) |
where {fROI(i), i = 1, 2, …, N} denotes the intensity values of the selected set of voxels on the LV wall and is the mean value of this set of voxels.
TAC
In order to demonstrate the effect of smoothing on cardiac motion, we also calculate the TAC of a ROI near the base of the LV myocardium [Fig. 1c]. As the wall moves in and out of this ROI during the cardiac cycle, the intensity of the ROI will vary accordingly and thus serves as a good indicator on the degree of cardiac motion recovery. For this purpose, the correlation coefficient (CC) between a TAC from a noise realization and its ideal reference is computed as
| (9) |
where y = [y(1), y(2), …,y(K)]T and are the ideal and reconstructed TACs of the selected ROI, and and are the mean values of y and , respectively.
Defect detectability
As a measurement relevant to diagnostic accuracy, the detection performance on perfusion defect is evaluated by a CHO study.33 In the CHO, four rotationally symmetric, nonoverlapping input channels are used and internal noise is included as in Ref. 22. A total of 60 noise realizations (30 defect-present and 30 defect-absent) are used and the reconstructed images by each method are assessed by the CHO. The detection performance is summarized using the area under the receiver operating characteristic (ROC) curve. These ROC studies represented a “signal-known exactly” and “background-known exactly” observer study. In our experiments, the CHO results were obtained for the first gate (end-diastole) frame during which the heart wall is expanded and small lesions are more easily detected [Fig. 1b].
The above quantitative metrics were computed for the reconstructed images from all the multiple noise realizations (30 normal and 30 defect-present) with different reconstruction methods and dose levels. The results from the different methods were then analyzed with t-test for statistical comparison. The Fisher transformation was applied to the CC values of TAC for normal distribution correction prior to the t-test. The ROCKIT tool34 was used for statistical comparison of the CHO results in ROC performance.
For the patient data, the LV ejection fraction is measured using the clinical software 4DM-SPECT to show the impact of dose reduction on the functional assessment using different reconstruction strategies.
RESULTS AND DISCUSSIONS
Simulation results
Overall reconstruction accuracy of the myocardium
We show in Fig. 2 the relative root MSE results of the reconstructed myocardium with different reconstruction methods at half dose and quarter dose. All these results were averaged over 30 noise realizations and the standard deviation values were indicated by the error bars for the different methods in the plot. As reference the dashed line indicates the performance achieved by the standard clinical method (ST121 at full dose). As expected, ST121 Half and Quarter showed higher relative root MSE than the standard due to the increased noise (i.e., lower counts). However, both 3D and 4D at half dose and quarter dose outperformed the standard (p-value < 10−30 in each case), due to the combination of denoising and correction for degradation factors in the reconstruction. The 4D method at half dose (4D Half) achieved the lowest relative root MSE, i.e., the best overall reconstruction accuracy, closely followed by 4D Quarter. In particular, even with 75% dose reduction, 4D reconstruction (i.e., 4D Quarter) could reduce the relative root MSE by 28.7% compared to the clinical reconstruction at standard dose (4D Quarter: 0.316 vs. standard: 0.444, p-value < 10−30).
Figure 2.

Relative root MSE of the myocardium reconstructed by different methods and dose levels. The results were averaged over 30 noise realizations and the standard deviation values were indicated by the error bars for the different methods.
LV regional bias-variance analysis
We conducted bias-variance analyses on two ROIs on the LV wall [Fig. 1b]. We show in Fig. 3 the bias-standard deviation plot of the normal and defect ROIs obtained with the different reconstruction methods. For 3D and 4D, each curve was obtained by varying the spatial parameter βs (βs = [0, 0.5, 2, 5, 7] × 10−4 for half dose, and βs = [0, 0.2, 0.5, 1, 2] × 10−3 for quarter dose); in addition, for 4D the temporal parameter was set as βt = 5 × 10⁻⁴ for half dose and βt = 1 × 10⁻³ for quarter dose. In each curve, the highest point corresponds to βs = 0 (i.e., no spatial smoothing); thus, each curve shows a decreasing trend in variance with increased βs (i.e., increased spatial smoothing).
Figure 3.

Bias-standard deviation plot for the normal (a) and defect (b) ROIs reconstructed by different methods and dose levels. The triangle symbols represent the standard, and the circle and diamond symbols represent half and quarter dose levels, respectively. Note that the smallest reconstruction error (consisting of bias and std) corresponds to the lower-left corner of the plot.
From these results, an ordered increase in bias is observed for ST121 when the count level is lowered from full dose to half dose and quarter dose. This demonstrates that without sophisticated image modeling, heavy smoothing can effectively suppress the signal variation, but will inevitably increase the bias from the true signal value. In contrast, both 3D and 4D achieved significantly reduced bias both at half dose and at quarter dose compared to the standard. At each dose level, MAP reconstruction with no spatial and temporal regularization, i.e., maximum likelihood (ML) reconstruction, generally yields the smallest bias, but suffers the largest variance. An increasing trend in bias is generally observed as the spatial parameter βs is increased for both half dose and quarter dose. This increasing trend in bias can be explained by the spatial smoothing, which generally causes the reconstructed activity to be lower than the original values because of the thin heart wall. However, a deviation from this increasing trend is observed in 3D reconstruction of the defect ROI at quarter dose when a small amount of spatial smoothing is applied [Fig. 3b]; this could be due to the fact that the higher activity of the neighboring normal myocardium can partially compensate the cold defect's activity at this low count level (Quarter). It can be seen that 4D greatly decreased the variance in the reconstruction with little bias increase compared to ML and 3D.
The bias-standard deviation plot in Fig. 3 shows the trade-off between the signal bias vs. variance when the degree of spatial smoothing is varied for each method. Owing to the fact that the reconstruction error consists of both signal bias and noise variance, the highest signal-to-noise is obtained at the lower left corner (i.e., the “knee-point”) of each curve. A notable difference is observed among the different reconstruction methods, with 4D being the most accurate; the variance level of ST121 is much lower than that of 3D, but this is at the expense of increased bias and spatial resolution due to the use of both spatial and temporal smoothing. The different methods are compared below based on the results obtained at the respective optimal knee-point of each method.
LV uniformity
In Table 1 we show the uniformity results of the LV wall reconstructed by different methods, where a smaller value means higher uniformity. These results were averaged over 30 noise realizations. As can be seen, for all the methods the LV uniformity was observed to degrade with reduced dose owing to the increased noise (p-value < 0.05 in all cases); for example, the uniformity measure was increased from 10.55 for 4D Half to 12.59 for 4D Quarter. Nevertheless, 4D Half and Quarter maintained LV myocardium uniformity very well and outperformed their respective counterparts in other methods (with p-value < 10−4, except for ST121 Half).
Table 1.
Uniformity measure of the LV wall reconstructed by different methods at half and quarter dose levels. Values are averaged over 30 noise realizations with standard deviations in parentheses. The uniformity measure for the standard (ST121 Full) is 9.52 (1.74).
| Half | Quarter | |
|---|---|---|
| ST121 | 10.78 (2.07) | 13.68 (3.01) |
| 3D | 14.38 (4.02) | 18.13 (5.04) |
| 4D | 10.55 (1.65) | 12.59 (2.59) |
While attenuation correction is expected to improve LV wall uniformity in 3D and 4D, the uniformity measure is also degraded by the noise in the reconstructed images. In particular, the high noise level in 3D simply dominates the effect of attenuation correction; in contrast, the noise level in ST121 is greatly suppressed by additional temporal smoothing, which leads to better uniformity measure. This was evident in the bias-variance results earlier in Fig. 3, where the variance level of 3D is much higher than that of ST121.
One degrading factor in 3D/4D at lower dose to LV uniformity could be the inclusion of scatter compensation, which adversely increases the image variance while improving the contrast.23
TAC
We show the CC results between the reconstructed and ideal TACs of a ROI on LV [Fig. 1c] by the different methods in Table 2. These results were averaged over 30 noise realizations. At both half dose and quarter dose, the 4D method yielded higher CC values than their respective counterparts in other methods. Compared to the standard (ST121 Full) (0.6647), the CC of TACs for 4D Half (0.6537) was very similar (p-value = 0.8236) and there was only a slight decrease for 4D Quarter (0.6328) (p-value = 0.2749).
Table 2.
CC of TAC of the LV wall reconstructed by different methods at half and quarter dose levels. Values are averaged over 30 noise realizations with standard deviations in parentheses. The value for the standard (ST121 Full) is 0.6647 (0.2010).
| Half | Quarter | |
|---|---|---|
| ST121 | 0.6325 (0.2332) | 0.5879 (0.2040) |
| 3D | 0.5216 (0.1886) | 0.4257 (0.1626) |
| 4D | 0.6537 (0.1944) | 0.6328 (0.1805) |
On the other hand, the CC values of 3D Half and 3D Quarter were notably lower than their respective counterparts in other methods (with p-value < 10−4). Again, this poor performance of 3D reconstruction was mainly due to the lack of temporal smoothing, which has an impact on recovering consistent temporal activities.23 It is also noted in Table 2 that in all methods the standard deviation values at quarter dose were smaller than their respective counterparts at half dose. This can be explained by the heavier spatial smoothing used in the reconstruction methods at quarter dose than at half dose.
Defect detectability
In Fig. 4, we summarize the defect detectability CHO results for the different methods using the area under the ROC curve (Az). A higher Az value corresponds to better detection performance. The dashed line (Az = 0.720) is the performance achieved by the standard (ST121 at full dose). Compared to the standard, both 4D Half (Az = 0.770) and 4D Quarter (Az = 0.761) yielded higher Az values; however, such differences were not found to be large enough to be statistically significant (p-value > 0.05 for both), which could be attributed to the moderate number of noise realizations used. However, at quarter dose level, the improvement by 4D in Az became large enough to be statistically significant over both ST121 (p-value = 0.0342) and 3D (p-value = 0.0283). These results demonstrate that with 4D reconstruction the defect detectability is not significantly impacted by the dose reduction (up to 75%). In comparison, 3D Half showed only some minor improvement over ST121 Half, but this advantage was diminished at quarter dose. We believe this was mainly due to the elevated noise in 3D as demonstrated in the results from other metrics above.
Figure 4.

CHO detection Az results from different methods and dose levels. The results were calculated over 30 normal and 30 defect-present noise realizations and the standard deviation values were indicated by the error bars for the different methods.
Reconstructed images
In Fig. 5, we show a set of typical images reconstructed by the different methods from one noise realization of the NCAT phantom. For brevity, only one short-axis slice of the LV myocardium is shown for two different gates [end-diastole (ED) and end-systole (ES)]. The noiseless reconstruction images and images from ST121 at full dose are shown as reference (“Ideal”) and standard images, respectively. The images with half dose generally show less noise effect and better conservation of the heart wall shape than the quarter dose images. However, this difference is minimized in the 4D images, which demonstrates less susceptibility by 4D to substantially increased imaging noise. Images of 4D Quarter are comparable to the standard images if not better. At the same count level, 4D yields less noise artifacts and better definition of the LV wall compared to ST121 and 3D.
Figure 5.
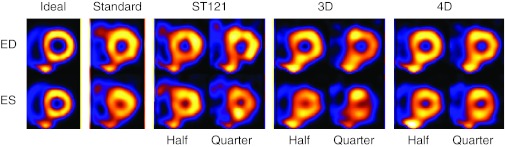
NCAT short-axis slices reconstructed by different methods (Standard: ST121 with 8 M counts; Half: 4 M counts; Quarter: 2 M counts). ED is the slice at end-diastolic time point and ES is the end-systolic. The ideal images are from OSEM reconstruction of the noiseless projection data without degradation of attenuation and scatter.
It is noted that in Fig. 5 the spillover effect of the liver seems to more noticeable in the 3D and 4D images. This is mainly attributed to the use of attenuation correction, which enhances the image intensity in the region near the liver due to the surrounding soft tissue. In contrast, without attenuation correction in ST121, the image intensity in this region gets suppressed by attenuation compared to the rest of the heart wall. Consequently, the spillover would appear more prominent in 3D and 4D than in ST121. In addition, the 3D images seem to be worse than ST121 in appearance, particularly at quarter dose, which can be explained by the elevated noise in 3D compared to ST121 (Fig. 3).
Clinical acquisition results
Shown in Fig. 6 are short-axis images for ED (top row) and ES (bottom row) gates reconstructed by different methods from a female patient study, for which the attenuation corrected study was reported as having mild anterior defect but normal wall motion and thickening. The ST121 reconstruction using the full counts (12.8M counts) is shown as the standard. For each reconstruction method the half count images (6.4M counts) are shown in the first column, and the quarter count images (3.2M counts) are shown in the second column. The mild anterior defect is seen in all ED slices (Arrow A). Also, the inferior cooling observed in the standard (Arrow B) was seen to be alleviated by AC, and was clinically interpreted as attenuation artifact. It is also noted that with the decrease in the number of counts the ST121 and 3D slices show significant loss of uniformity particularly in the ED frame where the wall is the thinnest, i.e., the noise markedly increased. However, with 4D the noise influence is minimized even at quarter dose and the appearance of the heart wall is well conserved. This illustrates the great potential of the 4D method on maintaining the image quality with significantly decreased image dose.
Figure 6.
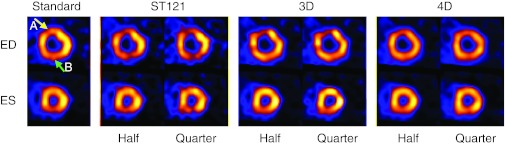
Reconstructed short-axis slices from a female patient with mild anterior perfusion defect (Standard: ST121 on 12.8M counts; Half: 6.4M counts; Quarter: 3.2M counts). ED is the slice at end-diastolic time point and ES is the end-systolic. Arrow A: mild ischemia; Arrow B: attenuation artifact.
In Fig. 7, we show short-axis images reconstructed by different methods from a male patient. This subject was interpreted clinically as normal in terms of both wall perfusion and function in attenuation corrected study. The ST121 reconstruction using the full counts (11M counts) is shown as the standard. For each reconstruction method the half count images (5.5 M counts) are shown in the first column and the quarter count images (2.75 M counts) are shown in the second column. Similar findings as in Fig. 6 can be observed in Fig. 7, except that the noise is more pronounced. In particular, the 3D Quarter images in Fig. 7 exhibited more noticeable noise than ST121 Quarter. Interestingly, this is also consistent with the observation earlier in the NCAT images in Fig. 5. This is because the total counts from this patient's myocardium are only 0.33 M compared to 0.8 M in the female patient above. The ST121 images are notably decreased in inferior perfusion (pointed to by the arrow) due to lack of AC, but this artifact is corrected in 3D and 4D which include AC. Again, the least impact in terms of noise is seen with the 4D reconstruction.
Figure 7.
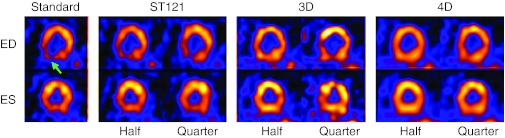
Reconstructed short-axis images from a male patient interpreted as normal in terms of wall perfusion and function (Standard: ST121 on 11M counts; Half: 5.5M counts; Quarter: 2.25M counts). ED is the slice at end-diastolic time point and ES is the end-systolic. Arrow: attenuation artifact.
From both Figs. 67, the 4D method achieves the best uniformity of the heart wall and minimizes the impact of the increased noise at substantially decreased count levels. The quarter dose 4D images show good agreement with that from 4D Half.
Finally, we also calculated the LV ejection fraction (LVEF) from the reconstructed images of the two patients using the commercial software 4D-MSPECT. The obtained results from different reconstruction strategies are summarized in Table 3. The 4D method yields higher and more consistent LVEF values at different count levels, which could be attributed to the reduced noise and less blurring of the heart wall. The difference between the half count and the quarter count is generally small for all methods. The largest discrepancy occurred in ST121 on the female patient, presumably due to the lack of attenuation correction. These results demonstrate that the impact of lowered count level on LVEF is not significant for the 4D method.
Table 3.
LVEF of two patients measured by 4D-MSPECT on images reconstructed by different methods at half and quarter dose levels.
| Patient #1 (Standard: 64%) |
Patient #2 (Standard: 39%) |
|||
|---|---|---|---|---|
| Half (%) | Quarter (%) | Half (%) | Quarter (%) | |
| ST121 | 54 | 43 | 37 | 34 |
| 3D | 63 | 58 | 38 | 36 |
| 4D | 67 | 65 | 44 | 43 |
Spatial resolution and bias levels
It is noted that with resolution recovery the spatial resolution in 3D and 4D reconstruction varies with the amount of smoothing (controlled by the regularization parameters) used in the algorithms. This was exhibited in the bias-variance results in Fig. 3, where the trade-off between reconstruction noise and bias was shown. To investigate the effect of bias and spatial resolution in these methods, we plotted the reconstructed image intensity profile for a radial cross-section through the center of the normal ROI in the LV wall used in the bias-standard deviation analysis. We show in Fig. 8 the results obtained by the different methods at half dose (the average profile over 30 noise realizations was shown for each method in order to minimize the effect of noise); similar results were also obtained at quarter dose but are omitted here for brevity. For each method the smoothing parameters with the best relative MSE were used. From these results one can see that, compared to the reference ideal, 4D achieves the best resolution recovery, followed closely by 3D, and ST121 is the worst. In terms of image intensity, both 3D and 4D showed lower bias than ST121. These results demonstrate that the better the resolution, the higher the maximum count. This is used clinically to look for wall thickening and thinning with cardiac motion.
Figure 8.

Normalized cross-sectional intensity profiles of different methods at half dose. For comparison, the profiles of ideal and standard reconstructions are also shown. The insertion shows where the intensity profile was calculated.
CONCLUSIONS
In this work we quantitatively investigated the potential utility of 4D reconstruction for GSPECT with significant lower radiation doses (from 50% to 75% reduction). Our simulation results demonstrate that better or comparable performance, measured by various metrics on reconstruction accuracy and defect detectability, can be achieved by 4D reconstruction at as low as quarter dose (∼2.25 mSv equivalent radiation dose) compared to clinical reconstruction at standard dose (∼9 mSv). Reconstructed images from two patient datasets also show that the image quality of 4D reconstruction at an equivalent quarter dose is better than clinical and 3D reconstructions at higher dose levels. The substantially decreased count level does not exhibit significant impact on the LV ejection fraction evaluation. Such a level of dose reduction (75%) has not been demonstrated in previous studies and it could bring GSPECT from a high dose procedure (>9 mSv) down to a low dose procedure (<3 mSv at quarter dose).26 These promising results warrant further investigations of the lower bound of dose reduction using 4D reconstruction with different compensation strategies and more comprehensive studies by including more patient variability. Such studies could potentially pave the way for clinical trials and lead to significantly improved risk to benefit value of GSPECT for management of patients with cardiovascular disease.
References
- Berrington de Gonzalez A., Kim K. P., Smith-Bindman R., and McAreavey D., “Myocardial perfusion scans: Projected population cancer risks from current levels of use in the United States,” Circulation 122, 2403–2410 (2010). 10.1161/CIRCULATIONAHA.110.941625 [DOI] [PMC free article] [PubMed] [Google Scholar]
- Wackers F. J. T., “Diabetes and coronary artery disease: The role of stress myocardial perfusion imaging,” Cleve Clin. J. Med. 72, 21–25 (2005). 10.3949/ccjm.72.1.21 [DOI] [PubMed] [Google Scholar]
- Williams K. A., “A historical perspective on measurement of ventricular function with scintigraphic techniques: Part II - Ventricular function with gated techniques for blood pool and perfusion imaging,” J. Nucl. Cardiol. 12, 208–215 (2005). 10.1016/j.nuclcard.2005.01.004 [DOI] [PubMed] [Google Scholar]
- F. A.MettlerJr., Thomadsen B. R., Bhargavan M., Gilley D. B., Gray J. E., Lipoti J. A., McCrohan J., Yoshizumi T. T., and Mahesh M., “Medical radiation exposure in the U.S. in 2006: Preliminary results,” Health Phys. 95, 502–507 (2008). 10.1097/01.HP.0000326333.42287.a2 [DOI] [PubMed] [Google Scholar]
- Eisenberg M. J., Afilalo J., Lawler P. R., Abrahamowicz M., Richard H., and Pilote L., “Cancer risk related to low-dose ionizing radiation from cardiac imaging in patients after acute myocardial infarction,” CMAJ 183, 430–436 (2011). 10.1503/cmaj.100463 [DOI] [PMC free article] [PubMed] [Google Scholar]
- Little M. P., Wakeford R., Tawn E. J., Bouffler S. D., and Berrington de Gonzalez A., “Risks associated with low doses and low dose rates of ionizing radiation: Why linearity may be (almost) the best we can do,” Radiology 251, 6–12 (2009). 10.1148/radiol.2511081686 [DOI] [PMC free article] [PubMed] [Google Scholar]
- Tubiana M., Feinendegen L. F., Yang C., and Kaminski J. M., “The linear no-threshold relationship is inconsistent with radiation biologic and experimental data,” Radiology 251, 13–22 (2009). 10.1148/radiol.2511080671 [DOI] [PMC free article] [PubMed] [Google Scholar]
- Cerqueira M. D., Allman K. C., Ficaro E. P., Hansen C. L., Nichols K. J., Thompson R. C., Van Decker W. A., and Yakovlevitch M., “Recommendations for reducing radiation exposure in myocardial perfusion imaging,” ASNC Information Statement(2010), http://www.asnc.org/imageuploads/RadiationReduction060110.pdf. [DOI] [PubMed]
- DePuey E. G. and Bommireddipalli S., “Half-dose myocardial perfusion SPECT with wide beam reconstruction,” Circulation 120, S334 (2009). [DOI] [PubMed] [Google Scholar]
- Marcassa C., Campini R., Zoccarato O., and Calza P., “Wide beam reconstruction for half-dose or half-time cardiac gated SPECT acquisitions: Optimization of resources and reduction in radiation exposure,” Eur J. Nucl. Med. Mol. Imaging 38, 499–508 (2011). 10.1007/s00259-010-1654-3 [DOI] [PubMed] [Google Scholar]
- Borges-Neto S., Pagnanelli R. A., Shaw L. K., Honeycutt E., Shwartz S. C., Adams G. L., and Coleman R. E., “Clinical results of a novel wide beam reconstruction method for shortening scan time of Tc-99m cardiac SPECT perfusion studies,” J. Nucl. Cardiol. 14, 555–565 (2007). 10.1016/j.nuclcard.2007.04.022 [DOI] [PubMed] [Google Scholar]
- DePuey E. G., Gadiraju R., Clark J., Thompson L., Anstett F., and Shwartz S. C., “Ordered subset expectation maximization and wide beam reconstruction “half-time” gated myocardial perfusion SPECT functional imaging: A comparison to “full-time” filtered backprojection,” J. Nucl. Cardiol. 15, 547–563 (2008). 10.1016/j.nuclcard.2008.02.035 [DOI] [PubMed] [Google Scholar]
- Ali I., Ruddy T. D., Almgrahi A., Anstett F. G., and Wells R. G., “Half-time SPECT myocardial perfusion imaging with attenuation correction,” J. Nucl. Med. 50, 554–562 (2009). 10.2967/jnumed.108.058362 [DOI] [PubMed] [Google Scholar]
- Valenta I., Treyer V., Husmann L., Gaemperli O., Schindler M. J., Herzog B. A., Veit-Heibach P., Buechel R. R., Nkoulou R., Pazhenkottil A. P., and Kaufmann P. A., “New reconstruction algorithm allows shortened acquisition time for myocardial perfusion SPECT,” Eur. J. Nucl. Med. Mol. Imaging 37, 750–757 (2010). 10.1007/s00259-009-1300-0 [DOI] [PubMed] [Google Scholar]
- Leva L., Brambilla M., Matheoud R., Vigna L., Marino P., and Inglese E., “The relationship between quantitative perfusion and functional results and acquisition time with reduced administered activity for 99mTc tetrofosmin myocardial gated-SPECT,” Clin. Nucl. Med. 37(7), e162–e169 (2012). 10.1097/RLU.0b013e31823ea42c [DOI] [PubMed] [Google Scholar]
- He X., Links J. M., and Frey E. C., “An investigation of the trade-off between the count level and image quality in myocardial perfusion SPECT using simulated images: The effects of statistical noise and object variability on defect detectability,” Phys. Med. Biol. 55, 4949–4961 (2010). 10.1088/0031-9155/55/17/005 [DOI] [PMC free article] [PubMed] [Google Scholar]
- Lalush D. S. and Tsui B. M. W., “Block-iterative techniques for fast 4D reconstruction using a priori motion models in gated cardiac SPECT,” Phys. Med. Biol. 43, 875–886 (1998). 10.1088/0031-9155/43/4/015 [DOI] [PubMed] [Google Scholar]
- Narayanan M. V., King M. A., Wernick M. N., Byrne C. L., Soares E. J., and Pretorius P. H., “Improved image quality and computation reduction in 4D reconstruction of cardiac-gated SPECT images,” IEEE Trans. Med. Imaging 19, 423–433 (2000). 10.1109/42.870253 [DOI] [PubMed] [Google Scholar]
- Gilland D. R., Mair B. A., Bowsher J. E., and Jaszczak R. J., “Simultaneous reconstruction and motion estimation for gated cardiac ECT,” IEEE Trans. Nucl. Sci. 49, 2344–2349 (2002). 10.1109/TNS.2002.803820 [DOI] [Google Scholar]
- Brankov J. G., Yang Y., and Wernick M. N., “Spatiotemporal processing of gated cardiac SPECT images using deformable mesh modeling,” Med. Phys. 32, 2839–2849 (2005). 10.1118/1.2013027 [DOI] [PubMed] [Google Scholar]
- Gravier E., Yang Y., King M. A., and Jin M., “Fully 4D motion-compensated reconstruction of cardiac SPECT images,” Phys. Med. Biol. 51, 4603–4619 (2006). 10.1088/0031-9155/51/18/010 [DOI] [PubMed] [Google Scholar]
- Jin M., Yang Y., Niu X., Marin T., Brankov J. G., Feng B., Pretorius P. H., King M. A., and Wernick M. N., “A quantitative evaluation study of four-dimensional gated cardiac SPECT reconstruction,” Phys. Med. Biol. 54, 5643–5659 (2009). 10.1088/0031-9155/54/18/019 [DOI] [PMC free article] [PubMed] [Google Scholar]
- Niu X., Yang Y., Jin M., Wernick M. N., and King M. A., “Effects of motion, attenuation, and scatter corrections on gated cardiac SPECT reconstruction,” Med. Phys. 38, 6571–6584 (2011). 10.1118/1.3660328 [DOI] [PMC free article] [PubMed] [Google Scholar]
- Ljungberg M. and Strand S. V., “A Monte Carlo program simulating scintillation camera imaging,” Comput. Methods Programs Biomed. 29, 257–272 (1989). 10.1016/0169-2607(89)90111-9 [DOI] [PubMed] [Google Scholar]
- Segars W. P., “Development of a new dynamic NURBS-based cardiac-torso (NCAT) phantom,” Ph.D. dissertation, The University of North Carolina, Chapel Hill, 2001. [Google Scholar]
- National Council on Radiation Protection and Measurements Scientific Committee 6-2 on Radiation Exposure of the U.S. Population, Ionizing radiation exposure of the population of the United States, Recommendations of the National Council on Radiation Protection and Measurements, Bethesda, MD 2009.
- Ogawa K., Harata Y., Ichihara T., Kubo A., and Hashimoto S., “A practical method for position-dependent Compton-scatter correction in single photon emission CT,” IEEE Trans. Med. Imaging 10, 408–412 (1991). 10.1109/42.97591 [DOI] [PubMed] [Google Scholar]
- LaCroix K. J., Tsui B. M. W., Frey E. C., and Jaszczak R. J., “Receiver operating characteristic evaluation of iterative reconstruction with attenuation correction in 99mTc-sestamibi myocardial SPECT images,” J. Nucl. Med. 41, 502–513 (2000). [PubMed] [Google Scholar]
- Pretorius P. H., Xia W., King M. A., Tsui B. M. W., Pan T. S., and Villegas B. J., “Evaluation of right and left ventricular volume and ejection fraction using a mathematical cardiac torso phantom,” J. Nucl. Med. 38, 1528–1535 (1997). [PubMed] [Google Scholar]
- Gagnon D., Tung C. H., Zeng L., and Hawkins W. G., “Design and early testing of a new medium-energy transmission device for attenuation correction in SPECT and PET,” in Conference Record of the 1999 IEEE Nuclear Science Symposium, pp. 1349–1353. 10.1109/NSSMIC.1999.842806 [DOI]
- Atkins F. B., Beck R. N., Hoffer P. N., and Palmer D., “Dependence of optimum baseline setting on scatter fraction and detector response function,” Medical Radioisotope Scintigraphy IAEA(1968), 101–118 (1968). [Google Scholar]
- http://www.asnc.org/imageuploads/ImagingGuidelineSPECTJune2010.pdf.
- Myers K. J. and Barrett H. H., “Addition of a channel mechanism to the ideal-observer model,” J. Opt. Soc. Am. A 4, 2447–2457 (1987). 10.1364/JOSAA.4.002447 [DOI] [PubMed] [Google Scholar]
- http://metz-roc.uchicago.edu/MetzROC.