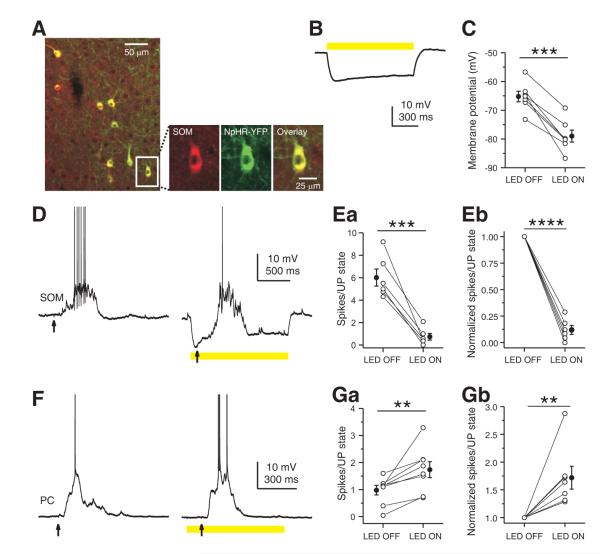
Figure 7. Inhibition of SOM INs increases firing of layers 2/3 PCs in an active network.
(A) Merged confocal image of NpHR-YFP-expressing neurons (green) and SOM-immunopositive neurons (red) in layers 2/3 barrel cortex of an adult SOM-Cre mouse, indicating NpHR expression was confined to SOM INs. Boxed region is expanded to show the overlay (yellow, right) of NpHR-YFP expression (green, middle) and SOM immunostaining (red, left). (B) Yellow light induced a large amplitude hyperpolarization in a layers 2/3 NpHR-YFP-expressing SOM interneuron. (C) Summary plot of membrane potential of layers 2/3 NpHR-YFP expressing SOM INs measured in the absence or presence of yellow light. (D) Yellow light reduced spiking of a layers 2/3 NpHR-YFP-expressing SOM interneuron during thalamus-triggered UP state due to the large hyperpolarization induced by photostimulation. (E) Population results showing that yellow light nearly completely suppressed the spiking activity of layers 2/3 NpHR-YFP-expressing SOM INs during UP states. (F) Yellow light increased spikes of a layer 2/3 PC during a thalamus-triggered UP state. (G) Population results showing that yellow light significantly increased spiking of layers 2/3 PCs during UP states. In B, D, and F, yellow bars represent photostimulation (591 nm, 1 s, 5 mW) and arrows indicate thalamic stimulation. In C, E, and G, data from the same cell are connected by a line. Open symbols represent the mean values for individual cells, and filled symbols represent the mean values across cells. Error bars indicate s.e.m. ** p < 0.01, *** p < 0.001, paired t test.

