

Abstract
Background
Since data on mercury (Hg) levels in Caucasians and African Americans (AAs) of both genders are lacking, this study aims to present toenail Hg distributions and explore the potential determinants using data from the Coronary Artery Risk Development in Young Adults Trace Element Study.
Methods
Data from 4344 Americans, aged 20–32 in 1987, recruited from Oakland, Chicago, Minneapolis and Birmingham were used to measure toenail Hg levels by instrumental neutron-activation method. The Hg distribution was described with selected percentiles and geometric means. Multivariable linear regression (MLR) was used to examine potential determinants of Hg levels within ethnicity-gender subgroups.
Results
The geometric mean of toenail Hg was 0.212 (95% CI: 0.207–0.218) μg/g. Hg levels varied geographically with Oakland the highest [0.381 (0.367–0.395) μg/g] and Minneapolis the lowest [0.140 (0.134–0.147) μg/g]. MLR analyses showed that male gender and AA ethnicity were negatively associated with toenail Hg levels; and that age, living in Oakland city, education level, alcohol consumption and total fish intake were positively associated with toenail Hg concentrations within each ethnicity-gender subgroup. Current smokers were found to have higher Hg only in AA men.
Conclusions
This study suggested age, gender, ethnicity, study center, alcohol, education level and fish consumption consistently predict toenail Hg levels. As fish consumption was the key determinant, avoiding certain types of fish that have relatively high Hg levels may be crucial in reducing Hg intake.
Keywords: Mercury, Toenail, Distribution, Determinants, American young adults, Ethnicity, CARDIA
1 Introduction
Mercury (Hg) is a ubiquitous environmental pollutant that accumulates to harmful concentrations in aquatic ecosystems (Boening 2000; Hansen and Danscher 1997). Most people are to some degree exposed to three forms of Hg: elemental (e.g. Hg vapor), inorganic (Hg2+) and organic Hg (e.g. methylmercury [MeHg]). While elemental and inorganic forms of Hg are mainly related to occupational exposure, MeHg is the main exposure in the general population (Chalmers et al. 2011), and has become a particular public health concern because it is more toxic than inorganic Hg due to its bioavailability (Bakir et al. 1973; Harada 1995). MeHg in seafood or fish is the predominant source of Hg in food (Bloom et al. 1991). Because of the potential risks to the health from Hg via food, the need to assess individual Hg intake and tissue levels is clear.
A true estimation of MeHg intake from fish is extremely difficult because of the large variations of MeHg concentrations in different types of fish and in fish produced in different geographic areas(US-EPA 1997). Also, quantifying Hg content directly in fish meals may not be feasible in large cohort studies. Thus, assay of biological specimens, which reflects consumption, is preferred both as a measure of intake and as a means to validate other forms of exposure assessment (Willett 1998).
Among various biological specimens, toenails provide a relatively long-term measure of Hg exposure as compared with blood, urine even hair sample, as toenail clippings represent body intake or exposure for a time frame from a few months to a year (He 2011). Also, they are easily collected, transported, stored and cleaned (He 2011; Morris et al. 1983). In addition, as compared with hair, they are relatively sheltered from environmental contaminants and less likely to be contaminated by shampoo, hair treatments and medication (He 2011). Moreover, Hg levels in toenails have a relatively high correlation with Hg intake (Pearson correlation r= 0.54) (Ohno et al. 2007) and with Hg levels in critical organs (such as occipital cortex, r = 0.65) (Bjorkman et al. 2007). Furthermore, toenail Hg concentrations are suggested to be useful biomarkers of exposure in which a single sample is assumed to represent a long-term exposure (Garland et al. 1993).
Previous studies have reported Hg concentrations of general population in the US and worldwide (Fujita and Takabatake 1977; Leino and Lodenius 1995; Smith et al. 1997; Dumont et al. 1998; Becker et al. 2002; Guallar et al. 2002; Yoshizawa et al. 2002; Becker et al. 2003; Schober et al. 2003; Rees et al. 2007; Oken et al. 2008; Son et al. 2009; Mozaffarian et al. 2011) However, these studies were conducted either only among women or children or without gender- or race- specific data, or using Hg concentrations in blood, urine or hair as biomarkers. Except for a few small sample-sized descriptive studies (Rees et al. 2007; Ohno et al. 2007), and a couple of small-scaled case-control studies used toenail Hg as a biomarker (Yoshizawa et al. 2002; Guallar et al. 2002), only one large-scaled case-control study reported toenail Hg levels at baseline in 1987 (Mozaffarian et al. 2011). Yet, that study was conducted in middle-aged men and women. Therefore, the main goal of this work is present toenail Hg distributions in both Caucasian and Africa American (AA) young adults of both genders and to explore potential determinants of toenail Hg levels using data from four US cities including Birmingham, Alabama; Chicago, Illinois; Minneapolis, Minnesota; and Oakland, California in 1980s from the Coronary Artery Risk Development in Young Adults (CARDIA) Trace Element Study.
2 Methods
2.1 Study population
CARDIA is an ongoing, multi-center, prospective cohort study designed to examine psychological and other lifestyle factors that might affect evolution of cardiovascular disease (CVD) risk among American young adults. Details of the study design have been published elsewhere (Friedman et al. 1988). Briefly, the cohort was roughly balanced by age (18–24 and 25–30 years), gender, race (AA and Caucasian), and education (high school or below and beyond high school). The CARDIA Trace Element Study was an ancillary study of CARDIA and aimed to examine the potential association of certain trace elements such as selenium (Se), chromium (Cr), Hg, Arsenic (As), Cadmium (Cd) and Lead (Pb) with CVD risk factors among American young adults.
In the present study, a total of 4624 participants attended the first follow-up examination in 1987, of which 4362 (94.3%) participants provided toenail clippings (Xun et al. 2010). After excluding 18 participants who had missing data either on Hg levels or on toenail weight, 4344 participants were included in this analysis. All participants signed an informed consent, and the study design, data collection and analyses were approved by the institutional review boards of the participating institutions.
2.2 Toenail mercury analysis
Toenails were collected by clipping with a stainless steel clipper from each of the ten toes during the clinic in 1987. All toenail clippings were cleaned with a quartz knife by scraping off any attached gross debris on the edge and the surface and then were washed in a sonicator with 10% nitric acid followed by high-purity water using 10-minute exposure times. The nail clippings were then captured on a filter paper, rinsed thoroughly with high-purity water, and freeze dried. The levels of Hg were analyzed by instrumental neutron-activation analysis (INAA) at the University of Missouri Research Reactor using a modification of the method previously described (Morris et al. 1983), and were reported in μg/g with the limit of detection (LOD) “0.001 μg/g ”. The laboratory personnel were blinded to other clinical measures and treated toenail specimens in random order. Quality control was conducted in 48 batches. Each batch contained duplicate samples of 2 different quality materials. The overall recovery rate was 101.2% (standard error: 2.5%). No batch effect was found when regressing recovery rate on the batch number with inverse of variance as the weight [beta coefficient = 0.02, 95% confidence interval (CI): −0.08 to 0.12]. The average coefficient of variation for Hg concentration in duplicate subsamples of toenails was 6.8% in the present study.
2.3 Covariates measurement
Demographic variables were collected via questionnaire. Smoking status was determined according to self-report and serum cotinine. Participants were classified into three groups: current smokers; former smokers and never smokers based on self-report. Serum cotinine concentration over 15ng/ml was used to determine current smokers who denied smoking (Houston et al. 2006). Alcohol intake was assessed through a self-administered questionnaire and interview-based dietary history. Education levels were classified into two groups, ≤16 vs. >16 years of education. Diet history was interviewer-administrated (McDonald et al. 1991) and conducted in 1985, and the information of how to extract the fish consumption was previously described in details (Xun et al. 2011).
2.4 Statistical methods
The distribution of toenail Hg levels was described through the calculation of percentiles and geometric means. Natural logarithm transformation [ln(Hg)] was used to improve the normality of Hg distribution. Exact 95% CIs for percentiles of Hg were calculated using a binomial-based method (StataCorp LP. 2009), while 95% CIs for geometric means were calculated by exponentiation the confidence limits of the arithmetic mean of ln(Hg). Analysis of variance was used to compare the geometric mean with the reference by using ln(Hg) as the dependent variable, which was followed by Scheffe test for multiple comparisons as appropriate.
Total fish consumption was described between groups with median [inter-quartile range (IQR)] as the distribution was not normal. Kruskal-Wallis test was used to compare the total fish consumption between groups followed by a Bonferroni correction for multiple comparisons if needed.
Using multiple linear regression (MLR), ln (Hg) was regressed against age, gender, race, study center, smoking status, alcohol consumption, education level and consumptions of fish as independent variables to examine whether these variables were independently associated with toenail Hg levels. Wald Z statistics were calculated to test the null hypotheses that the beta coefficients were not different from zero.
All analyses were performed using STATA 11.0 (Stata Corporation LP, College Station, Texas, US). P≤0.05 was considered statistically significant.
3 Results
The overall geometric mean concentration of toenail Hg, which was supposed to represent total Hg including both inorganic and organic Hg, was 0.212 μg/g (95% CI, 0.207–0.218 μg/g), with a range from 0.001 to 5.595 μg/g. Geometric means and selected percentiles with 95% CIs for toenail Hg levels, overall and from subgroups defined by selected variables, are shown in Table 1. Average toenail Hg levels from Oakland area were the highest, about 2.5 times as much as Hg levels of those from Minneapolis area (the lowest).
Table 1.
Geometric means and selected percentiles of toenail Hg levels (μg/g) by selected variables, the CARDIA Trace Element Study
| No. of participants | Geometric Mean (95%CI) | P Valuea | Selected percentiles (95%CI)b
|
|||||||
|---|---|---|---|---|---|---|---|---|---|---|
| 5th | 10th | 25th | 50th | 75th | 90th | 95th | ||||
| Total | 4344 | 0.212 (0.207, 0.218) | 0.053 (0.050, 0.056) | 0.075 (0.071, 0.078) | 0.124 (0.120, 0.129) | 0.214 (0.207, 0.220) | 0.374 (0.362, 0.386) | 0.615 (0.590, 0.639) | 0.807 (0.772, 0.860) | |
|
| ||||||||||
| Center | ||||||||||
| Birminghamc | 1015 | 0.179 (0.171, 0.188) | 0.053 (0.048, 0.057) | 0.073 (0.063, 0.078) | 0.113 (0.108, 0.119) | 0.182 (0.175, 0.189) | 0.285 (0.267, 0.296) | 0.448 (0.413,0.489) | 0.633 (0.545, 0.697) | |
| Chicago | 938 | 0.210 (0.198, 0.221) | <0.001 | 0.058 (0.049, 0.063) | 0.076 (0.069, 0.084) | 0.120 (0.111, 0.131) | 0.208 (0.193, 0.226) | 0.362 (0.346, 0.390) | 0.642 (0.582,0.706) | 0.844 (0.791, 0.934) |
| Minneapolis | 1213 | 0.140 (0.134, 0.147) | <0.001 | 0.036 (0.032, 0.042) | 0.053 (0.049, 0.057) | 0.089 (0.083, 0.095) | 0.144 (0.138, 0.151) | 0.227 (0.214, 0.240) | 0.364 (0.339,0.392) | 0.498 (0.448, 0.558) |
| Oakland | 1178 | 0.381 (0.367, 0.395) | <0.001 | 0.132 (0.124, 0.145) | 0.172 (0.161, 0.183) | 0.250 (0.242, 0.266) | 0.381 (0.363, 0.393) | 0.551 (0.528, 0.591) | 0.834 (0.771,0.906) | 1.134 (1.016, 1.310) |
|
| ||||||||||
| Gender | ||||||||||
| Male | 1968 | 0.189 (0.182, 0.197) | <0.001 | 0.043 (0.037, 0.047) | 0.062 (0.058, 0.067) | 0.111 (0.105, 0.115) | 0.191 (0.182, 0.2000) | 0.341 (0.325, 0.360) | 0.578 (0.534, 0.619) | 0.780 (0.729, 0.855) |
| Female | 2376 | 0.233 (0.226, 0.241) | 0.050 (0.043, 0.054) | 0.074 (0.068, 0.080) | 0.133 (0.126, 0.139) | 0.242 (0.232, 0.254) | 0.444 (0.418, 0.462) | 0.721 (0.678, 0.768) | 0.951 (0.898, 1.049) | |
|
| ||||||||||
| Race | ||||||||||
| AA | 2103 | 0.190 (0.184, 0.197) | <0.001 | 0.057 (0.053, 0.062) | 0.076 (0.072, 0.079) | 0.116 (0.112, 0.121) | 0.190 (0.183, 0.199) | 0.323 (0.308, 0.338) | 0.473 (0.449, 0.502) | 0.644 (0.596, 0.683) |
| Caucasian | 2241 | 0.235 (0.227, 0.244) | 0.050 (0.043, 0.054) | 0.074 (0.068, 0.080) | 0.133 (0.126, 0.139) | 0.242 (0.232, 0.254) | 0.444 (0.418, 0.462) | 0.721 (0.678, 0.768) | 0.951 (0.898, 1.049) | |
|
| ||||||||||
| Smoking Status | ||||||||||
| Currentc | 1342 | 0.190 (0.183, 0.198) | 0.055 (0.050, 0.059) | 0.073 (0.068, 0.079) | 0.115 (0.110, 0.121) | 0.188 (0.179, 0.199) | 0.327 (0.311, 0.343) | 0.497 (0.471, 0.522) | 0.645 (0.603, 0.745) | |
| Former | 594 | 0.238 (0.220, 0.256) | <0.001 | 0.049 (0.033, 0.057) | 0.072 (0.061, 0.083) | 0.137 (0.122, 0.154) | 0.251 (0.232, 0.272) | 0.445 (0.404, 0.488) | 0.730 (0.663, 0.770) | 0.932 (0.807, 1.101) |
| Never | 2390 | 0.219 (0.211, 0.227) | <0.001 | 0.053 (0.049, 0.058) | 0.076 (0.071, 0.081) | 0.128 (0.121, 0.133) | 0.220 (0.213, 0.230) | 0.386 (0.369, 0.400) | 0.642 (0.607, 0.669) | 0.858 (0.801, 0.920) |
|
| ||||||||||
| Alcohol consumption, ml/d | ||||||||||
| 0c | 1715 | 0.185 (0.178, 0.193) | 0.049 (0.042, 0.053) | 0.068 (0.062, 0.072) | 0.111 (0.106, 0.117) | 0.187 (0.178, 0.197) | 0.320 (0.305, 0.340) | 0.489 (0.465, 0.529) | 0.662 (0.619, 0.715) | |
| 0.1–11.9 | 1227 | 0.231 (0.220, 0.242) | <0.001 | 0.058 (0.050, 0.068) | 0.082 (0.077, 0.089) | 0.134 (0.126, 0.143) | 0.234 (0.219, 0.249) | 0.410 (0.388, 0.432) | 0.649 (0.606, 0.700) | 0.825 (0.770, 0.923) |
| ≥12.0 | 1391 | 0.233 (0.222, 0.244) | <0.001 | 0.055 (0.050, 0.061) | 0.079 (0.071, 0.086) | 0.133 (0.126, 0.140) | 0.234 (0.221, 0.246) | 0.414 (0.382, 0.442) | 0.709 (0.647, 0.765) | 0.922 (0.870, 1.030) |
|
| ||||||||||
| Education, years | ||||||||||
| <16 | 2850 | 0.184 (0.179, 0.190) | <0.001 | 0.050 (0.048, 0.054) | 0.070 (0.066, 0.073) | 0.113 (0.108, 0.116) | 0.185 (0.179, 0.193) | 0.315 (0.303, 0.326) | 0.498 (0.472, 0.522) | 0.650 (0.617, 0.690) |
| ≥16 | 1491 | 0.279 (0.267, 0.292) | 0.061 (0.056, 0.070) | 0.091 (0.084, 0.100) | 0.162 (0.152, 0.173) | 0.292 (0.279, 0.304) | 0.496 (0.468, 0.526) | 0.806 (0.747, 0.863) | 1.070 (0.959, 1.173) | |
| Total fish, servings / day | ||||||||||
| Tertile 1: 0~0.34c | 1449 | 0.158 (0.151, 0.166) | 0.035 (0.032, 0.040) | 0.054 (0.049, 0.058) | 0.094 (0.088, 0.098) | 0.163 (0.152, 0.173) | 0.287 (0.273, 0.301) | 0.457 (0.432, 0.489) | 0.607 (0.555, 0.681) | |
| Tertile 2: 0.35~1.03 | 1450 | 0.221 (0.212, 0.230) | <0.001 | 0.067 (0.058, 0.072) | 0.089 (0.083, 0.094) | 0.134 (0.126, 0.139) | 0.222 (0.212, 0.234) | 0.362 (0.348, 0.381) | 0.586 (0.543, 0.623) | 0.745 (0.713, 0.807) |
| Tertile 3: ≥1.04 | 1443 | 0.274 (0.262, 0.286) | <0.001 | 0.072 (0.065, 0.077) | 0.093 (0.087, 0.103) | 0.160 (0.153, 0.167) | 0.272 (0.254, 0.287) | 0.477 (0.449, 0.507) | 0.764 (0.710, 0.828) | 1.045 (0.944, 1.124) |
Abbreviations: AA, African American; CARDIA, Coronary Artery Risk Development in Young Adults; CI: Confidence interval; Hg, Mercury. Hg levels of participants from four centers are significantly different from one another; differences in Hg levels between former and never smokers are statistically non-significant; Hg levels among those two non-zero alcohol consumption groups are statistically non-significant; differences in Hg levels between the second and the third tertiles of total fish consumption are also statistically significant.
Analysis of variance followed by Scheffe test for multiple comparison (if needed), comparing the geometric mean with the reference.
Confidence intervals were calculated using binomial exact method.
The reference for comparison of geometric means.
Of note, fish consumptions were relatively higher in those lived in Birmingham, Chicago and Oakland, men, alcohol drinkers and those with a college education or beyond (Table 2). Fish consumption was positively correlated with toenail Hg levels after adjustment for age, gender, race and center (Spearman correlation = 0.30, P<0.01).
Table 2.
Total fish consumption (servings / day) in subgroups of selected variables, the CARDIA Trace Element Study
| Subgroup | No. of participants | Median (IQR) | P-valuea |
|---|---|---|---|
| Centerb | |||
| Birmingham | 1015 | 0.66 (0.30–1.35) | <0.01 |
| Chicago | 937 | 0.71 (0.26–1.54) | |
| Minneapolis | 1212 | 0.46 (0.13–1.10) | |
| Oakland | 1178 | 0.69 (0.28–1.42) | |
| Gender | |||
| Male | 1967 | 0.68 (0.23–1.51) | <0.01 |
| Female | 2375 | 0.58 (0.21–1.25) | |
| Race | |||
| AA | 2103 | 0.59 (0.20–1.34) | 0.45 |
| Caucasian | 2239 | 0.62 (0.23–1.35) | |
| Smoking Status | |||
| Current | 1341 | 0.59 (0.20–1.36) | 0.15 |
| Non-current | 2983 | 0.62 (0.23–1.34) | |
| Alcohol consumption (ml/d)c | |||
| 0 | 1714 | 0.51 (0.16–1.14) | <0.01 |
| 0.1–11.9 | 1226 | 0.63 (0.25–1.28) | |
| ≥12.0 | 1391 | 0.77 (0.30–1.62) | |
| Education, years | |||
| <16 | 2849 | 0.56 (0.20–1.28) | <0.01 |
| ≥16 | 1490 | 0.72 (0.31–1.46) | |
Abbreviations: AA, African American; CARDIA, Coronary Artery Risk Development in Young Adults; IQR, inter-quartile range.
P values were for any difference across all subgroups obtained by using Kruskal-Wallis test, Bonferroni correction was used for multiple comparison if needed.
Fish consumptions of participants from Oakland, Chicago, and Birmingham are not significantly different from one another.
Fish consumptions of participants from three alcohol consumption groups are significant different from each other.
Results of MLR analyses are shown in Table 3. Ln(Hg) concentrations served as the dependent variables and were modeled for each gender-race subgroup. Age was significantly and positively associated with Hg levels in all subgroups except in AA women. The multivariate adjusted mean values of Hg across study centers showed different patterns among four gender-race subgroups. While multivariate adjusted mean values of Hg in Caucasians (both men and women) across four study centers took the pattern of “Oakland>Chicago>Birmingham>Minneapolis”, the pattern showed little difference between AA men (“Oakland > Chicago = Birmingham > Minneapolis”) and AA women (“Oakland > Birmingham = Chicago = Minneapolis”). Current smokers had higher Hg levels compared with non-current smokers only in AA Men. Among four gender-race subgroups, alcohol consumption, education levels and total fish consumption were independently and positively associated with toenail Hg levels (all P values for trend <0.05 for alcohol consumption and total fish consumption, all P values <0.01 for education level). The proportion of variation in Hg levels explained by four race-gender specific regression models was low (R square = 30%, 36%, 32% and 35%, respectively, in AA men, AA women, Caucasian men and Caucasian women).
Table 3.
Estimated β coefficients (SEs) of natural logarithm of toenail Hg levels (μg/g) over race and gender, the CARDIA Trace Element Studya
| Covariates | AA Men (n=913)
|
AA Women (n=1190)
|
Caucasian Men (n=1055)
|
Caucasian Women (n=1186)
|
Total (n=4344)
|
|||||
|---|---|---|---|---|---|---|---|---|---|---|
| β (SE) | P-valueb | β (SE) | P-valueb | β (SE) | P-valueb | β (SE) | P-valueb | β (SE) | P-valueb | |
| Intercept | −2.74 (0.18) | −2.13 (0.12) | −2.83 (0.21) | −2.61 (0.18) | −2.83 (0.09) | |||||
| Agec | 0.07 (0.03) | 0.04 | 0.04 (0.02) | 0.08 | 0.11 (0.04) | <0.01 | 0.12 (0.03) | <0.01 | 0.08 (0.02) | <0.01 |
| Male gender | -- | -- | -- | -- | -- | -- | -- | -- | −0.24 (0.02) | <0.01 |
| AA race | -- | -- | -- | -- | -- | -- | -- | -- | −0.17 (0.02) | <0.01 |
| Center | ||||||||||
| Birmingham | Referent | Referent | Referent | Referent | Referent | |||||
| Chicago | 0.01 (0.07) | 0.94 | −0.07 (0.05) | 0.15 | 0.15 (0.07) | 0.04 | 0.23 (0.07) | <0.01 | 0.11 (0.03) | <0.01 |
| Minneapolis | −0.19 (0.07) | <0.01 | −0.07 (0.05) | 0.19 | −0.36 (0.07) | <0.01 | −0.30 (0.06) | <0.01 | −0.23 (0.03) | <0.01 |
| Oakland | 0.78 (0.06) | <0.01 | 0.79 (0.04) | <0.01 | 0.61 (0.07) | <0.01 | 0.66 (0.06) | <0.01 | 0.73 (0.03) | <0.01 |
| Smoking Status | ||||||||||
| Non-current | Referent | Referent | Referent | Referent | Referent | |||||
| Current | 0.16 (0.05) | <0.01 | 0.03 (0.04) | 0.50 | −0.08 (0.06) | 0.15 | −0.08 (0.05) | 0.14 | 0.00 (0.02) | 0.92 |
| Alcohol consumption, ml/d | ||||||||||
| 0 | Referent | Referent | Referent | Referent | Referent | |||||
| 0.1–11.9 | 0.07 (0.06) | 0.25 | 0.09 (0.04) | 0.02 | 0.08 (0.07) | 0.22 | 0.17 (0.05) | <0.01 | 0.12 (0.03) | <0.01 |
| ≥12.0 | 0.17 (0.06) | 0.01 | 0.06 (0.05) | 0.18 | 0.16 (0.06) | 0.01 | 0.33 (0.05) | <0.01 | 0.21 (0.03) | <0.01 |
| Education, years | ||||||||||
| <16 | Referent | Referent | Referent | Referent | Referent | |||||
| ≥16 | 0.21 (0.07) | <0.01 | 0.11 (0.04) | 0.01 | 0.32 (0.05) | <0.01 | 0.17 (0.05) | <0.01 | 0.24 (0.03) | <0.01 |
| Total fish, servings / day | ||||||||||
| Tertile 1: 0~0.34 | Referent | Referent | Referent | Referent | Referent | |||||
| Tertile 2: 0.35~1.03 | 0.20 (0.06) | <0.01 | 0.09 (0.04) | 0.03 | 0.46 (0.06) | <0.01 | 0.25 (0.05) | <0.01 | 0.25 (0.03) | <0.01 |
| Tertile 3: ≥1.04 | 0.42 (0.06) | <0.01 | 0.22 (0.04) | <0.01 | 0.64 (0.06) | <0.01 | 0.48 (0.05) | <0.01 | 0.44 (0.03) | <0.01 |
Abbreviations: AA, African American; CARDIA, Coronary Artery Risk Development in Young Adults; Hg, Mercury; SE: standard error.
We constructed four independent multiple linear regression models for four race-gender groups that contained all variables in this table.
P-values were obtained using Wald’s Z test.
Natural logarithm of toenail mercury per 5 years of age.
Fig. 1 shows the variation of toenail Hg levels across study center and fish consumption levels, the two main influential factors. Within each center, the higher fish consumption, the higher Hg levels. Within the same fish consumption levels, Hg levels vary across four centers, with Oakland the highest and Minneapolis the lowest.
Fig 1.
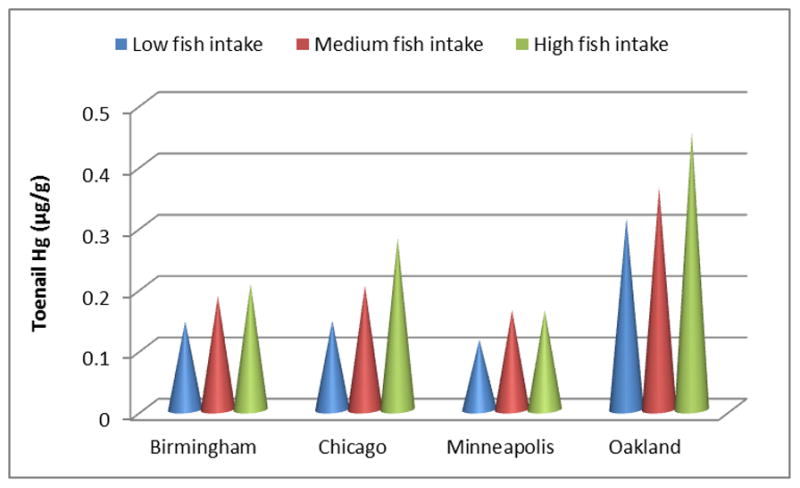
Toenail mercury levels (μg/g) stratified by study center and fish consumption levels (tertiles)
4 Discussion
In this cohort of American young adults, including AAs and Caucasians, men and women, we found that toenail Hg levels were associated with age, gender, race, study center, education level, alcohol consumption, and total fish consumptions. Women, Caucasians, those with a college education or above, alcohol drinkers and higher fish consumers were more likely to have higher toenail Hg levels. Participants from Oakland area had relatively higher Hg levels.
The median toenail Hg level in this study was 0.212 μg/g, was generally similar to levels reported in most of the previous studies (from 0.22 to 0.27 μg/g) (Alfthan 1997; Bjorkman et al. 2007; Garland et al. 1993; Rees et al. 2007), and lower than these (about 0.369 μg/g ) in 3427 middle-aged controls in a recent case-control study (Mozaffarian et al. 2011). Of note, several factors such as participants’ age, residency and the years toenail sample collected should be considered when comparing Hg levels from these studies. Conversely, it was difficult to compare our results with Hg levels reported in some other studies, such as the National Health and Nutrition Examination Survey (NHANES) and the Baltimore Memory study, in which Hg was detected in different biological samples (e. g., blood or hair) with different analytic methods (Mahaffey et al. 2004; Schober et al. 2003; Weil et al. 2005). Toenail Hg levels varied geographically. Average toenail Hg levels in participants from Oakland area were the highest, almost 2.5 times as much as Hg levels in those from the Minneapolis area. The difference was generally in accordance with regional distribution of Hg content in soil as indicated by the U.S. Geological Survey (Shacklette and Boerngen 1984). In addition, a number of streams and bodies of water in Northern California have Hg-containing sediments at high levels as the coastal mountains of this region are naturally rich in Hg-containing cinnabar ores (Mahaffey et al. 2004). The positive correlations among MeHg levels in sediment, water and fish has been identified in national wide survey of 20 US watersheds (Brumbaugh et al. 2001).
Several factors were identified to be associated with elevated toenail Hg levels. Per 5-year increment of age, toenail Hg levels increased by 0.04~0.12 unit in ln[Hg,(μg/g)]. This may be due to the accumulation of Hg in the human body with aging. Though females consumed slightly less fish than males (median: 0.58 vs. 0.68 servings /day), had greater percentage of body fat, for which Hg has lower affinity comparing to muscle tissue, than males and liked nail cares, which can involve the use of several chemical chemicals including organic solvents, much more than males, this study indicated higher Hg levels among females than males. The gender heterogeneity might mainly be due to the higher urinary excretion rates in males, which has been suggested to be related to sex hormones, specially androgens, in animal studies (Hirayama and Yasutake 1986).
In addition, our data indicated a racial difference in toenail Hg. Within each gender group, toenail Hg levels in Caucasians were higher compared with AAs. The racial variation in Hg levels has been previously reported (Mahaffey et al. 2004; Hightower et al. 2006), which was consistently due to differential fish consumption in subgroups. Although total fish consumption in Caucasians was not statistically significantly higher than that in AAs (0.62 vs.0.59 servings / day, P =0.45) in this study, the racial difference in toenail Hg levels may reflect the accumulation of Hg levels from the extra fish consumption. Participants with a college education or beyond showed significant higher toenail Hg levels than those with lower education levels, which was supported by the fact that those with higher education levels consumed a higher amount of fish (0.72 vs. 0.56 servings /day, P <0.01). Education could be considered as a marker of socio-economic status and those with higher education level are more likely to eat seafood.
Alcohol consumption is another important determinant of toenail Hg concentrations. Alcohol consumption was positively correlated to fish consumption so that may explain the relatively higher concentration of toenail Hg in alcohol drinkers. Smoking was found to be positively associated with toenail Hg levels too, but only in AA Men. Besides that current smokers consumed more fish (0.74 vs. 0.60 servings /day, P =0.03) in this subgroup; the findings were consistent with results from a previous study and suggest that cigarette smoking may be a source of Hg exposure (Mortada et al. 2004). Notably, the current smokers in this subgroup had the heaviest exposure to smoking, denoted by 49.2 hours/week exposure to smoking either at home or in other areas as compared with 43.7 hours/week in other three subgroups. As expected, the key determinant of toenail Hg levels was fish consumption. This study found that the larger amount of fish consumption, the higher levels of toenail Hg. Avoiding certain types of fish, which contains relatively high levels of Hg, is of great public health significance (He 2009).
There is ample evidence that Hg measurement in toenails is an excellent indicator of long-term Hg exposure (Garland et al. 1993; Mozaffarian et al. 2011), and has been used widely in epidemiological studies (Guallar et al. 2002; Yoshizawa et al. 2002). Of note, this study included approximately equal percentages of AAs (48.5%) and Caucasians, and men (45.3%) and women, which makes the study population unique.
In addition to the strengths highlighted above, a couple of limitations should be considered when interpreting the findings. First, no information to identify types of fish consumed by participants was available, which limited our capability to further explore the major sources of toenail Hg. Second, all participants were from urban areas so that their Hg levels might not represent those in the general US population.
5 Conclusions
In summary, our findings provided valuable information on Hg distribution among American young adults two decades ago, which may serve as a baseline or a reference for future studies, and made it possible to determine the trend or change in toenail Hg levels that can be used to examine its relation to chronic disease development as well as to indicate environmental change. Age, gender, race, study center, smoking status, alcohol consumption, education levels and fish consumption are found to be significantly associated with toenail Hg levels. As fish consumption is the key determinant of toenail Hg concentration and other predictors are somehow related to fish consumption, avoiding certain types of fish that have relatively high levels of Hg may be crucial in reducing Hg levels in human body.
Acknowledgments
This study was supported by a grant R01HL081572 and contracts N01-HC-48047, N01-HC-48048, N01-HC-48049, N01-HC-48050, and N01-HC-95095 from the National Institutes of Health. The authors thank Drs. Lyn M. Steffen and Young-il Kim for their helpful comments. The authors also thank the other investigators and staffs of the Coronary Artery Risk Development in Young Adults (CARDIA) Study for their valuable contributions.
References
- Alfthan G. Toenail mercury concentration as a biomarker of methylmercury exposure. Biomarker. 1997;2 (4):233–238. doi: 10.1080/135475097231607. [DOI] [PubMed] [Google Scholar]
- Archer SL, Green D, Chamberlain M, Dyer AR, Liu K. Association of dietary fish and n-3 fatty acid intake with hemostatic factors in the coronary artery risk development in young adults (CARDIA) study. Arterioscler Thromb Vasc Biol. 1998;18 (7):1119–1123. doi: 10.1161/01.atv.18.7.1119. [DOI] [PubMed] [Google Scholar]
- Bakir F, Damluji SF, Amin-Zaki L, Murtadha M, Khalidi A, al-Rawi NY, Tikriti S, Dahahir HI, Clarkson TW, Smith JC, Doherty RA. Methylmercury poisoning in Iraq. Science. 1973;181 (96):230–241. doi: 10.1126/science.181.4096.230. [DOI] [PubMed] [Google Scholar]
- Becker K, Kaus S, Krause C, Lepom P, Schulz C, Seiwert M, Seifert B. German Environmental Survey 1998 (GerES III): environmental pollutants in blood of the German population. Int J Hyg Environ Health. 2002;205 (4):297–308. doi: 10.1078/1438-4639-00155. [DOI] [PubMed] [Google Scholar]
- Becker K, Schulz C, Kaus S, Seiwert M, Seifert B. German Environmental Survey 1998 (GerES III): environmental pollutants in the urine of the German population. Int J Hyg Environ Health. 2003;206 (1):15–24. doi: 10.1078/1438-4639-00188. [DOI] [PubMed] [Google Scholar]
- Bjorkman L, Lundekvam BF, Laegreid T, Bertelsen BI, Morild I, Lilleng P, Lind B, Palm B, Vahter M. Mercury in human brain, blood, muscle and toenails in relation to exposure: an autopsy study. Environ Health. 2007;6:30. doi: 10.1186/1476-069X-6-30. [DOI] [PMC free article] [PubMed] [Google Scholar]
- Bloom NS, Watras CJ, Hurley JP. Impact of Acidification on the Methylmercury Cycle of Remote Seepage Lakes. Water Air Soil Pollu. 1991;56:477–491. [Google Scholar]
- Boening DW. Ecological effects, transport, and fate of mercury: a general review. Chemosphere. 2000;40 (12):1335–1351. doi: 10.1016/s0045-6535(99)00283-0. [DOI] [PubMed] [Google Scholar]
- Brumbaugh WG, Krabbenhoft DP, Helsel DR, GWJ, REK . US Dept of the Interior, US Geological Survey. Available from the National Technical Information Service; [Columbia, MO][Springfield, Va]: 2001. A national pilot study of mercury contamination of aquatic ecosystems along multiple gradients bioaccumulation in fish. [Google Scholar]
- Chalmers AT, Argue DM, Gay DA, Brigham ME, Schmitt CJ, Lorenz DL. Mercury trends in fish from rivers and lakes in the United States, 1969–2005. Environ Monit Assess. 2011;175(1–4):175–191. doi: 10.1007/s10661-010-1504-6. [DOI] [PubMed] [Google Scholar]
- Dumont C, Girard M, Bellavance F, Noel F. Mercury levels in the Cree population of James Bay, Quebec, from 1988 to 1993/94. CMAJ. 1998;158 (11):1439–1445. [PMC free article] [PubMed] [Google Scholar]
- Friedman GD, Cutter GR, Donahue RP, Hughes GH, Hulley SB, Jacobs DR, Jr, Liu K, Savage PJ. CARDIA: study design, recruitment, and some characteristics of the examined subjects. J Clin Epidemiol. 1988;41 (11):1105–1116. doi: 10.1016/0895-4356(88)90080-7. [DOI] [PubMed] [Google Scholar]
- Fujita M, Takabatake E. Mercury levels in human maternal and neonatal blood, hair and milk. Bull Environ Contam Toxicol. 1977;18 (2):205–209. doi: 10.1007/BF01686068. [DOI] [PubMed] [Google Scholar]
- Garland M, Morris JS, Rosner BA, Stampfer MJ, Spate VL, Baskett CJ, Willett WC, Hunter DJ. Toenail trace element levels as biomarkers: reproducibility over a 6-year period. Cancer Epidemiol Biomarkers Prev. 1993;2 (5):493–497. [PubMed] [Google Scholar]
- Guallar E, Sanz-Gallardo MI, van't Veer P, Bode P, Aro A, Gomez-Aracena J, Kark JD, Riemersma RA, Martin-Moreno JM, Kok FJ. Mercury, fish oils, and the risk of myocardial infarction. N Engl J Med. 2002;347 (22):1747–1754. doi: 10.1056/NEJMoa020157. [DOI] [PubMed] [Google Scholar]
- Hansen JC, Danscher G. Organic mercury: an environmental threat to the health of dietary-exposed societies? Reviews on environmental health. 1997;12 (2):107–116. doi: 10.1515/reveh.1997.12.2.107. [DOI] [PubMed] [Google Scholar]
- Harada M. Minamata disease: methylmercury poisoning in Japan caused by environmental pollution. Crit Rev Toxicol. 1995;25 (1):1–24. doi: 10.3109/10408449509089885. [DOI] [PubMed] [Google Scholar]
- He K. Fish, long-chain omega-3 polyunsaturated fatty acids and prevention of cardiovascular disease--eat fish or take fish oil supplement? Prog Cardiovasc Dis. 2009;52 (2):95–114. doi: 10.1016/j.pcad.2009.06.003. [DOI] [PubMed] [Google Scholar]
- He K. Trace elements in nails as biomarkers in clinical research. Eur J Clin Invest. 2011;41 (1):98–102. doi: 10.1111/j.1365-2362.2010.02373.x. [DOI] [PMC free article] [PubMed] [Google Scholar]
- Hightower JM, O'Hare A, Hernandez GT. Blood mercury reporting in NHANES: identifying Asian, Pacific Islander, Native American, and multiracial groups. Environ Health Perspect. 2006;114 (2):173–175. doi: 10.1289/ehp.8464. [DOI] [PMC free article] [PubMed] [Google Scholar]
- Hirayama K, Yasutake A. Sex and age differences in mercury distribution and excretion in methylmercury-administered mice. J Toxicol Environ Health. 1986;18 (1):49–60. doi: 10.1080/15287398609530847. [DOI] [PubMed] [Google Scholar]
- Houston TK, Person SD, Pletcher MJ, Liu K, Iribarren C, Kiefe CI. Active and passive smoking and development of glucose intolerance among young adults in a prospective cohort: CARDIA study. BMJ. 2006;332 (7549):1064–1069. doi: 10.1136/bmj.38779.584028.55. [DOI] [PMC free article] [PubMed] [Google Scholar]
- Leino T, Lodenius M. Human hair mercury levels in Tucurui area, State of Para, Brazil. Sci Total Environ. 1995;175 (2):119–125. doi: 10.1016/0048-9697(95)04908-j. [DOI] [PubMed] [Google Scholar]
- Mahaffey KR, Clickner RP, Bodurow CC. Blood organic mercury and dietary mercury intake: National Health and Nutrition Examination Survey, 1999 and 2000. Environ Health Perspect. 2004;112 (5):562–570. doi: 10.1289/ehp.6587. [DOI] [PMC free article] [PubMed] [Google Scholar]
- McDonald A, Van Horn L, Slattery M, Hilner J, Bragg C, Caan B, Jacobs D, Jr, Liu K, Hubert H, Gernhofer N, et al. The CARDIA dietary history: development, implementation, and evaluation. J Am Diet Assoc. 1991;91 (9):1104–1112. [PubMed] [Google Scholar]
- Morris JS, Stampfer MJ, Willett WC. Dietary selenium in humans: Toenails as an indicator. Biol Trace Elem Res. 1983;5:529–537. doi: 10.1007/BF02988944. [DOI] [PubMed] [Google Scholar]
- Mortada WI, Sobh MA, El-Defrawy MM. The exposure to cadmium, lead and mercury from smoking and its impact on renal integrity. Med Sci Monit. 2004;10(3):CR112–116. [PubMed] [Google Scholar]
- Mozaffarian D, Shi P, Morris JS, Spiegelman D, Grandjean P, Siscovick DS, Willett WC, Rimm EB. Mercury exposure and risk of cardiovascular disease in two U.S. cohorts. N Engl J Med. 2011;364 (12):1116–1125. doi: 10.1056/NEJMoa1006876. [DOI] [PMC free article] [PubMed] [Google Scholar]
- Ohno T, Sakamoto M, Kurosawa T, Dakeishi M, Iwata T, Murata K. Total mercury levels in hair, toenail, and urine among women free from occupational exposure and their relations to renal tubular function. Environ Res. 2007;103 (2):191–197. doi: 10.1016/j.envres.2006.06.009. [DOI] [PubMed] [Google Scholar]
- Oken E, Radesky JS, Wright RO, Bellinger DC, Amarasiriwardena CJ, Kleinman KP, Hu H, Gillman MW. Maternal fish intake during pregnancy, blood mercury levels, and child cognition at age 3 years in a US cohort. Am J Epidemiol. 2008;167 (10):1171–1181. doi: 10.1093/aje/kwn034. [DOI] [PMC free article] [PubMed] [Google Scholar]
- Rees JR, Sturup S, Chen C, Folt C, Karagas MR. Toenail mercury and dietary fish consumption. J Expo Sci Environ Epidemiol. 2007;17 (1):25–30. doi: 10.1038/sj.jes.7500516. [DOI] [PubMed] [Google Scholar]
- Schober SE, Sinks TH, Jones RL, Bolger PM, McDowell M, Osterloh J, Garrett ES, Canady RA, Dillon CF, Sun Y, Joseph CB, Mahaffey KR. Blood mercury levels in US children and women of childbearing age, 1999–2000. JAMA. 2003;289 (13):1667–1674. doi: 10.1001/jama.289.13.1667. [DOI] [PubMed] [Google Scholar]
- Shacklette HT, Boerngen JG. US Dept of the Interior For sale by the Distribution Branch. U. S.Geological Survey; Alexandria, VA: 1984. Element concentrations in soils and other surficial materials of the conterminous United States. [Google Scholar]
- Smith JC, Allen PV, Von Burg R. Hair methylmercury levels in U.S. women. Arch Environ Health. 1997;52 (6):476–480. doi: 10.1080/00039899709602227. [DOI] [PubMed] [Google Scholar]
- Son JY, Lee J, Paek D, Lee JT. Blood levels of lead, cadmium, and mercury in the Korean population: results from the Second Korean National Human Exposure and Bio-monitoring Examination. Environ Res. 2009;109 (6):738–744. doi: 10.1016/j.envres.2009.03.012. [DOI] [PubMed] [Google Scholar]
- StataCorp LP. Getting started with Stata for Windows, release 11. StataCorp LP: College Station, Tex; 2009. [Google Scholar]
- US-EPA. Mercury study report to Congress. An assessment of exposure to mercury in the United States 1997;IV [Google Scholar]
- Weil M, Bressler J, Parsons P, Bolla K, Glass T, Schwartz B. Blood mercury levels and neurobehavioral function. JAMA. 2005;293 (15):1875–1882. doi: 10.1001/jama.293.15.1875. [DOI] [PubMed] [Google Scholar]
- Willett WC. Nutritional Epidemiology. 2. Oxford University Press; New York, NY: 1998. [Google Scholar]
- Xun P, Hou N, Daviglus M, Liu K, Morris JS, Shikany JM, Sidney S, Jacobs DR, He K. Fish oil, selenium and mercury in relation to incidence of hypertension: a 20-year follow-up study. J Intern Med. 2011;270 (2):175–186. doi: 10.1111/j.1365-2796.2010.02338.x. [DOI] [PMC free article] [PubMed] [Google Scholar]
- Xun P, Liu K, Morris JS, Daviglus ML, Stevens J, Jacobs DR, Jr, He K. Associations of toenail selenium levels with inflammatory biomarkers of fibrinogen, high-sensitivity c-reactive protein, and interleukin-6: The CARDIA Trace Element Study. Am J Epidemiol. 2010;171 (7):793–800. doi: 10.1093/aje/kwq001. [DOI] [PMC free article] [PubMed] [Google Scholar]
- Yoshizawa K, Rimm EB, Morris JS, Spate VL, Hsieh CC, Spiegelman D, Stampfer MJ, Willett WC. Mercury and the risk of coronary heart disease in men. N Engl J Med. 2002;347 (22):1755–1760. doi: 10.1056/NEJMoa021437. [DOI] [PubMed] [Google Scholar]