

Abstract
Purpose
Triglyceride signal contained in peaks near the water peak remain unsuppressed by conventional fat suppression techniques used in diffusion-weighted imaging (DWI). In this work we investigated the dependence of the apparent diffusion coefficient (ADC) on liver fat content and whether it is confounded by fat signal.
Methods
43 patients underwent liver DWI (b=0,500s/mm2) and single-voxel MR-spectroscopy (MRS). Proton density fat-fraction (PDFF;range 0.23–34.5%) was measured from MRS. A theoretical model was developed to account for the effects of fat on observed ADC, and used to correct the ADC. Linear correlation analysis was performed to assess the relationship between PDFF and ADC before and after correction.
Results
Linear correlation analysis showed an inverse dependence between observed ADC and PDFF before correction (r2=0.132;p=0.017), and no dependence after correction (r2=0.033;p=0.24).
Conclusion
The observed decrease in ADC in patients with fatty liver is, at least in part, artifactual due to residual fat signal near the water peak.
Keywords: fatty liver, proton density fat-fraction, diffusion weighted imaging, apparent diffusion coefficient
INTRODUCTION
Diffusion weighted imaging (DWI) of the liver is well established for hepatic lesion detection and characterization [1–4] and has been proposed as a biomarker to monitor treatment response in patients with cancer [5, 6]. DWI has also been applied for the evaluation of diffuse liver disease, and the apparent diffusion coefficient (ADC) has shown acceptable sensitivity and specificity with regards to predicting liver fibrosis and inflammatory changes [7, 8].
Non-alcoholic fatty liver disease (NAFLD) is the most common form of diffuse liver disease in Western countries [9]. It is increasingly prevalent and is estimated to afflict an estimated 30 million Americans [9], including up to 10% of all children [10]. Many patients with NAFLD progress to a more aggressive subset of NAFLD, known as non-alcoholic steatohepatitis (NASH), which is characterized by histological features that include inflammation, ballooning degeneration of hepatocytes and fibrosis [11]. For this reason it is of great interest to develop biomarkers of fibrosis and inflammation in patients that also have hepatic steatosis.
Recently developed MR-based methods for accurate non-invasive in-vivo quantification of proton density fat-fraction (PDFF) as a biomarker of liver fat have been descibed [12–16]. However, only limited data are available with regard to DWI in patients with fatty liver disease. Prior studies investigating the dependence of ADC on liver fat have lead to contradicting results from different groups [17, 18]. For example, Poyraz et al. compared the ADC in patients with fatty liver disease to a normal control group and found a significant decrease in the observed ADC in patients with fatty liver disease [18], while a study by d`Assignies et al. [17] found no significant change in ADC between the two similar groups.
DWI of the liver is typically performed using an echo planar imaging (EPI) readout. Echo-planar imaging requires the use of fat suppression or water-only excitation to avoid severe chemical shift related ghost artifacts. This is typically achieved using spatial-spectral (also known as water excitation) pulses [19]. Water excitation pulses have a spectral bandwidth centered on the water peak (located at 4.7ppm), and will excite all protons whose resonance peaks lie within the excitation bandwidth. In the presence of liver fat, these excitation pulses avoid exciting the signal in main methylene and methyl peaks of fat, located at 1.3 and 0.9 ppm, respectively. Unfortunately, the NMR specrum of triglycerides, unlike water, is complex, with at least 6 distinct frequencies observable at clinical field strengths [20]. In the liver, several of these peaks (between 4.2 and 5.3 ppm) are close to the water peak and collectively contain approximately 8.7% of the total fat signal [20]. For this reason, water excitation pulses, even in the absence of Bo inhomogeneities will excite ~8.7% of the trigylceride proton magnetization in tissue. As we show below, the presence of this inadvertently excited fat signal will confound observed ADC measurements when fat is present in the liver.
Therefore, the purpose of our study was to investigate the effect of fat on the observed ADC in patients with fatty liver disease by establishing the relationship of the observed ADC and fat content in the liver.
METHODS
Theoretical Analysis and Data Simulation
The diffusion-weighted signal in the presence of water and imperfectly suppressed or partially excited fat can be modeled as:
| [1] |
where A is the local proton density, η is the proton density fat-fraction [21], α is the fraction of residual fat signal that is unsuppressed or has been excited, TE is the echo time, T2W and T2F are the T2 relaxation times of the water and fat, respectively, and ADCW and ADCF are the true apparent diffusion coefficients of water and fat, respectively. For simplicity, we assume a common T2F for all fat peaks. We will also approximate the ADC of fat (ADCF) to be zero, as fat molecules exhibit significantly lower diffusion than water molecules [22].
The fraction of residual fat signal, α, can be approximated by considering an established spectral model of triglycerides liver fat [20]. Specifically, the fat signal contains multiple spectral peaks, including several peaks very close to the 4.7 ppm water peak (between 4.2 ppm and 5.3 ppm, due to glycerol and olefinic protons). These peaks will contribute to the overall signal using conventional fat suppression techniques (fat-saturation or spectral-spatial pulses). In addition, the signal from these peaks will experience very little attenuation from diffusion-weighting, relative to water, due to the slow diffusion of fat, and therefore may impact the observed ADC more than would otherwise be expected. Even with a well designed water excitation pulse or fat suppression pulse, the fat peaks between 4.2ppm and 5.3ppm contribute approximately 8.7% of the total available fat magnetization [20, 23]. In addition, the spatial shift in the phase encoding direction that occurs with echo planar imaging due to off-resonance has been ignored, because the frequencies of the glycerol and olefinic resonance peaks are very close to water.
The signal model in Eq. 1 allows quantitative characterization of the effects of fat on the observed ADC. The relationship between liver fat signal and the observed ADC was simulated using a custom script written in MATLAB (Mathworks, Natick, MA). The b-values used in our study (0, 500 s2/mm) as well as the b-values reported in prior studies by d´Assignies et al (0, 1000 s2/mm) [17] and Poyraz et al. (50, 100, 200, 300, 400 s2/mm) [18] were investigated. Simulations assumed a true ADCW=1500 mm2/s, ADCF=0 mm2/s, with PDFF ranging from 0% to 50%. The T2 relaxation times for water and fat were set to T2W=23 ms and T2F=62 ms, based on the measurements from a recent study by Hamilton et al. [20]. Note that the T2F for glycerol and olefinic fat peaks in this work was assumed to be equal to the T2 relaxation time of the main methylene peak [20], due to the difficulty of reliably measuring the T2 decays of the smaller fat peaks in vivo.
In our simulations, DWI signal was generated using Eq. 1 with the parameters described above, and ADC was estimated using the conventional model for diffusion weighted signal that ignores the presence of fat, ie:
| [2] |
where A’ includes the effects of T2 decay. In this way, the expected relationship between fat-fraction and observed ADC was derived for each b-value combination. Note that the effect of perfusion at low b-values was not investigated in this work, as it is a separate confounder that has been described elsewhere [1].
Phantom construction
A modified fat-water phantom was constructed based on the methods described elsewhere [24–26]. Briefly, the phantom consisted of 5 vials with water/fat mixtures with fat fractions ranging from 0–100%. Four vials (fat fractions: 0, 20, 30, 50%) were constructed by forming an agar gel with an emulsion of water and peanut oil mixed in the appropriate volumes. A fifth vial containing pure peanut oil was also included.
Phantom experiments
The vials of the phantom were positioned near the isocenter of a 1.5 T scanner (Signa HDxt, 16.0; GE Healthcare, Waukesha, WI). An eight channel phased-array torso coil was used. Imaging parameters included: TE 81ms, TR 1800ms; FOV 280×224mm2; 200×200 matrix; 16 signal averages; 1 slice; 10mm slice thickness; diffusion direction: three orthogonal directions; b-values: 0, 50, 100, 200, 300, 400, 500, 600, 700, 800, 900, 1000. From the acquired data ADC maps were calculated using different combinations of b-values (b=0,600; b=0,700; b=0,800; b=0,900) in addition to including the b-values used in our in-vivo study (b = 0, 500) and previously published data (b= 0, 1000 [18], and b= 50, 100, 200, 300, 400 [17]). Figure 2 depicts the corresponding DWI scan of the fat-water phantom.
Figure 2.

Choice of b-values impacts predicted apparent ADC when fat is present in tissues, and differences increase with increasing proton density fat-fraction. The b-values used in this simulation correspond to those reported in reference 17 and 18 and also for the b-values used in the clinical study in this work.
Patients and MR Imaging Technique
This institutional review board approved, HIPAA compliant study included 50 patients that underwent abdominal MR imaging for a variety of reasons not limited to fatty liver disease (cancer staging, lesion characterization etc.) between 03/2008 and 10/2009. 7 patients were excluded due to severe motion artifacts in the acquired DWI sequence. Thus, 43 patients were included (24 male, 19 female; median age 50 years, range 23 – 75 years). The patient population included in this study has been evaluated in prior studies with regard to the hepatic PDFF [12, 27], however the relationship of the ADC and the PDFF has not been previously investigated in these subjects.
PDFF below 5.56% was deemed as the threshold to distinguish normal from abnormal based on the 95th percentile cutoff established in the MRS study performed as part of the Dallas Heart Study [9]. Based on this threshold, patients were assigned to the control group defined as less than 5.56% PDFF and the fatty liver group defined as greater than 5.56% PDFF.
All MR examinations were performed on two clinical 1.5T scanners (Signa HDx 15.0; TwinSpeed and Echospeed gradients, GE Healthcare, Waukesha, WI) using an eight channel phased-array torso coil. In all patients, a single voxel T2 corrected single voxel STEAM MRS and a single shot spin echo Echo Planar Imaging DWI sequence were obtained.
Magnetic Resonance Spectroscopy
PDFF measurements were obtained using a single voxel Stimulated Echo Acquisition Mode (STEAM) acquisition without water suppression. A 2.5 × 2.5 × 2.5 cm3 voxel was placed in the right hepatic lobe (Segments VI or VII) with care to avoid bile ducts, large vessels and other abnormalities. Five single-average spectra with progressively longer echo times of 10, 20, 30, 40 and 50 msec were acquired in order to provide T2-correction. Total acquisition time for MRS was 21 seconds performed during a single breath-hold. Known confounding factors such as T1 weighting was minimized by choosing a long repetition time of 3500 msec. The confounding effect of J-coupling was minimized by choosing a minimum mixing time of 5 msec. Receiver bandwidth was ± 2.5 kHz with 2048 readout points. MRS data were postprocessed using a dedicated software software package (jMRUI) [28] and the AMARES spectral fitting algorithm previously described by Vanhamme et al [29]. In order to provide a T2 corrected MR spectroscopy fat fraction, T2 decay correction was performed for both water and fat peaks. PDFF was reported in percent.
Diffusion Weighted Imaging
DWI was performed using a single shot spin-echo echo planar (EPI) sequence using b-values of 0 and 500 performed during a single breath-hold. Spatial-spectral excitation pulses were used to achieve fat suppression. Typical DWI parameters included: : TE 67.4 – 83ms (TE range across all examinations, TE was kept constant for each individual scan), TR 1800, matrix 192×160 , 4 signal averages, 400mm field of view, 8mm slice thickness (2mm interslice gap), diffusion direction: all gradients on simultaneously. Phase encoding direction was L/R or A/P according to the clinical protocol, with an effective echo spacing of 868us. A parallel imaging factor of 2 in the phase encoding direction was used using an externally calibrated product image based parallel imaging method (ASSET). The apparent diffusion coefficient was automatically calculated using the standard scanner based ADC calculation software.
Image analyis
ADC maps were loaded into a standard DICOM viewer (OsiriX 3.9.4, The OsiriX Foundation, Geneva, Switzerland). Voxel coordinates from MRS were used to colocalize a region of interest (ROI) in the corresponding location in the right hepatic lobe. The size of the ROI was adapted to the MRS voxel (2.5 × 2.5 × 2.5 cm3). Very small operator defined adjustments were performed to compensate for mild distortion in the phase encoding direction that can occur with DWI, and to avoid image artifacts and large vessels and bile ducts. In addition, ADC measurements were measured in three consecutive slices and the values were averaged to improve the colocalization of the ADC measurements with MRS.
Correcting ADC for fat
Based on the relationship between fat-fraction and observed ADC derived with the simulations described above, fat-corrected ADC measurements can be derived from fat-uncorrected (standard) liver ADC measurements, if the liver fat content is known. Each fat-uncorrected ADC measurement was corrected by estimating the true ADC value that would give rise to the observed uncorrected ADC according to Equation 1, given the PDFF and water/fat T2 relaxation times. This was done for each subject using their specific TE and b-values, as well as their measured PDFF. Average water and fat T2 relaxation times were used for all the subjects [20]. Specifically, given each subject’s measured PDFF, signals were simulated using Eq. 1 with a range of finely-spaced true ADC values (spacing = 2 mm2/s, range: up to 400 mm2/s above the measured uncorrected ADC) to construct a look-up table. The signals were subsequently fitted using Eq. 2, to obtain a theoretical uncorrected ADC for each true ADC. Finally, the true ADC that gives rise to the theoretical uncorrected ADC closest to the measured uncorrected ADC was picked as fat-corrected ADC for the current subject.
Statistical analyis
All values are reported as mean ± standard deviation, with a p-value of less than 0.05 considered statistically significant. ADC measurements were analyzed before and after correction for fat. Normal distribution for the three PDFF groups was determined using the Shapiro-Wilk test. Differences in mean age and sex for the three groups and differences in ADC between the control group and the two fatty liver groups were assessed using a Welch test (two sample Student´s t-test that relaxes the assumption of equal variances). The relationship between the observed ADC and PDFF was determined using a linear regression analysis and the Pearson correlation coefficient (r2). Statistical analysis was performed using XLSTAT Version 2012.1.01 (Addinsoft, New York, NY, USA) and Excel for Mac (14.1.2; Microsoft, Redmond, WA).
Results
Impact of b-values on the observed ADC in the presence of fat
Figure 2 shows DWI simulation results using different b-value combinations and the corresponding observed ADC with increasing PDFF. The simulation is based on Eq. 1. While there is a neligible error in ADC for low fat (PDFF<5.56%), the errors are severe at higher fat fractions. Further, these errors are heavily dependent on the choice of b-value combination leading to poor robustness in ADC mapping in the presence of fat. Differences in observed ADC may be as large as 0.2 × 10⁻³ mm2/s (ADC 1.0 × 10⁻³mm2/s vs. 1.2 × 10⁻³mm2/s) at a PDFF of 20% (between b-values 50,100,200,300,400 and b-values of 0,1000 respectively).
Phantom scan
Figure 3 shows diffusion weighted images acquired in the water-fat phantom, explicitly demonstrating the inadvertently excited fat signal, even with water excitation pulses, in the 100% oil vial. Table 1 illustrates the impact of different b-values on observed ADC obtained from the fat-water phantom previously described. While the difference in observed ADC is not as pronounced as in the simulation, higher b-values lead to lower observed ADC.
Figure 3.

Water excitation pulses results in excitation of fat signal originating from glycerol and olefinic peaks, using standard DWI sequences. Note the residual signal from the 100% fat –only vial (right). Top: Fat-water phantom vials in ascending order of fat fraction from left to right. Bottom: corresponding ADC-map
Table 1.
Impact of different b-values on observed Apparent Diffusion Coefficient in a fat-water phantom
| b-values | ADC at 0% PDFF | ADC at 20% PDFF | ADC at 30% PDFF | ADC at 50% PDFF | ADC at 100% PDFF |
|---|---|---|---|---|---|
| 50, 100, 200,300, 400 [17] | 2.05 | 1.87 | 1.79 | 1.18 | 0.06 |
| 0, 500 | 1.99 | 1.84 | 1.75 | 1.17 | 0.09 |
| 0, 600 | 1.99 | 1.83 | 1.74 | 1.15 | 0.09 |
| 0, 700 | 2.00 | 1.82 | 1.73 | 1.13 | 0.08 |
| 0, 800 | 2.00 | 1.81 | 1.71 | 1.10 | 0.09 |
| 0, 900 | 2.00 | 1.79 | 1.70 | 1.09 | 0.08 |
| 0, 1000 [18] | 2.01 | 1.79 | 1.69 | 1.05 | 0.09 |
Note: ADC × 10−3 mm2/s, PDFF = Proton Density Fat Fraction
Apparent Diffusion Coefficient and Proton Density Fat-Fraction
27 patients were included in the control group and 16 patients in the fatty liver group. There was no significant difference with regard to age or sex between groups (all p > 0.05). Mean PDFF was 2.0 ± 1.2% for the control group and 13.5 ± 7.6% for the fatty liver group (p<0.0001).
Figure 4 shows a representative spectrum from a subject with fatty liver, as well as an ADC map including co-localization of the regions of interest (ROI). Figure 5 plots the observed and the corrected ADC measurement results with increasing PDFF for all subjects. Before correction for fat, the mean ADC was lower for the fatty liver group (1.32 ± 0.3 × 10⁻³mm2/s) compared to the control group (1.49 ± 0.25 × 10⁻³mm2/s) (p=0.09). Although the ADC of the fatty liver group was lower, the difference was not significant (p=0.09). After correction the difference in mean ADC was not as pronounced for the fatty liver group (1.42 ± 0.31 × 10⁻³mm2/s) and the control group (1.50 ± 0.3 × 10⁻³mm2/s), with no statistical difference (p=0.51). This is summarized in Table 2.
Figure 4.
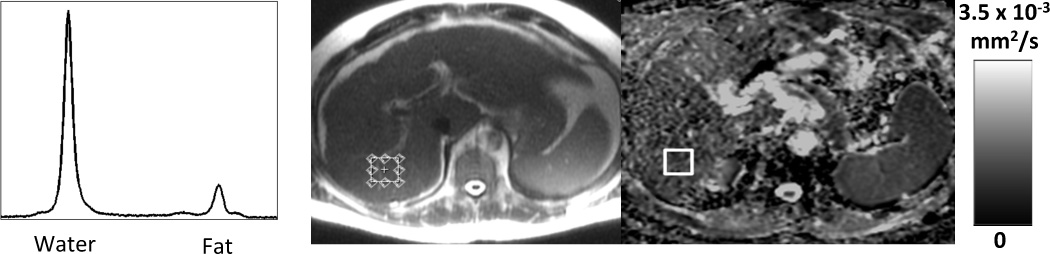
Co-localization of ROI corresponding to the voxel used for MR-Spectroscopy. Left: Liver MR spectrum with water and fat peak. Center: Localizer shows placement of the MR-Spectroscopy voxel in the right lobe of the liver. Right: Corresponding co-localized ROI on ADC-Map
Figure 5.

Uncorrected ADC shows a signifcant decrease in the observed ADC with increasing PDFF, with a statistically significant correlation (r2=0.13; intercept = 1.51 × 10⁻³mm2/s (95% confidence interval = 1.40 –1.62 × 10⁻³mm2/s), slope = –0.014 × 10⁻³mm2/s/PDFF%, (95% confidence interval = −0.025 – −0.003), and p=0.017) After correction for the effects of fat, however, there is no dependence of observed ADC on PDFF (r2 =0.13; intercept = 1.54 × 10⁻³mm2/s (95% confidence interval = 1.40 – 1.62 × 10⁻³mm2/s), slope = −0.007 × 10⁻³mm2/s/PDFF% (95% confidence interval = −0.019 – 0.005), and p=0.24). Linear regression for the two data sets are shown as dashed lines. These results demonstrate that the observed decrease in ADC with increasing PDFF can be explained by the residual effect of the signal from fat resonance peaks near water. ADC measurements were co-localized with MR-Spectroscopy in 43 subjects with a wide range of liver fat. The plot shows ADC plotted against PDFF for all 43 subjects included in this study. Please note that an additional recalculation (not shown) was performed excluding the subject with the highest PDFF - this confirmed repeatable results (ie: the results were not driven by the PDFF outlier).
Table 2.
Mean PDFF and ADC before and after correction for fat
| Mean PDFF (%) ± SD | Mean uncorrected ADC (×10−3 mm2/s) ± SD |
Mean corrected ADC (×10−3 mm2/s) ± SD |
|
|---|---|---|---|
| Control group (< 5.56% PDFF (n=27)) |
2.0 ± 1.2 | 1.49 ± 0.25 | 1.50 ± 0.25 |
| Fatty liver group (>5.56% PDFF (n=16)) |
13.5 ± 7.6 | 1.32 ± 0.30 | 1.42 ± 0.31 |
| p-value | <0.0001 | 0.09 | 0.51 |
Note: ADC=Apparent Diffusion Coefficient. PDFF=Proton Density Fat-Fraction. SD= Standard Deviation
However, linear regression analysis revealed a statistically significant inverse relationship between the uncorrected observed ADC and the PDFF: r2=0.13; intercept = 1.51 × 10⁻³mm2/s (95% confidence interval = 1.40 –1.62 × 10⁻³mm2/s), slope = −0.014 × 10⁻³mm2/s/PDFF% (95% confidence interval = −0.025 – −0.003), and p=0.017. After correction for the presence of fat there was no dependence of ADC on PDFF: r2 = 0.033; intercept = 1.54 × 10⁻³mm2/s (95% confidence interval = 1.40 – 1.62 × 10⁻³mm2/s), slope = −0.007 × 10⁻³mm2/s/PDFF% (95% confidence interval = −0.019 – 0.005), and p= 0.24. The difference in significance level between the Student t-test (which trended towards significance) and the linear regression analysis in the uncorrected ADC measurements could be explained by the sample size and dependence on the choice of cut-off value for the two groups of subjects.
Discussion
In this work we have demonstrated that the observed ADC in liver decreases with elevated intracellular fat. While previous work has suggested that the presence of fat may decrease the actual ADC of water in tissue by restricting the diffusion of water [18], the results of our study offer a new perspective that has not been previously investigated. Our simulations and phantom experiments clearly demonstrate a decrease in observed ADC that results from signal arising from excited glycerol and olefinic protons of triglycerides, an effect that increases with increasing PDFF through an averaging effect. This leads to an inaccurate signal model for diffusion that does not reflect the underlying physics of the signal from the tissue, and leads to confounded ADC measurements. Therefore, our results support the hypothesis that the decrease in the observed ADC is, at least in part, due the confounding effects of fat. We also proposed and demonstrated the use of a simple, but effective, correction algorithm that removes the dependence of observed ADC on tissue fat concentration.
Prior studies have not evaluated fat as a possible confounding factor and have focused on correlating ADC to liver fat fraction, with contradicting results. A study performed by d´Assignies et al. found no significant difference comparing the ADC of 20 patients with histopathologically proven hepatic steatosis and an average hepatic fat fraction of 18.1% to a normal control group [17]. D´Assignies et al. utilized b-values of 50-100-200-300-400. In contrast, Poyraz et al. [18] reported a decrease in ADC in 42 patients with a mean PDFF of 13.7% compared to a control group, using b-values of 0 and 1000. The ADC reported in normal and fatty liver parenchmya differs between those two prior studies and in turn are different from the ADC we observed. Poyraz et al reported a mean of 1.32 × 10⁻³ mm2/s in normal parenchmya and observed a decrease to 1.17 × 10⁻³ mm2/s in patients with a signal fat fraction of 10–20%, while d´Assignies et al. reported no significant change in ADC between normal parenchyma and parenchyma with an average fat fraction of 18.1% on MRS (1.93 × 10⁻³ mm2/s vs. 1.96 × 10⁻³ mm2/s respectively). The source of discrepancy in ADC at low hepatic fat fractions between the two studies is unclear. In patients with high PDFF, the difference may be partially attributed to unsupressed fat signal in conjunction with different choices of b-values. This assumption is validated by our simulation in conjunction with the phantom data. In a study recently published by Leitao et al. [30], the authors suggest that the presence of hepatic steatosis may have a confounding effect on MRI diffusion parameters. In addition to validating the findings by Leitao et al. using a larger sample size, we are able to present a simple correction factor that diminishes the dependence of the observed ADC on the hepatic fat fraction.
At low PDFF (<5%), fat has minimal effect on the observed ADC for a wide range of b-values. However, as PDFF increases, the dependence of the ADC on the choice of b-values increases, and thus results obtained with different b-values should be interpreted cautiously. This non-standardized approach has been a major shortcoming when trying to compare liver DWI data acquired at different institutions [31]. The dependence of ADC on the choice of b-values also underscores a need for improved robustness to changes in acquisition parameters (eg, b-values) by addressing confounding factors such as the presence of fat.
In addition to the variety of approaches taken when acquiring DWI images, estimating the fat-fraction is also not standardized. Using the studies previously described, Poyraz et al. estimated the fat-fraction from GRE dual echo images, while d`Assignies et al. used an MRS approach. The GRE dual echo method is well-known to be signifcantly confounded by factors such as T1 bias, noise bias and T2* effects in addition to being dependent on the scanner as well as the scan parameters [32, 33]. The PRESS MRS sequence used by d´Assignies et al. may also be affected by J-coupling effects. Our approach, which used a T2-corrected STEAM MRS with short echo times, is relatively insensitive to J-coupling effects, and likely provides a more accurate estimate of the PDFF [12].
While DWI allows for an assessment of cellular microstructure in a variety of tissues, all relevant confounding factors must be addressed to ensure that ADC measurements are robust, ie: insensitive to changes in parameters. From this work, we can conclude that the ADC measured in patients with fatty liver may be confounded by liver fat, a notion that has broad implications for a variety of applications. An estimated 30 million Americans are affected by fatty liver disease [9] and this could possibly confound liver ADC values in a variety of applications including cancer staging and liver lesion characterization. While the ability to detect focal liver lesions will not be impaired by the uncorrected ADC values, the quantitation of such lesions might differ. Also, it is well known that many chemotherapeutic agents can cause steatosis, further complicating the intepretation of ADC measurements in the liver. Thus, great care should be taken when interpreting the ADC in patients with fatty liver to avoid misinterpretation of these values.
Limitations of this work include the broad patient inclusion criteria which could explain the wide range of observed ADC values, even for the same PDFF. Additionally, the fat correction performed in vivo was based on a relatively simple model for the fraction of residual fat signal, and used average T2 relaxation times for the water and fat signal components. It may be more accurate to use the T2 values of water and fat measured for each individual. While prior work suggested that hepatic steatosis does not affect liver MR perfusion and diffusion parameters derived from an IVIM model [34], the perfusion component of DWI at low b-values was not assessed as a possible confounding factor as part of this study. Another aspect that could present a possible confounder is the fat suppression sequence employed by different vendors. However, fat suppression methods used with DWI are generally standardized and typically use spatial-spectral pulses (water excitation). However, the details of the implementation are proprietary and comparisons are beyond the scope of this manuscript. It would be of interest to investigate vendor specific differences regarding fat suppression in future studies. Another possible confounder that was not addressed as part of this study is the bias in the observed ADC that can result from noise. This occurs when fitting magnitude images that have non-zero mean noise when the SNR of the images is low. However, noise measurements are not trivial due to the spatial non-uniformity of the B0-field and the use of parallel imaging. While this issue certainly warrants further investigation, it is beyond the scope of the present work. Furthermore, the b-value dependence of observed ADC in the presence of liver fat was not investigated in patients due to limitations on overall clinical protocol duration. Future work will be necessary to assess the accuracy of the proposed model, and to measure the effects of liver fat on DWI acquisitions with different b-values.
In conclusion, we have demonstrated that the observed decrease in ADC in fatty liver disease results, at least in part, from the confounding effects of fat. Correction for this confounding factor removes the apparent dependence of the observed ADC on hepatic fat-fraction. DWI in fatty liver disease should therefore be used cautiously, and care must be taken to avoid misinterpretation of observed ADC values in the presence of hepatic steatosis. Further research investigating fat as a confounding factor for accurate ADC measurements is warranted, and methods to mitigate or correct for the effects of fat are needed.
Figure 1.

Schematic of water and fat proton spectra demonstrating excitation of glycerol and olefinic protons fat peaks using spatial-pulses (arrows in bottom picture). After diffusion-weighting, the water signal is attenuated and the relative signal of the two fat peaks may become significant and introduce large errors in ADC measurement (note the differences in scale in the y-axis).
Acknowledgements
The authors wish to acknowledge Alejandro Muñoz del Rio, PhD, for his assistance and support with the statistical analysis, Nathan S. Artz, PhD, for constructing the fat-water phantoms, and Gavin Hamilton, PhD, for his assistance and for providing the MR spectroscopy sequence used in this study. We also wish to acknowledge support from the NIH (R01 DK083380, R01 DK088925, and RC1 EB010384), the WARF Accelerator Grant program, and GE Healthcare for research support to the University of Wisconsin.
References
- 1.Taouli B, Koh DM. Diffusion-weighted MR imaging of the liver. Radiology. 2010;254(1):47–66. doi: 10.1148/radiol.09090021. [DOI] [PubMed] [Google Scholar]
- 2.Koh DM, Collins DJ, Wallace T, Chau I, Riddell AM. Combining diffusion-weighted MRI with Gd-EOB-DTPA-enhanced MRI improves the detection of colorectal liver metastases. Br J Radiol. 2011;85(1015):980–989. doi: 10.1259/bjr/91771639. [DOI] [PMC free article] [PubMed] [Google Scholar]
- 3.Scurr ED, Collins DJ, Temple L, Karanjia N, Leach MO, Koh DM. Appearances of colorectal hepatic metastases at diffusion-weighted MRI compared with histopathology: initial observations. Br J Radiol. 2012;85(1011):225–230. doi: 10.1259/bjr/11597735. [DOI] [PMC free article] [PubMed] [Google Scholar]
- 4.Chandarana H, Taouli B. Diffusion-weighted MRI and liver metastases. Magn Reson Imaging Clin N Am. 2010;18(3):451–464. doi: 10.1016/j.mric.2010.07.001. x. [DOI] [PubMed] [Google Scholar]
- 5.Padhani AR, Liu G, Koh DM, Chenevert TL, Thoeny HC, Takahara T, Dzik-Jurasz A, Ross BD, Van Cauteren M, Collins D, et al. Diffusion-weighted magnetic resonance imaging as a cancer biomarker: consensus and recommendations. Neoplasia. 2009;11(2):102–125. doi: 10.1593/neo.81328. [DOI] [PMC free article] [PubMed] [Google Scholar]
- 6.Padhani AR, Koh DM. Diffusion MR imaging for monitoring of treatment response. Magn Reson Imaging Clin N Am. 2011;19(1):181–209. doi: 10.1016/j.mric.2010.10.004. [DOI] [PubMed] [Google Scholar]
- 7.Taouli B, Chouli M, Martin AJ, Qayyum A, Coakley FV, Vilgrain V. Chronic hepatitis: role of diffusion-weighted imaging and diffusion tensor imaging for the diagnosis of liver fibrosis and inflammation. J Magn Reson Imaging. 2008;28(1):89–95. doi: 10.1002/jmri.21227. [DOI] [PubMed] [Google Scholar]
- 8.Annet L, Peeters F, Abarca-Quinones J, Leclercq I, Moulin P, Van Beers BE. Assessment of diffusion-weighted MR imaging in liver fibrosis. J Magn Reson Imaging. 2007;25(1):122–128. doi: 10.1002/jmri.20771. [DOI] [PubMed] [Google Scholar]
- 9.Szczepaniak LS, Nurenberg P, Leonard D, Browning JD, Reingold JS, Grundy S, Hobbs HH, Dobbins RL. Magnetic resonance spectroscopy to measure hepatic triglyceride content: prevalence of hepatic steatosis in the general population. Am J Physiol Endocrinol Metab. 2005;288(2):E462–E468. doi: 10.1152/ajpendo.00064.2004. [DOI] [PubMed] [Google Scholar]
- 10.Schwimmer JB, Deutsch R, Kahen T, Lavine JE, Stanley C, Behling C. Prevalence of fatty liver in children and adolescents. Pediatrics. 2006;118(4):1388–1393. doi: 10.1542/peds.2006-1212. [DOI] [PubMed] [Google Scholar]
- 11.Matteoni CA, Younossi ZM, Gramlich T, Boparai N, Liu YC, McCullough AJ. Nonalcoholic fatty liver disease: a spectrum of clinical and pathological severity. Gastroenterology. 1999;116(6):1413–1419. doi: 10.1016/s0016-5085(99)70506-8. [DOI] [PubMed] [Google Scholar]
- 12.Meisamy S, Hines CD, Hamilton G, Sirlin CB, McKenzie CA, Yu H, Brittain JH, Reeder SB. Quantification of hepatic steatosis with T1-independent, T2-corrected MR imaging with spectral modeling of fat: blinded comparison with MR spectroscopy. Radiology. 2011;258(3):767–775. doi: 10.1148/radiol.10100708. [DOI] [PMC free article] [PubMed] [Google Scholar]
- 13.Reeder SB, Cruite I, Hamilton G, Sirlin CB. Quantitative Assessment of Liver Fat with Magnetic Resonance Imaging and Spectroscopy. J Magn Reson Imaging. 2011;34(4) doi: 10.1002/jmri.22580. spcone. [DOI] [PMC free article] [PubMed] [Google Scholar]
- 14.Bydder M, Yokoo T, Hamilton G, Middleton MS, Chavez AD, Schwimmer JB, Lavine JE, Sirlin CB. Relaxation effects in the quantification of fat using gradient echo imaging. Magn Reson Imaging. 2008;26(3):347–359. doi: 10.1016/j.mri.2007.08.012. [DOI] [PMC free article] [PubMed] [Google Scholar]
- 15.Yokoo T, Bydder M, Hamilton G, Middleton MS, Gamst AC, Wolfson T, Hassanein T, Patton HM, Lavine JE, Schwimmer JB, et al. Nonalcoholic fatty liver disease: diagnostic and fat-grading accuracy of low-flip-angle multiecho gradient-recalled-echo MR imaging at 1.5 T. Radiology. 2009;251(1):67–76. doi: 10.1148/radiol.2511080666. [DOI] [PMC free article] [PubMed] [Google Scholar]
- 16.Yokoo T, Shiehmorteza M, Hamilton G, Wolfson T, Schroeder ME, Middleton MS, Bydder M, Gamst AC, Kono Y, Kuo A, et al. Estimation of hepatic proton-density fat fraction by using MR imaging at 3.0 T. Radiology. 2011;258(3):749–759. doi: 10.1148/radiol.10100659. [DOI] [PMC free article] [PubMed] [Google Scholar]
- 17.d'Assignies G, Ruel M, Khiat A, Lepanto L, Chagnon M, Kauffmann C, Tang A, Gaboury L, Boulanger Y. Noninvasive quantitation of human liver steatosis using magnetic resonance and bioassay methods. Eur Radiol. 2009;19(8):2033–2040. doi: 10.1007/s00330-009-1351-4. [DOI] [PubMed] [Google Scholar]
- 18.Poyraz AK, Onur MR, Kocakoc E, Ogur E. Diffusion-weighted MRI of fatty liver. J Magn Reson Imaging. 2011;35(5):1108–1111. doi: 10.1002/jmri.23519. [DOI] [PubMed] [Google Scholar]
- 19.Meyer CH, Pauly JM, Macovski A, Nishimura DG. Simultaneous spatial and spectral selective excitation. Magn Reson Med. 1990;15(2):287–304. doi: 10.1002/mrm.1910150211. [DOI] [PubMed] [Google Scholar]
- 20.Hamilton G, Yokoo T, Bydder M, Cruite I, Schroeder ME, Sirlin CB, Middleton MS. In vivo characterization of the liver fat (1)H MR spectrum. NMR Biomed. 2011;24(7):784–790. doi: 10.1002/nbm.1622. [DOI] [PMC free article] [PubMed] [Google Scholar]
- 21.Sirlin CB, Reeder SB. Magnetic resonance imaging quantification of liver iron. Magn Reson Imaging Clin N Am. 2010;18(3):359–381. doi: 10.1016/j.mric.2010.08.014. ix. [DOI] [PMC free article] [PubMed] [Google Scholar]
- 22.Steidle G, Eibofner F, Schick F. Quantitative diffusion imaging of adipose tissue in the human lower leg at 1.5 T. Magn Reson Med. 2011;65(4):1118–1124. doi: 10.1002/mrm.22699. [DOI] [PubMed] [Google Scholar]
- 23.Yu H, Shimakawa A, McKenzie CA, Brodsky E, Brittain JH, Reeder SB. Multiecho water-fat separation and simultaneous R2* estimation with multifrequency fat spectrum modeling. Magn Reson Med. 2008;60(5):1122–1134. doi: 10.1002/mrm.21737. [DOI] [PMC free article] [PubMed] [Google Scholar]
- 24.Hernando D, Liang ZP, Kellman P. Chemical shift-based water/fat separation: a comparison of signal models. Magn Reson Med. 2010;64(3):811–822. doi: 10.1002/mrm.22455. [DOI] [PMC free article] [PubMed] [Google Scholar]
- 25.Bernard CP, Liney GP, Manton DJ, Turnbull LW, Langton CM. Comparison of fat quantification methods: a phantom study at 3.0T. J Magn Reson Imaging. 2008;27(1):192–197. doi: 10.1002/jmri.21201. [DOI] [PubMed] [Google Scholar]
- 26.Hines CD, Yu H, Shimakawa A, McKenzie CA, Brittain JH, Reeder SB. T1 independent, T2* corrected MRI with accurate spectral modeling for quantification of fat: validation in a fat-water-SPIO phantom. J Magn Reson Imaging. 2009;30(5):1215–1222. doi: 10.1002/jmri.21957. [DOI] [PMC free article] [PubMed] [Google Scholar]
- 27.Hines CD, Frydrychowicz A, Hamilton G, Tudorascu DL, Vigen KK, Yu H, McKenzie CA, Sirlin CB, Brittain JH, Reeder SB. T(1) independent, T(2) (*) corrected chemical shift based fat-water separation with multi-peak fat spectral modeling is an accurate and precise measure of hepatic steatosis. J Magn Reson Imaging. 2011;33(4):873–881. doi: 10.1002/jmri.22514. [DOI] [PMC free article] [PubMed] [Google Scholar]
- 28.Naressi A, Couturier C, Devos JM, Janssen M, Mangeat C, de Beer R, Graveron-Demilly D. Java-based graphical user interface for the MRUI quantitation package. Magma. 2001;12(2–3):141–152. doi: 10.1007/BF02668096. [DOI] [PubMed] [Google Scholar]
- 29.Vanhamme L, van den Boogaart A, Van Huffel S. Improved method for accurate and efficient quantification of MRS data with use of prior knowledge. J Magn Reson. 1997;129(1):35–43. doi: 10.1006/jmre.1997.1244. [DOI] [PubMed] [Google Scholar]
- 30.Leitao HS, Doblas S, d'Assignies G, Garteiser P, Daire JL, Paradis V, Geraldes CF, Vilgrain V, Van Beers BE. Fat deposition decreases diffusion parameters at MRI: a study in phantoms and patients with liver steatosis. Eur Radiol. 2012 Sep 1; doi: 10.1007/s00330-012-2626-8. [Epub ahead of print]. [DOI] [PubMed] [Google Scholar]
- 31.Taouli B. Diffusion-weighted MR imaging for liver lesion characterization: a critical look. Radiology. 2012;262(2):378–380. doi: 10.1148/radiol.11112417. [DOI] [PubMed] [Google Scholar]
- 32.Liu CY, McKenzie CA, Yu H, Brittain JH, Reeder SB. Fat quantification with IDEAL gradient echo imaging: correction of bias from T(1) and noise. Magn Reson Med. 2007;58(2):354–364. doi: 10.1002/mrm.21301. [DOI] [PubMed] [Google Scholar]
- 33.Reeder SB, Robson PM, Yu H, Shimakawa A, Hines CD, McKenzie CA, Brittain JH. Quantification of hepatic steatosis with MRI: the effects of accurate fat spectral modeling. J Magn Reson Imaging. 2009;29(6):1332–1339. doi: 10.1002/jmri.21751. [DOI] [PMC free article] [PubMed] [Google Scholar]
- 34.Lee JT, Liau J, Murphy P, Schroeder ME, Sirlin CB, Bydder M. Cross-sectional investigation of correlation between hepatic steatosis and IVIM perfusion on MR imaging. Magn Reson Imaging. 2012;30(4):572–578. doi: 10.1016/j.mri.2011.12.013. [DOI] [PMC free article] [PubMed] [Google Scholar]