1. Introduction
Severe corneal injury can result in losses in transparency as a result of scarring and inflammation that occur during wound healing. This inappropriate response is due to specific increases in matrix metalloproteinase expression, dysregulated inflammation and myofibroblast transdifferentiation (Gordon et al., 2009; Gronert, 2010; Yamanaka et al., 2010). One of the receptors in mice activated by injury that contributes to such an inappropriate outcome is the transient receptor potential vanilloid subtype 1 (TRPV1) channel (Okada et al., 2011) since in wildtype mice endogenous TRPV1 agonists such as endovanilloids, endocannabinoids and lipooxygenase products elicit tissue fibrosis and dysregulated immune cell infiltration whereas in TRPV1-/- mice corneal transparency was completely restored. The dependence of these sight compromising responses on TRPV1 activation was validated based on no increases in proinflammatory cytokine and chemoattractant release by cultured TRPV1-/- mouse ocular fibroblasts (Okada et al., 2011) whereas in wildtype fibroblasts injury-induced increases in transforming growth factor (TGF)-β1, IL-6, MCP-1 and VEGF gene expression (Jester et al., 1999). However, there are no reports on the role of TRPV1 in primary cultures of human corneal stromal fibroblasts (HCF) in mediating such responses.
TRPV1, a nonselective cation channel, was originally discovered as a pain transducer in sensory neurons (Caterina et al., 1997). Recently, its expression has also been described in a host of non-excitable human tissues including corneal epithelial and endothelial cells, in the ophthalmic branch of the trigeminal nerve as well as gingival, synovial, dermal and bronchial fibroblasts (Murata and Masuko, 2006; Engler et al., 2007; Zhang et al., 2007; Mergler et al., 2011; Vennekens et al., 2008; Jain et al., 2011; Ozturk and Yildiz, 2011; Sadofsky et al., 2012). TRPV1 was first characterized as a receptor for capsaicin (CAP), a spicy ingredient in chili pepper. Later on, it was recognized as a polymodal receptor activated by diverse environmental stresses to mediate inflammatory responses. (Nilius and Voets, 2005); (Minke, 2006) Subsequent to corneal injury, TRPV1 activation can occur due to damage mediated release of the aforementioned endogenous agonists as well as multiple lipid metabolites and lipoxygenase products such as anandamide (Rosenbaum and Simon, 2007). Another activator is acidosis (i.e. pH<6) that can arise from bacterial infection subsequent to compromise of the corneal epithelial barrier function by injury. TRPV1 functional expression in many isolated tissue types has been characterized based on the ability of CAP to induce diverse signaling events leading to increases in proinflammatory cytokine and chemoattractant release (Zhang et al., 2007; Wang et al., 2011c).
We describe here in HCF TRPV1 mRNA protein and functional expression. CAP induced increases in nonselective cation channel whole cell currents that in part are accounted for by intracellular Ca2+ transients leading to global ERK1/2, JNK/SAPK and p38 MAPK activation. The increases in IL-6 release elicited by CAP occur solely as a consequence of p38 pathway activation. Therefore, increases in IL-6 release induced by TRPV1 activation on HCF can contribute to corneal opacification.
2. Materials and Methods
2.1. Reagents
TRPV1 agonist capsaicin (CAP), TRPV1 antagonist capsazepine (CPZ), p38 MAPK inhibitor SB203580, JNK1/2 MAPK inhibitor SP600125, ethylene glycol-bis(2-aminoethylether)-tetraacetic acid (EGTA) were purchased from Sigma-Aldrich (St. Louis, MO). Anti-phospho-ERK1/2 (sc-7383), GAPDH (sc-137179), TRPV1 (H-150) antibodies and NIH/3T3+heat shock cell lysates (sc-2217) were from Santa Cruz Biotechnology (Santa Cruz, CA). Anti-phospho-p38 (9215), total-p38 (9212), phospho-JNK/SAPK (9251) antibodies were purchased from Cell Signaling Technology (Danvers, MA).
2.2. Cell culture
Human cadaver corneas were obtained from National Disease Research Interchange (NDRI). Stromal keratocytes (fibroblasts) were isolated as previously described (Bernstein et al., 2004). Fresh keratocytes were cultured in Dulbecco's Modified Eagle's Medium/Ham's Nutrient Mixture F-12 (DMEM/F12; Gibco, Invitrogen, Paisley, UK) plus 10% fetal bovine serum (FBS; Gibco, Invitrogen, Grand Island, NY) medium so as to generate fibroblasts. Cells were used up to eight passages. All the experiments were done in supplemented serum-free medium (SSFM) (Wang et al., 2011a). After reaching 80-90% percent confluence, cells were serum-starved in DMEM/F12 supplemented with 0.5% FBS for 24 h followed by additional 24 h starvation in SSFM. Quiescent cells were subjected to experiments. Cell viability was confirmed based on measurements in an Accuri C6 flow cytometer (BD, Ann Arbor, MI) using propidium iodide (1 μg/ml, MP Biomedical) nucleic acid staining (data not shown).
2.3. Quantitative real-time PCR
Quantitative RT-PCR was performed as previously described (Akinci et al., 2009). Briefly, total RNA was isolated from human corneal fibroblasts (human corneal stromal keratocytes) using TRIzol® Reagent RT (Ambion, Austin, TX). RNA (2 μg) was transcribed into cDNA using reverse transcriptase (Omniscript™; Qiagen, Valencia, CA). No attempt was made to remove residual genomic DNA, but an identical mock reaction omitting the enzyme was carried out in parallel. Triplicate samples of the products of these reactions were subjected to quantitative real-time PCR in an ABI PRISM 7900H sequence detection instrument (annealing: 15 s at 55°C; DNA melting: 10 s at 95°C) using TaqMan® Gene Expression Master Mix (Applied Biosystems, Foster City, CA) and an amount of cDNA derived from 10 ng RNA. Two sets of TRPV1 (accession no. NM_080706) custom primers (Invitrogen, Grand Island, NY) were: 1) 5’-GCGACAGTTTTCAGGTCTC-3’ (forward) and 5’-GTTGACAGTGCTGTCTGCGT-3’ (reverse), generating a 103 bp product; 2) 5’-TGCAGAACTCCTGGCAGAC-3’ (forward) and 5’-CACAAACTTCGTGTTGTCGG-3’ (reverse), generating a 113 bp product. Beta-actin primers were used to generate a housekeeping mRNA for normalizing TRPV1 gene expression.
2.4. Immunocytochemistry
Cells seeded on 10-mm circular coverslips (Fisher Scientific, Pittsburgh, PA) were washed twice with HEPES-buffered Ringer's solution, fixed on ice for 30 min in 4% paraformaldehyde, washed three times with HEPES Ringer's solution, and then rendered permeable using 0.1% Triton X-100 solution (Zhang et al., 2007). After blocking with 10% bovine serum albumin (BSA), cells were exposed overnight at 4°C to primary antibody plus 1% BSA. Omission of the TRPV1 primary antibody provided a negative control to validate its selectivity. After three washes with HEPES Ringer's solution, cells were incubated with secondary antibody for 1 h and mounted with DAPI containing medium (sc-24941, Santa Cruz Biotechnology, Santa Cruz, CA) overnight at 4°C. Fluorescence was visualized using a Zeiss Axiovert 200 inverted epifluorescent confocal microscope equipped with AxioCam and Zeiss AxioVision 4.8.2 software (Carl Zeiss Inc) and a plan-apochromat 63× objective. Confocal images were acquired as z-stacks by obtaining sequential optical sections at 0.25 μm z-intervals and processed using Adobe® Photoshop 7.0 software (Adobe Systems, Inc., San Diego, CA).
2.5. Western Blot Analysis
Cells were washed twice in cold phosphate-buffered saline (PBS) and harvested in cell lysis buffer followed by sonication and centrifugation (13,000 rpm for 15 min at 4°C) (Wang et al., 2011c). Bicinchoninic acid assay determined the protein concentration of each lysate (micro BCA protein assay kit; Pierce Biotechnology, Rockford, IL). After boiling samples for 5 min, 20-50 μg denatured protein was electrophoresed in 10% polyacrylamide sodium dodecylsulphate (SDS) mini-gels, followed by blotting onto an Immun-Blot PVDF membrane (Bio-Rad, Hercules, CA). Membranes were blocked with 5% fat-free milk in 1× TBS buffer-0.1% Tween-20 for 1 h at room temperature and then reacted at 4°C overnight with a primary antibody of interest. Membranes were incubated with 1:2000 dilution of a secondary antibody for 1 h at room temperature. Immunobound antibody was visualized using an enhanced chemiluminescence detection system ECL Plus (GE Healthcare, Piscataway, NJ). Data were analyzed by densitometry (SigmaScan Pro; Sigma). All experiments were repeated at least three times unless otherwise indicated.
2.6. Single cell fluorescence imaging
Cells grown on 22-mm diameter coverslips (Fisher Scientific, Pittsburgh, PA) were loaded with 2 μM fura2-AM (Molecular Probes, Eugene, OR) at 37°C for 30 min and then washed with NaCl Ringer's solution containing (in mM): NaCl (141), KCl (4.2), CaCl2 (0.8), KH2PO4 (2), MgCl2 (1), glucose (5.5), and HEPES (10) with an osmolarity of 300 mOsm and pH 7.4. Following dye loading, single-cell fluorescence imaging was performed on the stage of an inverted microscope (Nikon Diaphot 200) using a chamber with a coverslip formed base. For the experiments requiring Ca2+-free conditions, cells were first pre-incubated with a Ca2+-free counterpart plus EGTA (2 mM) for 10 min. Cells were then alternately illuminated at 340 and 380 nm, and emission was monitored every 3 s at 510 nm using a Roper Scientific CCD camera. Each field of interest contained ~15-20 cells. Changes in intracellular Ca2+ levels, [Ca2+]i, were analyzed using Ratio Tool software (Isee Imaging, Durham, NC).
2.7. Whole-cell patch clamp
The whole-cell mode of the planar patch-clamp technique (port-a-patch©, Nanion, Munich, Germany) was used as previously described (Mergler et al., 2012). In brief, a calcium free standard intracellular solution was applied to the microchip, which contained (in mM): NaCl (150), MgCl2 (3), EGTA (5) and HEPES (10) at pH 7.2. Cells were pretreated with trypsin/EDTA to obtain a single cell suspension and pipetted onto a microchip. The standard extracellular bath solution contained (in mM): Na-gluconate (150), CsCl (6), MgCl2 (1), CaCl2 (1.5), glucose (10) and HEPES (10) at pH 7.4. Na-gluconate was used instead of NaCl to avoid any possible confounding anion channel outward currents (chloride). The resistance of the microchip corresponds to a pipette resistance of 2–5 MΩ. Suction was applied to allow formation of the whole-cell configuration. Membrane currents were recorded using an EPC 10 with Patchmaster software version 2.5 for Windows (HEKA, Lamprecht, Germany). Series resistance errors as well as fast and slow capacitance transients were compensated with the patch-clamp amplifier in conjunction with the software. All experiments were performed at room temperature (≈18–23°C). Channel behavior was characterized based on responses to voltage protocols and perfusion of appropriate chemical modulators. The holding potential (HP) was set to 0 mV to eliminate any possible contributions by voltage-dependent Ca2+ channel activity. Whole-cell currents were recorded for 400 ms using voltage steps ranging between -60 and +130 mV (10 mV increments). The resulting currents were normalized to cell membrane capacitance resulting in current density ([pA/pF]). All plots were generated with SigmaPlot software and an electrophysiology module. Bar charts were plotted with GraphPad Prism version 5 for Windows (GraphPad Software, San Diego, California USA).
2.8 Small interfering RNA transfection
Small interfering RNA (siRNA) transfection was performed per manufacturer's instructions (Santa Cruz Biotechnology, Santa Cruz, CA). Briefly, cells were grown in six-well plates to 40% confluence in antibiotic-free 10% FBS-containing medium. For each transfection, 6 μl TRPV1 siRNA duplex (sc-36826A, Sense: GAAGACCUGUCUGCUGAAAtt. Antisense: UUUCAGCAGACAGGUCUUCtt. sc-36826B, Sense: CGAGCAUGUACAAUGAGAUtt; Antisense: AUCUCAUUGUACAUGCUCGtt; sc-36826C, Sense: CGCAUCUUCUACUUCAACUtt; Antisense: AGUUGAAGUAGAAGAUGCGtt.) was mixed with 6 μl of transfection reagent (sc-29528) in 200 μl transfection medium (sc-36868). Mixtures were incubated for 30 min at room temperature. Each well was washed with 2 ml transfection medium once and then filled with prepared reagent mixture plus 0.8 ml transfection medium. After incubation overnight, an additional 1 ml of medium supplemented with 20% FBS was added to each well for another 24 h. Transfection mixture was removed and replaced with normal growth medium. All experimental measurements were performed 72 h following transfection. Western blot analyses were performed to evaluate the extent of TRPV1 gene knockdown. Scrambled siRNAs (sc-37007) were used as a control for monitoring non–sequence-specific effects.
2.9 Enzyme-linked immunosorbent assay (ELISA)
IL-6 ELISA was performed on a cell culture supernatant according to the manufacturer's instructions and normalized by the total amount of protein obtained by dissolving the washed cells in 2% SDS and 0.5N NaOH (R&D Systems; Minneapolis, MN). Each experiment was repeated three times.
2.10. Statistical analysis
All results are reported as means ± SEM. Statistical significance was assessed using the paired Students t-test. P values of less than 0.05 were considered significant.
3. Results
3.1. TRPV1 expression identification
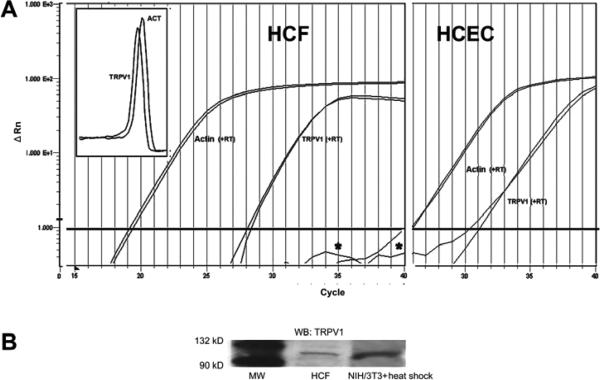
In-situ human corneal stromal fibroblast (keratocyte) TRPV1 expression was recently identified (Zhang 2007). We validated the relevance of using HCF to probe for TRPV1 functional expression by employing three different independent protocols to probe for TRPV1 expression. Quantitative RT-PCR results showed reverse transcriptase-dependent generation of products for both β-actin and TRPV1 in both the HCF and human corneal epithelial cells (HCEC) (Fig. 1A). The presence of TRPV1 in the latter was demonstrated previously (Zhang et al., 2007). Melting curve overlap indicates the generation of a single product (Fig. 1A, insert). Comparisons of Cts suggest that the level of TRPV1 gene expression relative to the β-actin level was about 8-fold lower in the HCF than in HCEC. Western blot analysis revealed TRPV1 protein expression (Fig. 1B). The 100 kDa band shown matches the reported apparent molecular weight of TRPV1 (Zhang et al., 2007), which also resembles the band obtained from heat-shock treated NIH/3T3 whole cell lysates (a positive control). Immunocytochemical TRPV1 expression localization shown in figure 1C indicates dense TRPV1 staining along the cell membrane perimeter as well as in the cytoplasmic and perinuclear regions. Figure 1D provides an image of cells not exposed to the primary antibody viewed at the same magnification. Absence of staining validates its selectivity to identify cellular TRPV1 expression.
Figure 1.
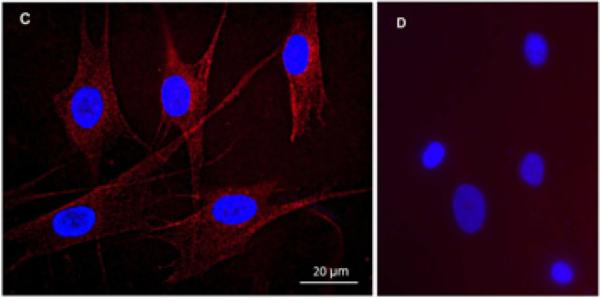
TRPV1 gene and protein expression in HCF. (A) Quantitative RT-PCR reveals TRPV1 expression in HCF (left panel). The close correspondence between the two melting curves shown in the insert suggests that two different TRPV1 primer sets generated a single cDNA product. This result supports the notion of TRPV1 gene expression by HCF. β-actin expression level was used as an internal control to calculate relative TRPV1 gene expression level. HCEC served as a positive control (right panel). (B) Western blot analysis shows TRPV1 100kD expression in HCF. Heat shock treated NIH/3T3 cell lysates served as a positive control. (C) Immunocytochemistry documents TRPV1 localization. Punctuate red staining represents TRPV1. DAPI Blue staining identifies nuclei. Calibration bar is 20 μm. (D) Omission of primary TRPV1 antibody served as a negative control to validate its selectivity to detect cellular expression.
3.2. TRPV1 channel functional characterization
Figure 2A shows CAP (20 μM) rapidly increased [Ca2+]I about two-fold followed by a gradual decline to its baseline level after 500 s. Such increases were blocked either by pre-incubation with capsazepine (CPZ, 10 μM), or exposure to Ca2+ free/EGTA medium (Fig. 2B). These inhibitory effects are supportive of functional cell membrane TRPV1 expression.
Figure 2.
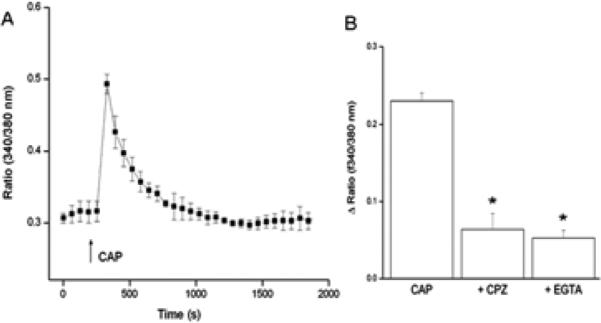
TRPV1-mediated intracellular Ca2+ transients in HCF. (A) Fura-2AM-loaded HCF were used to characterize CAP (20 μM)-induced [Ca2+]i transients using single cell imaging. (↑) indicate the time applying CAP. (B) Pre-incubation with CPZ (10 μM) for 60 min or replacement with Ca2+ free/EGTA (2 mM) medium 15 min prior to CAP (20 μM) exposure inhibited induced [Ca2+]i transients. (Data are means ± SEM of at least three independent experiments; statistic significances are indicated by asterisks, *p<0.05).
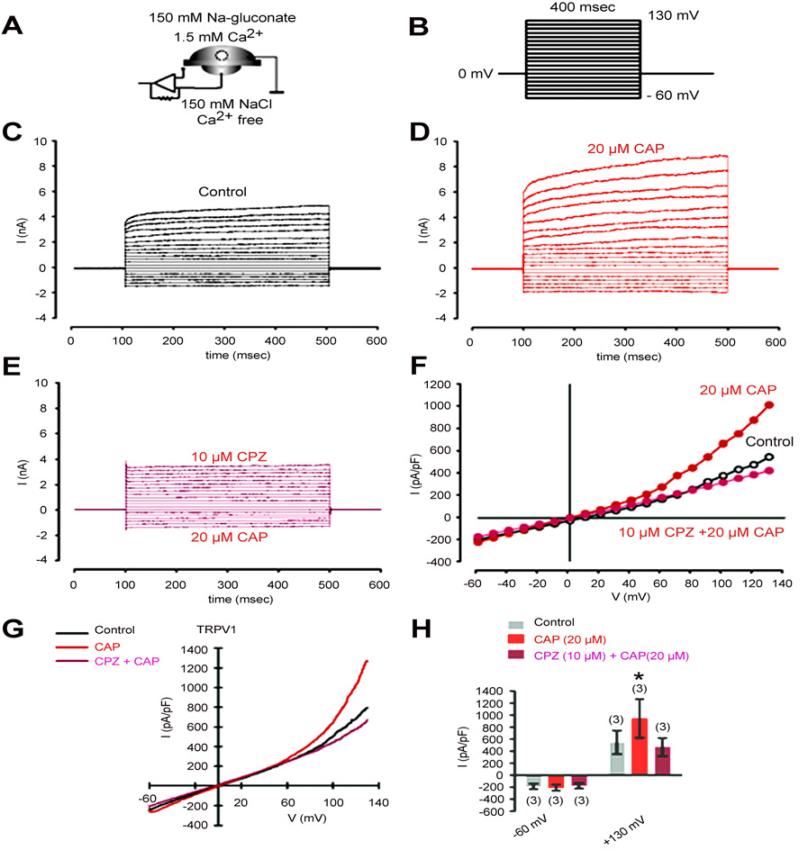
To further validate TRPV1 functionality, we probed for currents arising from exposure to CAP. The whole-cell mode configuration and the experimental protocol shown in Figure 3A/B were used. The holding potential was set to 0 mV to eliminate the possibility of activating voltage-dependent channels. The current responses in the presence and absence of CAP as well as CAP plus CPZ are shown in Figure 3C/D/E. CAP increased outward currents at voltage steps above +60 mV (Fig. 3F). The outward currents increased from 550 ± 190 pA/pF to 970 ± 300 pA/pF (n=3; p<0.05). This rise was eliminated after pre-incubation with CPZ (Fig. 3H). Taken together, TRPV1 expression in HCF is functional as CAP induced both Ca2+ transients and outward rectifying currents.
Figure 3.
CAP induces through TRPV1 activation non-selective cation channel currents in HCF. (A) Experimental design (whole-cell configuration of the planar-patch clamp technique). Currents were identified by their dependence on the permeating ion. Chloride was replaced by isosmotic gluconate substitution in the external solution to avoid chloride outward currents. (B) Voltage pulse protocol. Holding potential (HP) was set to 0 mV to avoid any voltage-dependent ion channel currents. (C) Nonselective cation channel currents induced by depolarization from -60 mV to 130 mV after establishing the whole-cell configuration (without leak current subtraction) (control). (D) Increased cation channel currents in the presence of CAP (20 μM). (E) Inhibition of CAP-induced cation channel currents in the presence of CPZ (10 μM). (F) Effects of CAP and CPZ are summarized in a current/voltage plot (I-V plot). All values are reported as means ± SEM. Data were obtained from the recordings shown in (C), (D), and (E). For the current/voltage relation, maximal peak current amplitudes were plotted against the voltage (mV). The currents were normalized to capacitance to obtain current density (pA/pF). The upper trace (red filled circles) was obtained in the presence of 20 μM CAP and the lower trace (open circles) without CAP. CAP-induced increases in non-selective cation channel outward currents at potentials above +60 mV were discernible. The second lower trace (mauve filled circles) was obtained after CPZ pre-incubation. (G) Original traces of CAP activated TRPV1 channel responses to voltage ramps from -60 mV up to +130 mV (without leak current subtraction) in the whole-cell configuration of the planar patch-clamp technique. Currents are shown before application (black), during application of CAP (20 μM, red) and after application of CPZ (mauve). The currents were normalized to capacitance to obtain current density (pA/pF). (H) Summary of the experiments with CAP in the presence of Na-gluconate in the external solution. All values are reported as means ± SEM. The asterisks (*) indicate statistically significant increases of outward currents with and without CAP (n = 3; p < 0.05; paired tested).
3.3. TRPV1- induces global MAPK activation
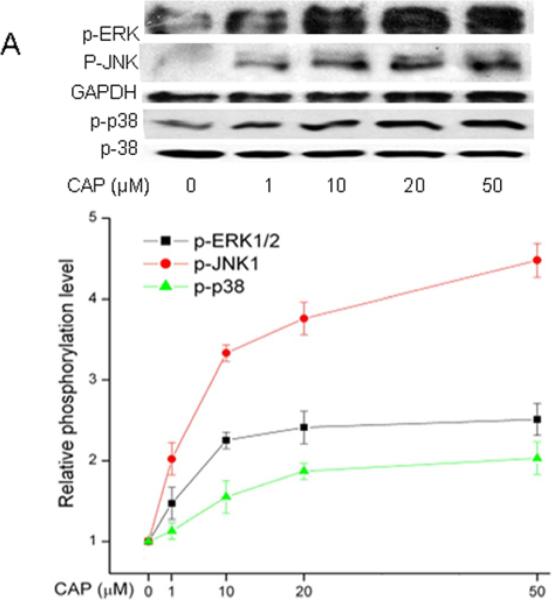
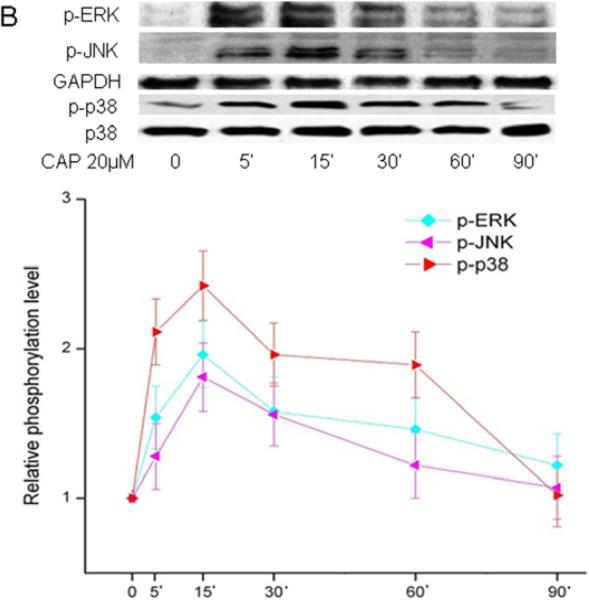
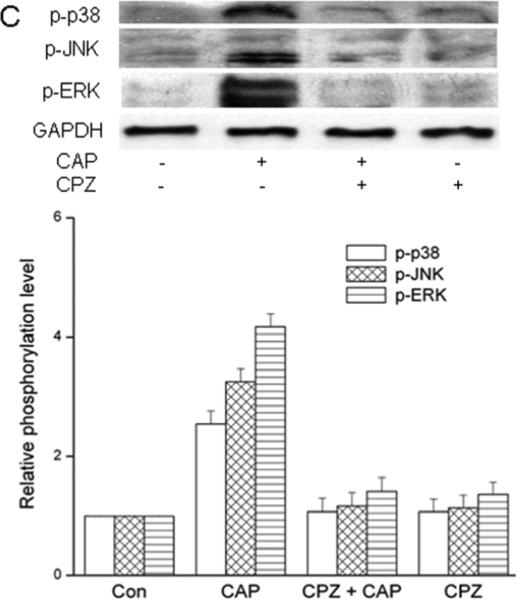
Ca2+ transients mediate receptor induced mitogen activated protein kinase phosphorylation (MAPK) (Berridge et al., 2000) in numerous different tissues as well as HCEC (Wang et al., 2011b). As TRPV1 activation by CAP in HCEC elicited global MAPK phosphorylation (i.e. activation), the same assessment was performed on HCF (Zhang et al., 2007; Yang et al., 2010; Wang et al., 2011c). Figure 4A shows the dose-dependent effects of CAP on ERK1/2, p38 and JNK/SPAK MAPK terminal kinase (TK) phosphorylation after a 15 min exposure to this agonist. The phosphorylation levels of all three TKs increased as a function of increases in CAP dose. Figure 4B shows the increases in TK phosphorylation over a 90-min period resulting from exposure to 20 μM CAP. After 5-15 min, TK activation reached a maximal level and then started to wane over the next 75 min.
Figure 4.
TRPV1-induced global MAPK stimulation. (A) Western blots reveal dose-dependent changes by capsaicin of ERK1/2, JNK/SAPK and p38 MAPK phosphorylation. HCF was exposed to CAP for 15 min at indicated doses. (B) 20 μM CAP activated ERK1/2, JNK/SAPK and p38 MAPK over a 90 min period. Cell lysates were harvested at indicated time points. (C) Pre-incubation with CPZ (10 μM) for 60 min suppressed CAP (20 μM) induced MAPK activation at 15 min. GAPDH and total p38 served as loading controls. Representative results are shown from three independent experiments.
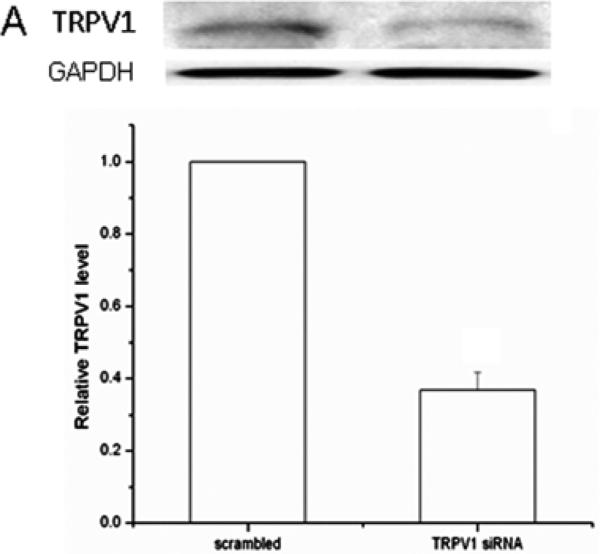
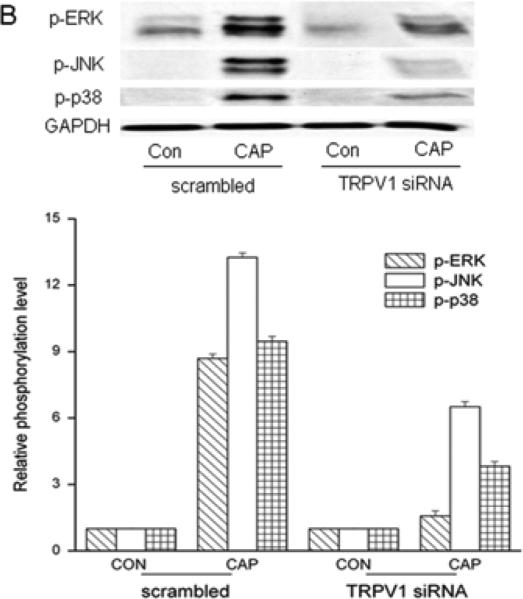
To validate CAP selectivity to induce MAPK activation, these responses were compared in the presence and absence of CPZ. Figure 4C shows CAP-induced TK phosphorylation was completely abolished in the presence of CPZ (10 μM). TRPV1 siRNA gene knockdown was also used to confirm dependence of TRPV1 expression on MAPK activation by CAP. TRPV1 protein expression was reduced by 65% in the TRPV1 siRNA transduced cells compared to scrambled control cells (Fig. 5A). After TRPV1 gene silencing, CAP-induced global MAPK activation at 15 min was diminished (Fig. 5B) indicating TRPV1 involvement in eliciting these responses.
Figure 5.
TRPV1 gene silencing reduces CAP-induced MAPK activation. (A) Validation of TRPV1 gene knockdown by siRNA. Western blot analysis compares TRPV1 protein expression level in cells transfected with either scrambled siRNA or TRPV1 siRNA. Housekeeping gene GAPDH confirmed equivalent protein loading. (B) TRPV1 gene silencing reduced CAP (20 μM) induced ERK1/2, JNK/SAPK and p38 MAPK phosphorylation at 15 min. GAPDH was used as loading controls. Representative results obtained from three independent experiments are shown.
3.4. TRPV1 activation induces IL-6 release
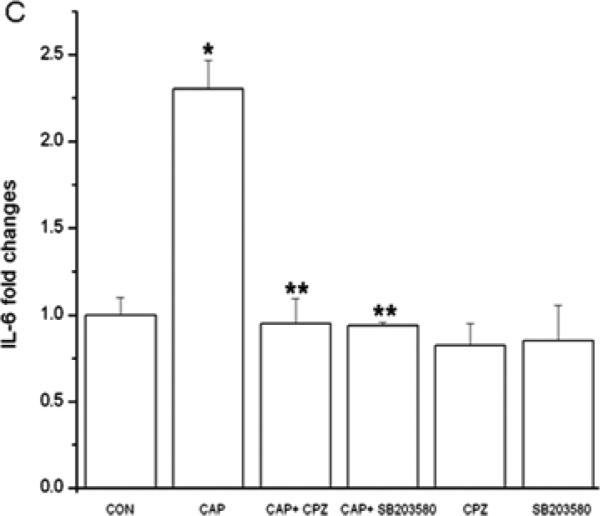
CAP-induced in HCEC through JNK1 MAPK stimulation increases in IL-6 expression and rises in IL-6 mRNA expression in mouse orbital fibroblasts (Okada et al., 2011; Wang et al., 2011c). Figure 6A shows in HCF that CAP-induced after 24 h dose dependent increases in IL-6 release. Fifty μM CAP maximally increased IL-6 release by 4-fold. Such responses were abolished, either by CPZ or TRPV1 siRNA gene silencing (Fig. 6B/C). Moreover, in the presence of a p38 MAPK inhibitor SB203580, IL-6 rises were also abrogated (Fig. 6C), suggesting TRPV1 activation elicited IL-6 increases through p38 MAPK stimulation.
Figure 6.
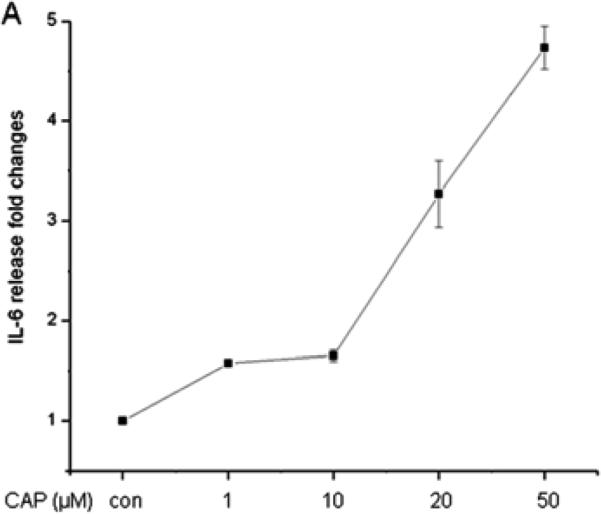
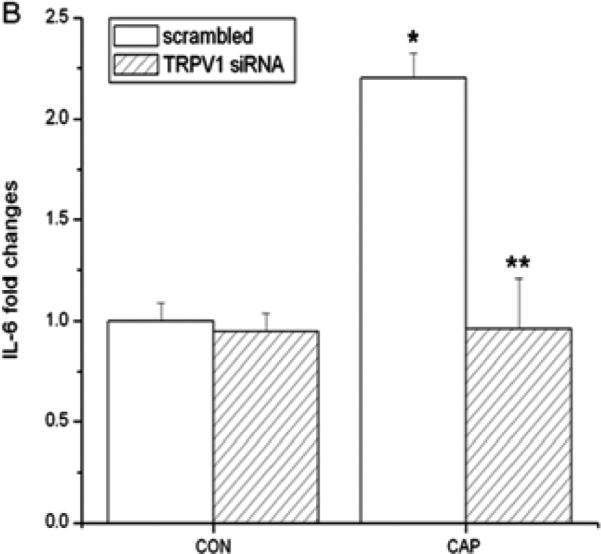
TRPV1 activation elicits increases in IL-6 release through p38 MAPK pathway in HCF. (A) After 24 h incubation, ELISA reveals dose-dependent increases by CAP (1-50 μM) on IL-6 release. (B) TRPV1 gene silencing blocked CAP-induced IL-6 release. After transduction with scrambled or TRPV1 siRNA, HCF were treated with 20 μM CAP. (C) Following pre-incubation with either 10 μM CPZ or SB203580 for 60 min, the effects of CAP were determined on IL-6 release. Results are reported as fold changes of the control in means ± SEM (n=3). *p<0.05 vs. untreated control; **p<0.05 vs. treated wildtype with CAP.
4. Discussion
Although TRPV1 was first identified in the afferent sensory neurons mediating nociception (Caterina et al., 1997; Nilius et al., 2007; Nilius and Voets, 2005; Vennekens et al., 2008), there are numerous reports describing its functional expression in numerous other non-excitable tissues, including several types of fibroblasts (Jain et al., 2011; Miyamoto et al., 2005). TRPV1 gene expression in HCF was validated by showing with qRT-PCR that two separate customized TRPV1 primer sets yielded identical amplification curves (Fig. 1A). The selectivity of the primers was validated by observing similar amplification responses from the positive control HCEC cDNA. Furthermore, the near identity of the two melting curves shown in the Fig. 1A insert substantiates the notion of a single cDNA product. The apparent MW of TRPV1 protein in HCF is 100kD (Fig. 1B). This result is in agreement with findings in other cell types (Zhang et al., 2007; Caterina et al., 1997). Anti-TRPV1 antibody selectivity was confirmed since western blot analysis revealed an identical immunoreactive band in the positive control heat-shock treated NIH/3T3 cell lysates. Based on the HCF immunocytochemical TRPV1 localization pattern (Fig. 1C), TRPV1 expression is not restricted to the plasma membrane since it is also detectable in the cytoplasmic and perinuclear regions. Its plasma membrane expression is consistent with the finding that CAP-induced Ca2+ transients were only elicited provided the external medium contained Ca2+, which could be blocked by preincubation with capsazepine (Fig. 2A, B). These effects agree with those in dermal (Jain et al., 2011) and synovial fibroblasts (Hu et al., 2008). TRPV1 staining in the perinuclear region agrees with its identification in the endoplasmic reticulum in neurons (Karai et al., 2004). However, the functional significance of perinuclear expression is unclear.
In HCF, 20 μM CAP induced ≈130% maximum increases in the nonselective cation channel whole cell currents, which underlie increases in plasma membrane Ca2+ influx induced by this agonist (Fig. 3H). The I-V curve shown in Fig. 3F resembles the typical outward rectification feature of TRPV1 currents described in different expression systems, since the current increases induced by depolarizing voltages in the presence of CAP were larger than those at hyperpolarizing voltages (Caterina et al., 1997; Nilius et al., 2007).
The CAP-induced time dependent global increases in MAPK activation in HCF agree with those in HCEC ;namely a rapid increase that peaked at 5-15 min followed by a decline in the next 75 min (Fig. 4B) (Wang et al., 2011c). In multiple tissue types as well as HCF, similar effects lead to increases in pro-inflammatory cytokine release that include IL-6 (Miyamoto et al., 2005; Jain et al., 2011; Engler et al., 2007; Zhang et al., 2007). These effects of CAP were dependent on TRPV1 activation since either pre-incubation with CPZ or TRPV1 siRNA gene silencing abolished them (Fig. 4C/5).
An anti-IL-6 receptor antibody is used in a clinical setting for controlling inflammation in diseases such as rheumatoid arthritis since increases in IL-6 release contribute to the inflammatory responses described in different autoimmune diseases (Jones et al., 2009; Barnes et al., 2011). Such rises subsequent to a corneal alkali burn in mice induced by corneal TRPV1 activation contribute to losses in stromal integrity resulting from edema and immune cell infiltration (Okada et al., 2011). This study suggests that in HCF activation of TRPV1 by injury is a contributor to the inflammatory response induced by an alkali burn since 20 and 50 μM CAP induced 200% and 350% rises in IL-6 release (Fig. 6A), which were obviated by either CPZ preincubation or exposing TRPV1 siRNA gene silenced cells to CAP (Fig. 6B/C). Since corneal damage releases multiple endogenous TRPV1 ligands leading to increases in IL-6 release, blocking TRPV1 activation could be a therapeutic option to control injury-induced corneal fibrosis (Rosenbaum and Simon, 2007).
The specific MAPK pathway eliciting TRPV1control of IL-6 release is tissue type specific (Fig. 4A). In HCEC, TRPV1 elicited this response solely through JNK1 MAPK activation (Wang et al., 2011c). In contrast, in human dental pulp fibroblasts and HCF it is instead p38 MAPK dependent since a p38 inhibitor SB203580 completely abrogated CAP-induced increases in IL-6 release whereas a JNK inhibitor SP600125 had no inhibitory effect (data not shown) (Miyamoto et al., 2005). This difference between the MAPK pathway involvement in HCEC and HCF suggests that controlling inflammation through direct suppression of TRPV1 activation or TRPV1 downregulation may be a more practical approach to treating corneal injury since increases in human and murine epithelial cell migration during wound healing are mediated through both p38 MAPK and JNK activation (Saika et al., 2004; Zhang et al., 2007; Wang et al., 2006; Okada et al., 2009).
In conclusion, plasma membrane activation by CAP in HCF mediates outward rectifying non-selective cation channel currents. [Ca2+]i transients are one of the contributors to this influx and they induce global MAPK activation. However, p38 MAPK activation solely mediates CAP-induced increases in IL-6 release. The correspondence between the TRPV1-induced increases in IL-6 expression induced in vivo and HCF suggests that the inappropriate wound healing response in vivo caused by dysregulated inflammation and scarring is in part attributable to the release by injury of endogenous ligands that activate TRPV1.
Highlights.
▶We describe functional TRPV1 activity in human corneal fibroblasts.
▶ TRPV1-activation elicits currents that mediate MAPK activation and IL-6 release.
▶TRPV1 is a potential drug target to reduce injury-induced opacification.
Acknowledgements
This study was supported by a grant from NEI EY04795 (P.S.R); W81XWH090163 (P.S.R); EY 014878 (J.M.W.), NYStem NG 326 (J.M.W.), Research to Prevent Blindness, Inc. (J.M.W.).
Footnotes
Publisher's Disclaimer: This is a PDF file of an unedited manuscript that has been accepted for publication. As a service to our customers we are providing this early version of the manuscript. The manuscript will undergo copyediting, typesetting, and review of the resulting proof before it is published in its final citable form. Please note that during the production process errors may be discovered which could affect the content, and all legal disclaimers that apply to the journal pertain.
Disclosure: Yuanquan Yang, none; Hua Yang, none; Zheng. Wang, none; Stefan Mergler, none; J. Mario. Wolosin, none; Peter S. Reinach, none.
References
- Akinci MA, Turner H, Taveras M, Barash A, Wang Z, Reinach P, Wolosin JM. Molecular profiling of conjunctival epithelial side-population stem cells: atypical cell surface markers and sources of a slow-cycling phenotype. Invest Ophthalmol Vis Sci. 2009;50:4162–4172. doi: 10.1167/iovs.08-2861. [DOI] [PMC free article] [PubMed] [Google Scholar]
- Barnes TC, Anderson ME, Moots RJ. The many faces of interleukin-6: the role of IL-6 in inflammation, vasculopathy, and fibrosis in systemic sclerosis. Int J Rheumatol. 2011;2011:721608. doi: 10.1155/2011/721608. [DOI] [PMC free article] [PubMed] [Google Scholar]
- Bernstein AM, Greenberg RS, Taliana L, Masur SK. Urokinase anchors uPAR to the actin cytoskeleton. Invest Ophthalmol Vis Sci. 2004;45:2967–2977. doi: 10.1167/iovs.04-0030. [DOI] [PubMed] [Google Scholar]
- Berridge MJ, Lipp P, Bootman MD. The versatility and universality of calcium signalling. Nat Rev Mol Cell Biol. 2000;1:11–21. doi: 10.1038/35036035. [DOI] [PubMed] [Google Scholar]
- Caterina MJ, Schumacher MA, Tominaga M, Rosen TA, Levine JD, Julius D. The capsaicin receptor: a heat-activated ion channel in the pain pathway. Nature. 1997;389:816–824. doi: 10.1038/39807. [DOI] [PubMed] [Google Scholar]
- Engler A, Aeschlimann A, Simmen BR, Michel BA, Gay RE, Gay S, Sprott H. Expression of transient receptor potential vanilloid 1 (TRPV1) in synovial fibroblasts from patients with osteoarthritis and rheumatoid arthritis. Biochem Biophys Res Commun. 2007;359:884–888. doi: 10.1016/j.bbrc.2007.05.178. [DOI] [PubMed] [Google Scholar]
- Gordon GM, Ledee DR, Feuer WJ, Fini ME. Cytokines and signaling pathways regulating matrix metalloproteinase-9 (MMP-9) expression in corneal epithelial cells. J Cell Physiol. 2009;221:402–411. doi: 10.1002/jcp.21869. [DOI] [PMC free article] [PubMed] [Google Scholar]
- Gronert K. Resolution, the grail for healthy ocular inflammation. Exp Eye Res. 2010;91:478–485. doi: 10.1016/j.exer.2010.07.004. [DOI] [PMC free article] [PubMed] [Google Scholar]
- Hu F, Sun WW, Zhao XT, Cui ZJ, Yang WX. TRPV1 mediates cell death in rat synovial fibroblasts through calcium entry-dependent ROS production and mitochondrial depolarization. Biochem Biophys Res Commun. 2008;369:989–993. doi: 10.1016/j.bbrc.2008.02.155. [DOI] [PubMed] [Google Scholar]
- Jain A, Bronneke S, Kolbe L, Stab F, Wenck H, Neufang G. TRP-channel-specific cutaneous eicosanoid release patterns. Pain. 2011;152:2765–2772. doi: 10.1016/j.pain.2011.08.025. [DOI] [PubMed] [Google Scholar]
- Jester JV, Petroll WM, Cavanagh HD. Corneal stromal wound healing in refractive surgery: the role of myofibroblasts. Prog Retin Eye Res. 1999;18:311–356. doi: 10.1016/s1350-9462(98)00021-4. [DOI] [PubMed] [Google Scholar]
- Jones G, Sebba A, Gu J, Lowenstein MB, Calvo A, Gomez-Reino JJ, Siri DA, Tomsic M, Alecock E, Woodworth T, Genovese MC. Comparison of tocilizumab monotherapy versus methotrexate monotherapy in patients with moderate to severe rheumatoid arthritis: the AMBITION study. Ann Rheum Dis. 2009;69:88–96. doi: 10.1136/ard.2008.105197. [DOI] [PMC free article] [PubMed] [Google Scholar]
- Karai LJ, Russell JT, Iadarola MJ, Olah Z. Vanilloid receptor 1 regulates multiple calcium compartments and contributes to Ca2+-induced Ca2+ release in sensory neurons. J Biol Chem. 2004;279:16377–16387. doi: 10.1074/jbc.M310891200. [DOI] [PubMed] [Google Scholar]
- Mergler S, Garreis F, Sahlmuller M, Lyras EM, Reinach PS, Dwarakanath A, Paulsen F, Pleyer U. Calcium regulation by thermo- and osmosensing transient receptor potential vanilloid channels (TRPVs) in human conjunctival epithelial cells. Histochem Cell Biol. 2012;137:743–761. doi: 10.1007/s00418-012-0924-5. [DOI] [PubMed] [Google Scholar]
- Mergler S, Valtink M, Taetz K, Sahlmuller M, Fels G, Reinach PS, Engelmann K, Pleyer U. Characterization of transient receptor potential vanilloid channel 4 (TRPV4) in human corneal endothelial cells. Exp Eye Res. 2011;93:710–719. doi: 10.1016/j.exer.2011.09.021. [DOI] [PubMed] [Google Scholar]
- Minke B. TRP channels and Ca2+ signaling. Cell Calcium. 2006;40:261–275. doi: 10.1016/j.ceca.2006.05.002. [DOI] [PMC free article] [PubMed] [Google Scholar]
- Miyamoto R, Tokuda M, Sakuta T, Nagaoka S, Torii M. Expression and characterization of vanilloid receptor subtype 1 in human dental pulp cell cultures. J Endod. 2005;31:652–658. doi: 10.1097/01.don.0000155259.22746.ae. [DOI] [PubMed] [Google Scholar]
- Murata Y, Masuko S. Peripheral and central distribution of TRPV1, substance P and CGRP of rat corneal neurons. Brain Res. 2006;1085:87–94. doi: 10.1016/j.brainres.2006.02.035. [DOI] [PubMed] [Google Scholar]
- Nilius B, Mahieu F, Karashima Y, Voets T. Regulation of TRP channels: a voltage-lipid connection. Biochem Soc Trans. 2007;35:105–108. doi: 10.1042/BST0350105. [DOI] [PubMed] [Google Scholar]
- Nilius B, Voets T. TRP channels: a TR(I)P through a world of multifunctional cation channels. Pflugers Arch. 2005;451:1–10. doi: 10.1007/s00424-005-1462-y. [DOI] [PubMed] [Google Scholar]
- Okada Y, Reinach PS, Shirai K, Kitano A, Kao WW, Flanders KC, Miyajima M, Liu H, Zhang J, Saika S. TRPV1 involvement in inflammatory tissue fibrosis in mice. Am J Pathol. 2011;178:2654–2664. doi: 10.1016/j.ajpath.2011.02.043. [DOI] [PMC free article] [PubMed] [Google Scholar]
- Okada Y, Saika S, Shirai K, Yamanaka O, Kitano A, Wang Z, Yang H, Reinach P. JNK MAPK signaling contributes in vivo to injury-induced corneal epithelial migration. Ophthalmic Res. 2009;42:185–192. doi: 10.1159/000232401. [DOI] [PubMed] [Google Scholar]
- Ozturk A, Yildiz L. Expression of transient receptor potential vanilloid receptor 1 and toll-like receptor 4 in aggressive periodontitis and in chronic periodontitis. J Periodontal Res. 2011;46:475–482. doi: 10.1111/j.1600-0765.2011.01363.x. [DOI] [PubMed] [Google Scholar]
- Rosenbaum T, Simon SA. TRPV1 Receptors and Signal Transduction. 2007. [PubMed]
- Sadofsky LR, Ramachandran R, Crow C, Cowen M, Compton SJ, Morice AH. Inflammatory stimuli up-regulate transient receptor potential vanilloid-1 expression in human bronchial fibroblasts. Exp Lung Res. 2012;38:75–81. doi: 10.3109/01902148.2011.644027. [DOI] [PubMed] [Google Scholar]
- Saika S, Okada Y, Miyamoto T, Yamanaka O, Ohnishi Y, Ooshima A, Liu CY, Weng D, Kao WW. Role of p38 MAP kinase in regulation of cell migration and proliferation in healing corneal epithelium. Invest Ophthalmol Vis Sci. 2004;45:100–109. doi: 10.1167/iovs.03-0700. [DOI] [PubMed] [Google Scholar]
- Vennekens R, Owsianik G, Nilius B. Vanilloid transient receptor potential cation channels: an overview. Curr Pharm Des. 2008;14:18–31. doi: 10.2174/138161208783330763. [DOI] [PubMed] [Google Scholar]
- Wang L, Ko CY, Meyers EE, Pedroja BS, Pelaez N, Bernstein AM. Concentration-dependent effects of transforming growth factor beta1 on corneal wound healing. Mol Vis. 2011a;17:2835–2846. [PMC free article] [PubMed] [Google Scholar]
- Wang Z, Bildin VN, Yang H, Capo-Aponte JE, Yang Y, Reinach PS. Dependence of corneal epithelial cell proliferation on modulation of interactions between ERK1/2 and NKCC1. Cell Physiol Biochem. 2011b;28:703–714. doi: 10.1159/000335764. [DOI] [PMC free article] [PubMed] [Google Scholar]
- Wang Z, Yang H, Tachado SD, Capo-Aponte JE, Bildin VN, Koziel H, Reinach PS. Phosphatase-mediated crosstalk control of ERK and p38 MAPK signaling in corneal epithelial cells. Invest Ophthalmol Vis Sci. 2006;47:5267–5275. doi: 10.1167/iovs.06-0642. [DOI] [PubMed] [Google Scholar]
- Wang Z, Yang Y, Yang H, Capo-Aponte JE, Tachado SD, Wolosin JM, Reinach PS. NF-kappaB feedback control of JNK1 activation modulates TRPV1-induced increases in IL-6 and IL-8 release by human corneal epithelial cells. Mol Vis. 2011c;17:3137–3146. [PMC free article] [PubMed] [Google Scholar]
- Yamanaka O, Liu CY, Kao WW. Fibrosis in the anterior segments of the eye. Endocr Metab Immune Disord Drug Targets. 2010;10:331–335. doi: 10.2174/1871530311006040331. [DOI] [PubMed] [Google Scholar]
- Yang H, Wang Z, Capo-Aponte JE, Zhang F, Pan Z, Reinach PS. Epidermal growth factor receptor transactivation by the cannabinoid receptor (CB1) and transient receptor potential vanilloid 1 (TRPV1) induces differential responses in corneal epithelial cells. Exp Eye Res. 2010;91:462–471. doi: 10.1016/j.exer.2010.06.022. [DOI] [PMC free article] [PubMed] [Google Scholar]
- Zhang F, Yang H, Wang Z, Mergler S, Liu H, Kawakita T, Tachado SD, Pan Z, Capo-Aponte JE, Pleyer U, Koziel H, Kao WW, Reinach PS. Transient receptor potential vanilloid 1 activation induces inflammatory cytokine release in corneal epithelium through MAPK signaling. J Cell Physiol. 2007;213:730–739. doi: 10.1002/jcp.21141. [DOI] [PubMed] [Google Scholar]


