

Summary
PspA, -B and -C regulate the bacterial phage shock protein stress response by controlling the PspF transcription factor. Here, we have developed complementary approaches to study the behavior of these proteins at their endogenous levels in Yersinia enterocolitica. First, we observed GFP-tagged versions with an approach that resolves individual protein complexes in live cells. This revealed that PspA, -B and -C share common behaviors, including a striking contrast before and after induction. In uninduced cells, PspA, -B and -C were highly mobile and widely distributed. However, induction reduced mobility and the proteins became more organized. Combining mCherry- and GFP-tagged proteins also revealed that PspA colocalizes with PspB and PspC into large stationary foci, often located close to the pole of induced cells. In addition, co-immunoprecipitation assays provided the first direct evidence supporting the model that PspA switches binding partners from PspF to PspBC upon induction. Together, these data suggest that PspA, -B and -C do not stably interact and are highly mobile before induction, perhaps sampling the status of the membrane and each other. However, an inducing signal promotes PspABC complex formation and their relocation to discrete parts of the membrane, which might then be important for mitigating envelope stress.
Keywords: Yersinia, stress response, GFP, protein interactions
Introduction
Bacteria have evolved extracytoplasmic stress responses to adapt to conditions that can affect their cell envelopes adversely. One is the highly conserved phage shock protein (Psp) system that was discovered originally in Escherichia coli (reviewed by Model et al., 1997, Darwin, 2005, Joly et al., 2010, Yamaguchi and Darwin, 2012). The Psp system has also been studied extensively in the intestinal pathogen Yersinia enterocolitica, where it is essential for virulence (Darwin and Miller, 2001). In various bacteria it has been associated with macrophage infection, biofilm formation and persister cells (Eriksson et al., 2003, Beloin et al., 2004, Lucchini et al., 2005, Vega et al., 2012). Furthermore, in addition to its role in Y. enterocolitica virulence, it is also critical for the virulence of Salmonella enterica sv. Typhimurium (Karlinsey et al., 2010).
Expression of Psp system-encoding genes is induced by environmental conditions including heat and osmotic shock, and by the overproduction of some envelope proteins (reviewed in Joly et al., 2010). The inducing signal is unknown, but might be related to cytoplasmic membrane integrity. However, a suggestion that it is dissipation of the proton motive force has now lost credibility (Engl et al., 2011, Horstman and Darwin, 2012). One particularly potent and remarkably specific inducing event is the mislocalization of a secretin protein into the cytoplasmic membrane (Lloyd et al., 2004, Maxson and Darwin, 2004, Guilvout et al., 2006, Seo et al., 2007). Secretins are multimeric pore forming components of type 2 and 3 secretion systems, and type IV pili, which are normally located in the outer membrane of Gram-negative bacteria (Korotkov et al., 2011). As well as inducing the Psp system, mislocalized secretins also kill a Y. enterocolitica psp null strain by causing profound cytoplasmic permeability (Horstman and Darwin, 2012). This is consistent with the contention that the Psp system mitigates stress that compromises cytoplasmic membrane function.
The Y. enterocolitica Psp system is encoded by the pspABCD-ycjXF operon, the divergently transcribed pspF gene, and one unlinked gene, pspG (Darwin and Miller, 2001, Green and Darwin, 2004). PspF, -A, -B and -C are considered the core components because they are well conserved and linked individually to robust phenotypes. All four are thought to function as a signal transduction system that controls psp gene expression. PspF is a DNA-binding protein that activates the σ54-dependent promoters upstream of pspA and pspG (Jovanovic et al., 1996, Green and Darwin, 2004). PspA inhibits PspF activity by forming a complex with it in the cytoplasm (e.g. Joly et al., 2009, Yamaguchi et al., 2010). Induction of psp gene expression requires the integral inner membrane proteins PspB and PspC that have been proposed to sense an inducing trigger and cause the relocation of PspA to the cytoplasmic membrane, freeing active PspF (e.g. Gueguen et al., 2009, Yamaguchi et al., 2010).
We provided the first support to the dynamic aspect of this regulatory model by using immunoblot analysis of subcellular fractions to reveal that an inducing stress causes endogenous Y. enterocolitica PspA to relocate from the cytoplasm to the inner membrane in a PspBC-dependent manner (Yamaguchi et al., 2010). This is consistent with the often-quoted hypothesis that PspA might switch its binding partner from PspF to PspB and/or PspC upon induction. However, although interactions of PspA with PspBC, and with PspF, have been demonstrated or inferred by various approaches (e.g. Dworkin et al., 2000, Elderkin et al., 2002, Adams et al., 2003, Joly et al., 2009, Jovanovic et al., 2010, Yamaguchi et al., 2010), they have never been shown to be variable depending on the induction status of the system.
To address this deficiency we have developed two complementary approaches to investigate the precise localization and binding-partner status of Y. enterocolitica Psp proteins produced at their native levels. First, we monitored fluorescently tagged PspA, -B, -C and -F proteins in intact cells. This revealed proteins with extremely discrete locations and striking differences in behavior +/− Psp system induction. This approach also supported co-localization of PspA, -B and -C when the system was induced. We have also developed a coimmunoprecipitation assay to show for the first time that PspA does indeed change its predominant binding partner from PspF to PspBC upon activation of the system.
Results
Construction and characterization of functional fluorescent Psp proteins
PspA changes its predominant location from the soluble (cytoplasm) to the insoluble (membrane) fraction when the Psp system is activated (Yamaguchi et al., 2010). To build on that conclusion we wanted more precise information about the location of Psp proteins within the cell. We also wanted to test the hypothesis that PspA relocalization involves switching binding partners from PspF in the cytoplasm of uninduced cells, to PspBC at the membrane of induced cells. To address these questions, we began by attempting to visualize fluorescent Psp fusion proteins encoded at their native chromosomal locus. For this, the pspF, pspA, pspB and pspC genes were replaced by versions encoding C-terminal GFP fusion proteins (the C-termini of the integral membrane proteins PspB and -C are located in the cytoplasm; Flores-Kim and Darwin, 2012). To maximize detection of proteins with low abundance (e.g. when the Psp system is not induced) we used GFP+ that has increased folding efficiency and fluorescence intensity in E. coli (Scholz et al., 2000). We also made strains producing PspA-mCherry, using an E. coli codon-optimized mCherry gene (Nilsen et al., 2005).
Immunoblotting detected fusion proteins of the expected size (Fig. 1A; there was some evidence of truncated proteins, but the majority was full-length). The PspA-, B- and C-derived protein levels were induced by weak (YscC) and strong (YsaC) secretin Psp-inducers (Fig.1A). This suggested they retained their Psp-regulatory functions, which was confirmed by monitoring Φ(pspA-lacZ) operon fusion expression (Fig.1B). Similarly, the PspF-GFP protein strain was not compromised for Φ(pspA-lacZ) expression. Some strains had different β-galactosidase activities from the wild type, but secretin-dependent induction was retained in all cases. It is possible that the truncated proteins were responsible for the Psp regulatory function, rather than the full-length fusion proteins. However, this is unlikely. For example, in uninduced cells with PspA-GFP and PspA-mCherry, Φ(pspA-lacZ) expression was almost identical to that in wild type cells, despite barely detectable truncated proteins. This suggests that the full length fusion proteins were primarily responsible for repressing Φ(pspA-lacZ) expression, which is the function of PspA in uninduced cells. Similarly, in uninduced cells, truncated PspB-GFP and PspC-GFP were undetectable and so far less abundant than wild type PspB/C (Fig. 1A). It is the basal levels of PspB and PspC that act as the regulatory trigger to activate Φ(pspA-lacZ) expression in response to secretin production (Yamaguchi et al., 2010). Therefore, it is unlikely that the truncated fusion proteins served that purpose.
Fig. 1.

Characterization of GFP and mCherry fusion protein strains
A. Immunoblots of whole cell lysates from strains containing tacp-yscC (YscC) or tacp-ysaC (YsaC) expression plasmids, or the empty tacp vector control (−). The polyclonal antiserum or monoclonal antibody used for each detection is shown above each image. Approximate positions of molecular mass marker proteins (kDa) are indicated to the right of each panel. The anti-PspF antiserum recognizes a number of cross-reactive proteins and so the locations of PspF and PspF-GFP are indicated by * and **, respectively.
B. Φ(pspA-lacZ) operon fusion expression. The strains used in panel A, which had a Φ(pspA-lacZ) operon fusion in their chromosomes, were grown and β-galactosidase activity determined as described in Experimental procedures. White bars = empty tacp vector control, gray bars = tacp-yscC, black bars = tacp-ysaC. Error bars indicate the positive standard deviations from the means. Each box represents a set of strains that were grown and assayed together. The Psp proteins present in each strain are indicated: wild type Psp proteins (WT), PspA-GFP (A-GFP), PspA-mCherry (A-mCherry), PspB-GFP (B-GFP), PspC-GFP (C-GFP) and PspF-GFP (F-GFP).
As expected, subcellular fractionation revealed that PspF-GFP was in the soluble fraction, whereas PspB-GFP and PspC-GFP were in the insoluble (membrane) fraction, regardless of the Psp system induction status (Fig. S1). PspA-GFP and PspA-mCherry behaved like wild type PspA, such that they were predominantly in the soluble fraction in non-inducing conditions, whereas most was in the insoluble fraction when the Psp system was induced (Fig. S1; Yamaguchi et al., 2010). Together, all of these data demonstrated that the fusion proteins behaved similarly to the wild type proteins, including retention of Psp system regulatory function.
PspA-GFP, PspB-GFP and PspC-GFP have striking differences in localization before and after activation of the Psp system
Strains producing individual GFP fusion proteins were grown in non-inducing, weakly inducing (+ YscC) or strongly inducing (+ YsaC) conditions. All had a Φ(pspA-lacZ) operon fusion and for each experiment culture samples were removed for β-galactosidase assays to confirm the induction status of the Psp system (data not shown, but Fig. 1 provides examples of expected activities that were used for reference). Highly inclined laser excitation microscopy was used to visualize the fusion proteins, which allows individual protein complexes to be resolved in live cells (Rothenberg et al., 2011). Representative images are shown in Figure 2 and wider field videos can be found in the supplementary material.
Fig. 2.

Localization of PspA-GFP, PspB-GFP, PspC-GFP, and PspF-GFP fusion proteins.
Highly inclined laser excitation microscopy images. Strains contained tacp-yscC (+ YscC) or tacp-ysaC (+ YsaC) expression plasmids, or the empty tacp vector control (Uninduced). GFP fluorescence is shown in green. FM 4-64 was used to stain the membrane and its fluorescence is shown in red. The images show the GFP fluorescence signal only (GFP) or an overlay of the GFP and FM 4-64 (GFP + FM 4-64). Images were generated from the raw data with ImageJ software. The white scale bar indicates 1 μm.
When the Psp system was uninduced, PspA-GFP and PspF-GFP appeared as somewhat diffuse foci throughout the cell (Fig. 2 and supplementary videos S1 and S4). The diffuse appearance of the foci did not arise from auto fluorescence because the fluorescence of cells without a GFP protein was below the detection limit (see Experimental procedures; data not shown). However, it may be attributed to high protein mobility (see below). Upon induction by either YscC or YsaC secretin production, the appearance of PspF-GFP was largely unchanged. However, PspA-GFP now predominantly formed bright foci, suggestive of larger oligomers, located at the cell periphery (Fig. 2). These observations are consistent with our previous conclusion that PspA changes its subcellular location upon induction of the Psp system, whereas PspF does not (Yamaguchi et al., 2010). Many induced cells had a single stationary bright PspA-GFP focus often located close to a cell pole, along with some dimmer foci elsewhere (Fig. 2 and supplementary video 6). This is consistent with observations of trc promoter expression plasmid encoded GFP-PspA in E. coli (Engl et al., 2009).
PspB-GFP and PspC-GFP also behaved differently depending on the induction status of the Psp system. In non-inducing conditions, there were numerous small foci distributed all over the membrane (membrane location was confirmed by subcellular fractionation; Fig. S1). Like PspA-GFP, this led to a somewhat diffuse appearance in single images (Fig. 2), which once again may be due to high mobility (see below). Upon induction, the proteins underwent reorganization and like PspA-GFP, we identified two types of foci. Brighter foci, suggestive of larger complexes, often located close to a cell pole and dim foci elsewhere (Fig. 2 and supplementary videos S9 and S12). The reorganization of PspB-GFP and PspC-GFP was more striking with the strong inducer YsaC than with the weaker inducer YscC.
Finally, it was important to ensure that the behavior of the fusion proteins was dependent on their Psp domains rather than GFP. For this we constructed a strain where the intact gfp gene was placed into the pspA operon immediately downstream of pspA. This meant that gfp expression was regulated like the fusion proteins (inducible by YscC and YsaC) but gfp was not fused to any gene. In these cells the fluorescence from GFP was uniform throughout the cell, regardless of the Psp system induction status (Fig. 2).
Mobility and distribution of PspA-GFP, PspB-GFP and PspC-GFP are reduced upon induction of the Psp system
The different localizations of PspA-GFP, PspB-GFP and PspC-GFP were most obvious when wider field videos were viewed. As mentioned above, all four of the GFP fusion proteins had a somewhat diffuse appearance of foci, which indicates high mobility in the single frame images that spanned approximately 30 milliseconds each (Fig. 2). In the case of PspF-GFP, this mobility was largely unaffected when the Psp system was induced by YscC or YsaC overproduction (supplementary videos S1–S3). However, induction reduced the overall mobility and distribution of PspA-GFP, PspB-GFP and PspC-GFP (supplementary videos S4–S12). Furthermore, at least in the case of PspB-GFP and PspC-GFP, the reduction in mobility/distribution depended on the amount of Psp system induction, such that the weaker inducer YscC reduced it, but to a lesser extent than the strong inducer YsaC (supplementary videos S8–S9 and S11–S12). In induced cells we also noticed that the brighter PspA-GFP, PspB-GFP and PspC-GFP foci, often located close to a pole, were essentially static, whereas dimmer foci at more lateral locations were still mobile. In fact, these lateral foci appeared to be similarly mobile to those in uninduced cells. However, they were far less numerous, which contributed to the overall reduction in protein mobility observed in induced cells in the videos. Therefore, it appears that PspA, -B and -C share several common behaviors upon induction of the Psp system: more organization into discrete locations, typically one single bright focus often close to a pole with dimmer foci elsewhere, and less overall mobile foci in the cell.
To further demonstrate the modes of motion exhibited by Psp protein complexes under the different conditions we generated kymographs from the continuous high frame-rate movies (see Experimental procedures). Kymographs have been used by others to show protein movements in bacteria (e.g. Garner et al., 2011). A kymograph is a two dimensional representation of the temporal evolution of the fluorescence intensity profile along a line, so that one dimension of the kymograph corresponds to the length-axial dependence of the intensity profile, whereas the other dimension shows the time dependence of the intensity profile. A line is drawn along one dimension of the cell, typically the long or short axis of the cell. The width of the line defines the region of integration (binning) along the other axial dimension taken here as 3 pixels (~ 240 nm). The resulting kymographs show visible intensity change events (with intensity higher than a threshold) that occurred along the specified kymograph line (white dotted line), such as a foci crossing the line or moving along the line, or just a stationary foci located anywhere along the line. As observed in the videos, in uninduced cells PspA-GFP, PspB-GFP, PspC-GFP and PspF-GFP displayed noticeable mobility (Fig. 3), where foci fuse, separate and go out of focus. The characteristic behavior of the larger PspA-GFP, PspB-GFP, PspC-GFP foci in induced cells was remarkably different (Fig. 3), displaying little to no movement within the kymograph timescale. The movement of PspF-GFP, on the other hand, did not appear to change before and after induction.
Fig. 3.

Kymographs showing the movements of PspA-GFP, PspB-GFP, PspC-GFP, and PspF-GFP fusion protein foci.
For each strain the left panel shows the cell from which kymographs were generated. The white dotted lines (3 pixels wide integration) indicate the axis along which the kymographs were generated, where (A) and (B) mark the long and short axis of the cell, respectively. Movements of foci are represented as the change in kymograph pattern over 3 sec. Strains contained tacpyscC (+ YscC) or tacp-ysaC (+ YsaC) expression plasmids, or the empty tacp vector control (Uninduced). The kymographs were constructed based on the motions of fluorescent proteins imaged as described (see text, supplementary videos 1–12). GFP fluorescence is shown in green. The outlines of cells were drawn based on FM 4-64 membrane stain and are shown in red. Images were generated from the raw data with ImageJ software. Scale bar indicates 0.3 μm.
PspA-mCherry colocalization with PspB-GFP and PspC-GFP when the Psp system is induced
We were also interested to investigate whether this approach could offer any support to the hypothesis that PspA changes its binding partner(s) when the Psp system is activated. For this, strains were constructed to produce PspA-mCherry together with PspF-GFP, PspB-GFP or PspC-GFP. Analysis of Φ(pspA-lacZ) expression suggested that it was compromised in these double fusion protein strains (Fig.1B). However, YscC- and YsaC-dependent induction was still retained to some extent and so we proceeded.
Fluorescence intensity of PspA-mCherry was lower than that of PspA-GFP, which made detection difficult, especially in cells with the Psp system uninduced. Therefore, we limited our co-localization studies to YsaC-induced cells. We immediately noticed that cells with the PspA-mCherry/PspB-GFP and PspA-mCherry/PspC-GFP combinations had bright mCherry and GFP foci that frequently appeared to be in similar locations. Furthermore, when the two signals were combined they often superimposed, which indicated colocalization (Fig. 4 has an example). In contrast, this was a rare occurrence for cells with the PspA-mCherry/PspF-GFP combination. Quantification (see Experimental procedures) revealed that over 90% of the PspA-mCherry/PspB-GFP cells, and also the PspA-mCherry/PspC-GFP cells, contained at least one focus where both proteins colocalized. In contrast, less than 10% of PspA-mCherry/PspF-GFP cells contained a focus where both fluorescence signals colocalized (Fig. 4).
Fig. 4.
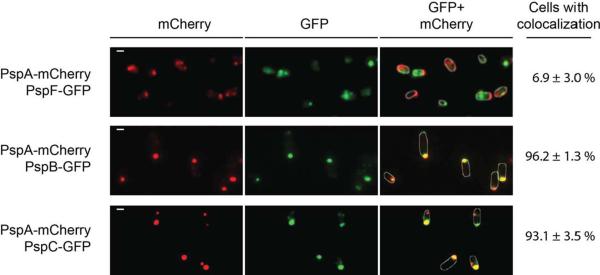
PspA-mCherry colocalizes with PspB-GFP and PspC-GFP, but not PspF-GFP, when the Psp system is induced. All strains contained a tacp-ysaC expression plasmid. GFP fluorescence is shown in green and mCherry fluorescence in red. The images show the mCherry fluorescence only (mCherry), the GFP fluorescence signal only (GFP) or an overlay of both (GFP + mCherry). Images were generated from the raw data with ImageJ software. The white scale bar indicates 1 μm. The percentage of cells with at least one co-localizing GFP and mCherry focus is shown on the right (determined as described in Experimental procedures). Cell edges are indicated by white lines that were drawn based on visible images of the same field.
These data support the hypothesis that when the Psp system is induced, PspA might predominantly interact with PspBC rather than with PspF. However, colocalization is not proof of interaction. This, coupled with our inability to extend this approach to uninduced cells, motivated us to develop an alternative but complementary assay to investigate the hypothesis of PspA switching its binding partners.
PspA changes its binding partner from PspF to PspBC when the Psp system is activated
Interactions between Psp proteins have been shown or inferred from various approaches (see Introduction). However, there has been no investigation into the dynamics of complexes formed between endogenously produced Psp proteins. Importantly, the long-held hypothesis that PspA changes its interaction partner from PspF to PspBC upon Psp system activation does not have any experimental evidence. Our colocalization study supports only part of this hypothesis, and provides only indirect evidence of protein complexes. Therefore, to complement the microscopy approach we next developed a PspA co-immunoprecipitation (co-IP) assay to isolate protein complexes from cells with Psp proteins produced and regulated endogenously. Endogenous production ensures normal regulation of the Psp system (furthermore, even a small artificial elevation in PspA concentration can affect its behavior; Yamaguchi et al., 2010).
To facilitate the co-IP, a sequence encoding the 3xFLAG epitope (hereafter referred to only as “FLAG”) was fused to the end of the chromosomal pspA gene. Analysis of Φ(pspA-lacZ) operon fusion expression showed that the FLAG tag did not compromise regulation of the Psp system (Fig. 5A). For the co-IP, the PspA-FLAG strain was grown with or without YsaC secretin production so that the Psp system would be induced or uninduced, respectively. To maximize the detection limit, cells were treated with formaldehyde to cross-link protein complexes, which also allowed the use of the denaturing detergent SDS to isolate membrane protein complexes efficiently (experiments without cross-linking and SDS yielded lower amounts of PspA-PspBC complex and made the PspA-PspF complex difficult to detect; data not shown). PspA-FLAG was then isolated from cell lysates by immunoprecipitation with anti-FLAG monoclonal antibody. Immunoprecipitates were separated by SDS-PAGE and detected by immunoblot with anti-Psp protein polyclonal antisera. The cytoplasmic RecA and inner membrane FtsH proteins served as negative controls. When the Psp system was uninduced, only PspF was co-immunoprecipitated with PspA-FLAG (Fig. 5B). However, in induced cells only a trace amount of PspF was detected in the immunoprecipitate, whereas PspB and PspC were now abundant. The control proteins RecA and FtsH did not co-IP with PspA-FLAG in either condition, indicating that the complexes were specific. Finally, when the experiment was repeated in a strain where PspA was not FLAG-tagged, no Psp proteins were present in the immunoprecipitates (Fig. 5B).
Fig. 5.
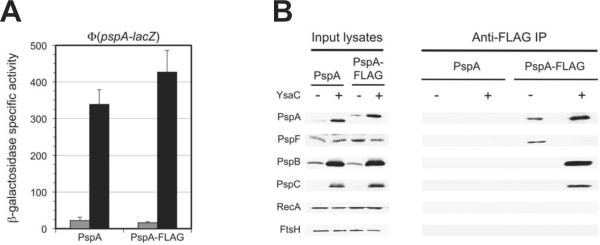
PspA changes its binding partner from PspF to PspBC when the Psp system is activated.
A. Φ(pspA-lacZ) operon fusion expression. Strains with wild type PspA, or PspA with a C-terminal 3xFLAG epitope tag (PspA-FLAG), and a Φ(pspA-lacZ) operon fusion were grown and β-galactosidase activity determined as described in Experimental procedures. Gray bars = empty tacp vector control, black bars = tacp-ysaC. Error bars indicate the positive standard deviations from the means.
B. Immunoblot analysis of input lysates and co-immunoprecipitates (Anti-FLAG IP) derived from the strains used in panel A. The polyclonal antiserum used for each detection is shown at the left.
These data support the hypotheses that PspA forms a complex with PspF when the Psp system is uninduced and that much of this complex dissociates upon induction. Unlike PspA, -B and -C, the concentration of PspF is similar in uninduced and induced cells (e.g. Fig. 5B input samples), which emphasizes the significance of the reduced amount of PspF in the immunoprecipitate from induced cells. Induction also coincides with the formation of a PspABC complex (Fig. 5B). However, one caveat is that the PspB and -C concentrations are much higher in induced cells. Of course, this is a normal feature of the native Psp system. Nevertheless, in the next experiment we addressed whether the formation of a PspABC complex was driven only by their increased concentrations.
Alteration in Psp protein concentrations is not required for PspA to change its binding partners
To address the role of changes in Psp protein concentrations, we took advantage of a strain with the chromosomal pspA operon controlled by the tacp promoter, as described previously (Yamaguchi et al., 2010, Horstman and Darwin, 2012). Without IPTG, leaky expression from the tac promoter leads to levels of PspA, -B and -C slightly higher than their normal basal levels in an uninduced wild type strain, but which still function as a regulatory trigger to activate Φ(pspA-lacZ) expression. However, tacp-controlled expression means that PspA, -B and -C levels remain constant regardless of the Psp system induction status. For the co-IP, this strain contained an araBp-ysaC expression plasmid, or the empty vector control, and Φ(pspA-lacZ) expression was used to confirm YsaC-dependent induction of the wild type pspA promoter (Fig. 6). The co-IP revealed the same conclusion as that from the wild type strain, with a predominantly PspA-PspF coimmunoprecipitate in uninduced cells and PspA-PspBC in induced cells (Fig. 6). However, the amount of the Psp proteins was similar in the input samples regardless of the induction status. Therefore, the change in the PspA protein complexes can occur independently from changes in Psp protein concentrations.
Fig. 6.
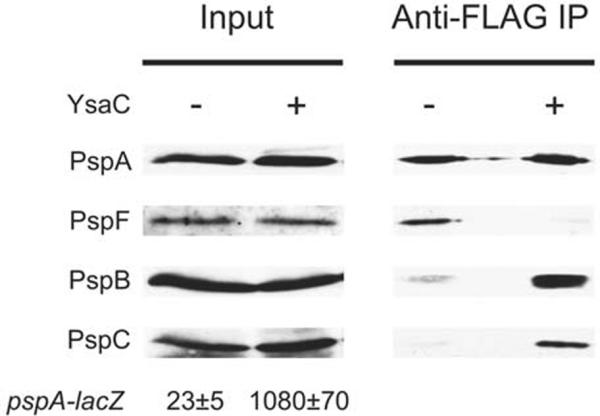
Alteration in Psp protein concentrations is not required for PspA to change its binding partners. Immunoblot analysis of input lysates and co-immunoprecipitates (Anti-FLAG IP) derived from a strain with the chromosomal pspA operon encoding PspA-FLAG and controlled by the tac promoter. The strain contained an araBp-ysaC expression plasmid (+) or the araBp empty vector control (−). The polyclonal antiserum used for each detection is shown at the left. β-galactosidase activity from the Φ(pspA-lacZ) operon fusion of each strain is shown below the immunoblot of the input lysates (Miller units ± standard deviation).
Dissociation of the PspA-PspF complex is PspBC-dependent
PspB and PspC are inner membrane proteins thought to sense envelope stress and trigger activation of the Psp system and re-localization of PspA to the membrane. Therefore, when an inducing signal is encountered PspBC should be necessary for PspA-PspF complex dissociation. To test this, we repeated the co-IP in pspBC+ and ΔpspBC strains. However, as secretin production is toxic in the absence of PspBC (e.g. Horstman and Darwin, 2012), we used overproduction of the inner membrane protein YE0566 as a Psp-inducer. YE0566 is a specific inducer of the Psp system that is not toxic to a psp null strain (Maxson and Darwin, 2004). The co-IP with the pspBC+ strain gave an essentially identical result as when YsaC was used as the inducer, with an apparent PspA-PspF complex being replaced by PspA-PspBC upon induction (Fig.6A). In the ΔpspBC strain, YE0566 overproduction did not induce Φ(pspA-lacZ), as expected, and it also failed to reduce the amount of PspF in the immunoprecipitate. Therefore, PspBC play a role in triggering dissociation of a PspA-PspF complex.
Previous work has shown that artificially elevating the PspBC concentration activates the Psp system, and causes re-localization of PspA to the inner membrane, even in the absence of a Psp system inducer (Maxson and Darwin, 2006, Yamaguchi et al., 2010). Therefore, PspBC overproduction should also dissociate the PspA-PspF complex in the absence of an inducing trigger. To test this, we overproduced PspBC using a rhaB-pspBC expression plasmid and various concentrations of rhamnose. As the rhamnose concentration was increased, Φ(pspA-lacZ) expression also increased, and the amount of PspF co-immunoprecipitated with PspA-FLAG decreased (Fig. 7B). In fact, it appeared that the higher the level of Φ(pspA-lacZ) expression, the lower the amount of PspA-PspF complex, which is consistent with pspA promoter expression being dependent on the amount of free PspF. Therefore, even in the absence of a normal Psp-inducing stress, PspBC overproduction is sufficient to cause dissociation of the PspA-PspF complex. They might do this by sequestering PspA away from PspF, and indeed when their concentration was elevated they formed an apparent complex with PspA (Fig. 7B). However, less straightforward explanations are also possible (see Discussion). Finally, overproduction of PspB or PspC only in the ΔpspBC strain did not induce Φ(pspA-lacZ) expression, even in the presence of YsaC (data not shown), and so we did not extend the co-IP experiments to test the effect of producing these proteins individually.
Fig. 7.
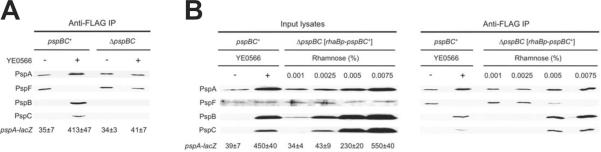
Dissociation of the PspA-PspF complex is PspBC-dependent.
A. Immunoblot analysis of co-immunoprecipitates from pspBC+ and ΔpspBC PspA-FLAG strains containing a tacp-YE0566 expression plasmid (+) or the tacp empty vector control (−). The polyclonal antiserum used for each detection is shown at the left. β-galactosidase activity from the Φ(pspA-lacZ) operon fusion of each strain is shown at the bottom (Miller units ± standard deviation).
B. Overproduction of PspBC dissociates the PspA-PspF complex. Immunoblot analysis of input lysates and co-immunoprecipitates from pspBC+ and ΔpspBC PspA-FLAG strains. The pspBC+ strain contained a tacp-YE0566 expression plasmid (+) or the tacp empty vector control (−). The ΔpspBC strain contained only a rhaBp-pspBC expression plasmid and was grown in medium containing the indicated concentration of L(+)-Rhamnose. The polyclonal antiserum used for each detection is shown at the left. β-galactosidase activity from the Φ(pspA-lacZ) operon fusion of each strain is shown below the immunoblot of the input lysates (Miller units ± standard deviation).
Effect of altered regulatory function mutations on PspA protein complexes
Our data have provided the first support to the model that activation of the Psp system involves a switch in PspA binding partners from PspF to PspBC. According to this model, co-IP experiments have clearly predictable outcomes in mutant strains where regulation of the Psp system is altered. Specifically, in strains where the Psp system is constitutively active, PspA-FLAG should co-IP with PspBC and not with PspF, regardless of the presence or absence of a Psp inducer. Conversely, in strains where the Psp system cannot be activated, PspA-FLAG should always co-IP with PspF and not with PspBC. We have reported the isolation of PspC altered function mutants that either constitutively activate, or fail to activate the Psp system, as well as PspA mutants that prevent activation (Gueguen et al., 2009, Yamaguchi et al., 2010). Derivatives of the PspA-FLAG strain were constructed that contained one of these mutations on the chromosome: PspC-ΔNterm and PspC-G45W, which constitutively activate Φ(pspA-lacZ) expression, along with PspC-V125D, PspA-N14D and PspA-L200S, in which activation is abolished.
Analysis of Φ(pspA-lacZ) expression by β-galactosidase assay confirmed that each mutation had the expected regulatory effect in the PspA-FLAG strain background (Fig. 8). In the co-IP experiments, all of these mutations caused the effects predicted by the PspA partner-switching model. First, with the PspC-ΔNterm and PspC-G45W mutants that constitutively induce the Psp system, PspA-FLAG always co-IP'd with PspBC and not PspF +/− YE0566 overproduction (Fig. 8A). Second, with the PspC-V125D, PspA-N14D and PspA-L200S mutants that fail to induce the Psp system, the PspA-PspF complex was not dissociated by YE0566 overproduction (Fig. 8B and 8C). Furthermore, only trace amounts of PspB, and no PspC, was detected in the immunoprecipitates regardless of whether or not YE0566 was overproduced.
Fig. 8.

Effect of altered regulatory function mutations on PspA protein complexes.
A. PspC mutants that constitutively activate the Psp system.
B. PspC mutants that cannot activate the Psp system.
C. PspA mutants that cannot activate the Psp system.
All panels show immunoblot analysis of co-immunoprecipitates from the indicated derivatives of a PspA-FLAG strain containing a tacp-YE0566 expression plasmid (+) or the tacp empty vector control (−). The polyclonal antiserum used for each detection is shown at the left. β-galactosidase activity from the Φ(pspA-lacZ) operon fusion of each strain is shown at the bottom (Miller units ± standard deviation).
The successful interrogation of the regulatory model with five different altered function mutations, in two different Psp proteins, further supports PspA binding partner-switching as a key feature during activation of the Psp response.
Discussion
One interesting feature of the Psp system is the events leading to increased expression of the genes that encode it, which involve the PspA, -B, -C and -F proteins. We have been motivated to develop approaches to study these proteins at their native levels, before and after induction of the Psp response. Our first advance was subcellular fractionation to reveal that the predominant location of endogenous PspA changes from cytoplasm to membrane upon induction (Yamaguchi et al., 2010). Here, we have developed new approaches to provide a much higher resolution description of the localization of the four core Psp proteins, as well as the first evidence of PspA binding-partner switching upon activation of the system.
This is the first report of fluorescent PspF, -B and -C proteins, but there was a study of GFP-PspA in E. coli (Engl et al., 2009). Our work used PspA-GFP encoded at the chromosomal pspA locus and both uninduced and induced cells. The E. coli work used GFP-PspA encoded by a plasmid with a non-native promoter. One consequence might be that our PspA-GFP was primarily in the soluble fraction in the absence of a Psp-inducing trigger whereas the E. coli GFP-PspA was distributed evenly between soluble and insoluble fractions (Fig. S1 and Engl et al., 2009). The artificially elevated level of GFP-PspA could have forced its membrane-association in non-inducing conditions, a phenomenon we have documented for PspA (Yamaguchi et al., 2010). Despite this, our conclusions about PspA localization after induction agreed with the localization of the plasmid-encoded E. coli GFP-PspA. Both reported bright foci often located close to a pole and dimmer foci at more lateral locations. However, our work revealed that PspA-GFP has a very different behavior in the absence of an inducing trigger.
The appearance of PspA-GFP was strikingly different in uninduced versus induced cells (Fig. 2 and supplementary videos S4–S6). In uninduced cells, it was organized into numerous small and highly mobile foci distributed widely. PspF-GFP had a similar appearance. However, upon induction the localization of PspA-GFP and PspF-GFP became very different. PspF-GFP was largely unchanged, whereas PspA-GFP was highly organized into discrete foci, often one bright stationary focus close to a pole and dim foci located elsewhere that were generally mobile. Of course, it is possible that the formation of discrete foci is an artifact of the fluorescent protein domains and we cannot rule that out. However, the formation of brighter stationary foci is consistent with larger PspA oligomers, and it has also been documented by others in vivo (Engl et al., 2009, Lenn et al., 2011). Furthermore, these differences between PspA-GFP and PspF-GFP upon induction are consistent with a change in the predominant subcellular location of PspA, but not PspF, after induction (Yamaguchi et al., 2010) and in their reduced interaction (this study). GFP-PspA in E. coli was also reported to form stationary foci at the pole and mobile foci along the lateral cell membrane (Engl et al., 2009). It was suggested that the stationary polar foci might be part of a regulatory complex (PspABC) involved in sensing stress to trigger activation of the system, However, we rarely observed the bright stationary foci in uninduced cells.
This is the first report visualizing fluorescent PspB and PspC proteins and it has revealed that these two integral membrane proteins share some common behaviors with PspA. In non-inducing conditions there were numerous highly mobile foci distributed widely (Fig. 2 and supplementary videos S7–S12). PspBC are believed to sense stress and trigger activation of the Psp system (e.g. Maxson and Darwin, 2006, Gueguen et al., 2009, Jovanovic et al., 2010). Therefore, it is tempting to speculate that in the uninduced cell they are rapidly scanning the membrane for an inducing event. However, after induction, PspB-GFP and PspC-GFP reorganized into fewer foci, with bright stationary foci often close to a pole and other dim mobile foci located elsewhere. Similar to PspA-GFP, the appearance of brighter, less mobile foci is suggestive of the formation of larger complexes upon induction.
After induction, PspB and PspC play a role in preventing mislocalized secretins from causing lethal cytoplasmic membrane permeability (Horstman and Darwin, 2012). Intriguingly, in a psp null strain YscC mislocalization causes a separation of cell envelope layers close to the pole of some cells (Horstman and Darwin, 2012). It has also been reported that the absence of the YscW pilot protein, which exacerbates YscC mislocalization and toxicity to a psp null strain (Darwin and Miller, 2001, Horstman and Darwin, 2012), causes YscC-mCherry to accumulate at the pole (Diepold et al., 2010). This raises the possibility that localization of PspB and PspC close to the pole is important for preventing the toxicity associated with a mislocalized secretin.
A proposed regulatory model describing activation of the Psp system is that PspA changes from an inhibitory interaction with PspF to an interaction with PspBC at the membrane of induced cells. The PspBC-dependent relocation of endogenous PspA from cytoplasm to membrane upon induction is consistent with this (Yamaguchi et al., 2010). Colocalization of PspA-mCherry with GFP-tagged PspB and PspC in induced cells provided indirect evidence of possible interaction (Fig. 4). To complement this microscopy approach, and provide further support to our hypothesis, we developed a co-IP assay to monitor PspA-containing complexes before and after induction. Using this assay, we established for the first time that a PspA-PspF complex dissociates upon induction, and that PspA then interacts with PspBC. Furthermore, this binding partner switch could occur even if Psp protein concentrations are held constant (Fig. 6). Therefore, it is not solely due to increased concentrations of Psp proteins. Instead, upon induction there is probably a change, such as a conformational change in PspB and/or -C, which allows them to sequester PspA from PspF.
The pivotal role of PspB and -C was demonstrated by their requirement for dissociation of the PspA-PspF complex in response to an inducing signal (Fig. 7A). Furthermore, overproduction of PspBC dissociated the PspA-PspF complex even in the absence of an inducing signal (Fig. 7B). Overproduction of PspBC also caused a PspABC complex to form, suggesting that artificially elevating their concentration simply causes them to sequester PspA away from PspF. In other words, even though a Psp-inducing trigger is absent and PspBC might be in an “off” state, raising their concentration compensates for the low affinity they might have for PspA in this “off” state. However, it is also possible that overproducing PspBC itself causes stress that generates a Psp-inducing signal and switches PspBC into their “on” state.
The behavior of PspC and PspA altered function mutants was also consistent with the PspA partner-switching model upon activation. An interesting finding from those experiments was that deletion of the PspC N-terminus, which constitutively activates the Psp response, caused PspABC complex formation as predicted. This reveals that the PspC N-terminus is not required for this complex and so probably not involved in binding to PspA directly.
Bringing all of our findings together validates and extends the regulatory switch model proposed previously (Yamaguchi et al., 2010 and Fig. 8). Basal levels of PspF, -A, -B and -C are poised to activate the Psp system if an inducing trigger is encountered. PspA has an inhibitory interaction with PspF in the cytoplasm and PspBC are in a hypothetical “off” state ready to detect an inducing event. Once this occurs, PspBC switch into their “on” state in which they bind PspA, releasing PspF to activate the pspA promoter. For the first time we provide evidence for the PspA partner switching part of this model. Furthermore, our observation of fluorescent proteins at the individual protein complex resolution level reveals that PspA, -B and -C share common behaviors. All are highly mobile in uninduced cells but appear to coalesce into stationary complexes upon induction. Much more work will be needed to understand the significance of this. However, the wide distribution and high mobility of PspBC in the uninduced cell might indicate that they are scanning the membrane for damage. Similarly, the motion of PspA in uninduced cells could indicate that it is shuttling between the cytoplasm and membrane, essentially sampling the state of PspBC to determine whether an inducing signal is present. We could not monitor co-localization in uninduced cells and do not know if it is a stable PspA-PspF complex that might shuttle between cytoplasm and membrane, with PspF being released when PspBC are in their “on” state. Alternatively, PspA could transiently interact with both PspF and PspBC in the uninduced cell, but with the equilibrium favoring the PspF interaction.
Experimental procedures
Bacterial strains, plasmids and routine growth conditions
Y. enterocolitica strains and plasmids are listed in Table 1. Primer sequences used in this study are listed in supplementary Table S1. The DNA sequence of all plasmid inserts generated by PCR was verified. Strains were grown in Luria-Bertani (LB) broth, or on LB agar plates (Miller, 1972) with appropriate antibiotics as described (Maxson and Darwin, 2004).
Table 1.
Strains and plasmids
| Name | Genotype/Features | Reference or Source |
|---|---|---|
| Y. enterocolitica strains | ||
| AJD3a | ΔyenR (R−M+) Nalr | Laboratory collection |
| AJD977 | ΔyenR (R−M+) ΔaraGFB∷[Φ(pspAp-lacZY)] | Maxson and Darwin, 2005 |
| AJD4513 | ΔyenR (R−M+) ΔaraGFB∷[Φ(pspAp-lacZY)] pspA-flagb | This study |
| AJD4612 | ΔyenR(R−M+)∷[pspF+] ΔaraGFB∷[Φ(pspAp-lacZY)] ΔpspF ΔpspAp∷[laclq-tacp] pspA-flag | This study |
| AJD4964 | ΔyenR (R−M+) ΔaraGFB∷[Φ(pspAp-lacZY)] pspA-flag ΔpspBC | This study |
| AJD4933 | ΔyenR (R−M+) ΔaraGFB∷[Φ(pspAp-lacZY)] pspA-flag pspC-G45W | This study |
| AJD4928 | ΔyenR(R−M+) ΔaraGFB∷[Φ(pspAp-lacZY)] pspA-flag ΔpspC-N term | This study |
| AJD4940 | ΔyenR (R−M+) ΔaraGFB∷[Φ(pspAp-lacZY)] pspA-flag pspC-V125D | This study |
| AJD4939 | ΔyenR (R−M+) ΔaraGFB∷[Φ(pspAp-lacZY)] pspA-N14D-flag | This study |
| AJD4949 | ΔyenR (R−M+) ΔaraGFB∷[Φ(pspAp-lacZY)] pspA-L200S-flag | This study |
| AJD2642 | ΔyenR (R−M+) ΔaraGFB∷[Φ(pspAp-lacZY)] pspA-gfp | This study |
| AJD2753 | ΔyenR (R−M+) ΔaraGFB∷[Φ(pspAp-lacZY)] pspF-gfp | This study |
| AJD4727 | ΔyenR (R−M+) ΔaraGFB∷[Φ(pspAp-lacZY)] pspA-mCherry | This study |
| AJD4743 | ΔyenR (R−M+) ΔaraGFB∷[Φ(pspAp-lacZY)] gfp immediately downstream of pspA | This study |
| AJD4792 | ΔyenR (R−M+) ΔaraGFB∷[Φ(pspAp-lacZY)] pspC-gfp | This study |
| AJD4795 | ΔyenR (R−M+) ΔaraGFB∷[Φ(pspAp-lacZY)] pspB-gfp | This study |
| AJD4828 | ΔyenR (R−M+) ΔaraGFB∷[Φ(pspAp-lacZY)] pspA-mCherry pspF-gfp | This study |
| AJD4829 | ΔyenR (R−M+) ΔaraGFB∷[Φ(pspAp-lacZY)] pspA-mCherry pspB-gfp | This study |
| AJD5002 | ΔyenR (R−M+) ΔaraGFB∷[Φ(pspAp-lacZY)] pspA-mCherry pspC-gfp | This study |
| Plasmids | ||
| pBAD33 | Cmr, p15A ori, araBp expression vector | Guzman et al., 1995 |
| pLG339 | Kmr Tcr, pSC101 ori | Stoker et al., 1982 |
| pMK10 | Kmr, ColE1 ori, E. coli codon-optimized mCherry gene | Nilsen et al., 2005 |
| pMN402 | Hygr, ColE1 ori, gfp+ gene | Scholz et al., 2000 |
| pRE112 | Cmr, R6K ori, mob+ (RP4), sacB+ | Edwards et al., 1998 |
| pSR47S | Kmr, R6K ori, mob+ (RP4), sacB+ | Merriam et al., 1997 |
| pVLT35 | Smr, Spr, RSF1010 ori, tacp expression vector | de Lorenzo et al., 1993 |
| PAJD126 | tacp-yscC in pVLT35 | Darwin and Miller, 2001 |
| pAJD555 | tacp-ysaC in pVLT35 | Maxson and Darwin, 2004 |
| pAJD634 | tacp-YE0566 in pVLT35 | Maxson and Darwin, 2004 |
| pAJD922 | araBp-ysaC in pBAD33 | Yamaguchi ef al.,2010 |
| pAJD2144 | Kmr, pSC101 ori, rhaBp expression vector | This study |
| pAJD2152 | rhaBp-pspBC in pAJD2144 | This study |
AJD3 is a virulence plasmid cured derivative of strain JB580v (Kinder et al., 1993). All other Y. enterocolitica strains listed are derivatives of AJD3.
flag: a region encoding the 3xFLAG epitope.
Construction of rhaBp expression plasmids
A rhamnose-inducible expression plasmid vector was made by amplifying a 2.1 kb rhaBp-rhaSR fragment from the E. coli MG1655 chromosome as described (Giacalone et al., 2006) except that the primers incorporated a XhoI site downstream of rhaR and the pUC18 multiple cloning region followed by a MfeI site downstream of rhaBp. This fragment was cloned into the large EcoRI-SalI digested fragment of plasmid pLG339 to make pAJD2144. A derivative of pAJD2144 encoding pspBC was made by ligating the SacI-XbaI pspBC+ fragment of pAJD1014 (Singh and Darwin, 2011) into the same restriction sites of pAJD2144.
Construction of strains producing Psp proteins fused to GFP/mCherry or PspA-3×FLAG
Two ~ 0.5 kb fragments surrounding the desired gfp or mCherry insertion site were amplified from the Y. enterocolitica chromosome (see Table S1 for primer details). The gfp+ or mCherry genes were amplified from pMN402 or pMK10, respectively. Appropriate fragments were designed to have ~ 20 bp identical ends and to incorporate a region encoding a flexible linker (G5 for PspA and PspF fusion proteins, GGAGGAGG for PspB and PspC fusion proteins) at the fusion junction between the Psp and GFP or mCherry domain. The three fragments were then joined in a PCR SOEing reaction via the overlapping ~ 20 bp identical ends (Heckman and Pease, 2007) and cloned into the sacB+ allelic exchange suicide plasmids pRE112 or pSR47s. These plasmids were then used to fuse gfp or mCherry to the native psp target gene by integration, selection for sucrose-resistant segregants and confirmation by colony PCR. A control strain with gfp+ placed immediately downstream of pspA, but not fused to it, was made similarly. In this case, a copy of the pspA ribosome-binding site was also incorporated upstream of gfp+ so that it would have both similar transcription (in the pspA operon) and translation signals as the PspA-GFP fusion.
For strains producing PspA-3×FLAG two ~ 0.5 kb fragments surrounding the pspA stop codon were amplified from the Y. enterocolitica chromosome. For each fragment one of the primers incorporated a region encoding a 3×FLAG epitope. The fragments were then joined in a PCR SOEing reaction via their overlapping 3×FLAG sequences to generate an ~ 1 kb fragment with the region encoding 3×FLAG inserted immediately upstream of the pspA stop codon. This fragment was cloned into plasmid pRE112 that was used to fuse the region encoding 3×FLAG to the native pspA gene as described above and confirmed by colony PCR.
Fluorescence microscopy and analysis
Strains producing GFP or mCherry fusion proteins were grown to saturation. They were then diluted to an optical density (OD) at 600 nm of 0.1 in 5 ml of medium in an 18 mm test tube and grown on a roller drum at 37°C for 2 h. Then 200 μM or 10 μM of IPTG (final concentration) was added to induce YscC or YsaC production, respectively. Growth continued at 37°C for another 2 h. Cells were harvested by centrifugation, washed once with phosphate buffered saline (PBS) and resuspended in PBS that in some cases also contained 1 μg ml−1 FM 4–64 membrane stain (Life Technologies corp.). Cells were attached to glass cover slips coated with 0.01% poly-D-lysine, and mounted onto a glass slide. A customized Leica DMI3000 microscope with oil immersion objective (100× NA1.46) and 2× magnifying tube was used to obtain the images. The 488 nm line of an air-cooled argon-ion laser, or a 594-mm orange laser, was used in highly inclined excitation mode to excite the GFP and FM 4–64, or mCherry, respectively. Appropriate EM filters and dichroic mirrors were used to capture the correct emission light (filters = 531/40 for GFP, 624/40 for mCherry, 685LP for FM 4–64; dichroic = Di01-R405/488/594-25×36 (Semrock) with a Leica DMI3000 filter cube (LDMK)). Fluorescence from bacterial cells was imaged using an iXon+ 897 EM-CCD camera (Andor Technology) with exposure time set to ~0.03 seconds per frame except for the PspA-mCherry/PspF-GFP colocalization experiment where it was set to ~0.06 seconds. For simultaneous two-color imaging a Dualview system (Dv2, Photometrics) was placed before the CCD camera, with an emission splitting cassette containing the appropriate imaging dichroic and emission filters. For accurate alignment and mapping the two color channels, we first imaged fluorescent beads (Invitrogen) having a wide emission spanning both channels, locations of the beads was matched in both channels and a mapping matrix was generated using IDL (Exelis) mapping routine. The mapping matrix was then used to superimpose the two colors into a two-color image. Images were then processed and analyzed using ImageJ software (http://rsbweb.nih.gov/ij/).
To determine whether auto fluorescence contributed to the diffuse GFP signals, strains producing either PspF-, PspA-, PspB- or PspC-GFP were mixed in a 1 to 1 ratio with the wild type strain that did not produce a GFP protein. The mixed cells were visualized as described above and in all four cases approximately half of the cells had a diffuse fluorescence emission level higher than that of the others (data not shown).
Kymographs were constructed from 3 sec videos (supplementary material), using the ImageJ Plugin, Multiplekymograph. Kymograph line width was set to 3 pixels. White dotted lines indicate the integrated regions used for kymograph formation. For PspA-GFP, PspB-GFP, and PspC-GFP uninduced cells and all the PspF-GFP cells, kymograph lines were placed so that long axis and short axis cross in the middle of the cell. For the rest of the cells, kymograph lines were drawn so that the two axes cross on the brightest foci of the cell. The x-axis of the kymograph indicates the cross section of the cells where motions were captured and the y-axis indicates the total time of the movie (3 sec). The scale of the images shown is 0.0813 μm/pixel. The contrast of the Kymograph was adjusted to reject out of focus fluorescence and show the motion of the brightest foci.
To quantify colocalization of PspA-mCherry with PspF-, PspB- or PspC-GFP, cells in which distinct mCherry foci could be detected were included. A cell was defined as positive for colocalization if there was at least one example where green and red foci superimposed when the two signals were combined, which manifested as a yellow/orange appearance and the individual green and red signals no longer being distinct. The average from three separate counts of 50 or more cells, derived from at least two independent experiments, was determined as the percentage of cells (of the total counted) with at least one colocalizing focus present.
Co-immunoprecipitation assay
Strains encoding PspA-3xFLAG and containing a tacp or arap expression plasmid were grown to saturation. They were then diluted to an OD at 600 nm of 0.1 in 50 ml of medium in a 250 ml flask and grown in a rotary shaker at 225 rpm and 37°C for 2 h. Then 10 μM IPTG or 0.02% arabinose (final concentration) was added. Growth continued at 37°C for another 2 h. ~ 2×10¹⁰ cfu were collected by centrifugation and washed with 0.01 M potassium phosphate buffer pH 6.8 (KP). Cells were resuspended in KP so that the OD 600 nm was ~1. Proteins were cross-linked by adding formaldehyde to a final concentration of 1% v/v and incubating for 30 min at room temperature followed by quenching with 0.3 M Tris-HCl pH 7.5 (final concentration). Cells were washed once with 20 mM Tris-HCl pH 7.5 and stored overnight at −20°C. Cells were then washed twice with PBS and denatured by resuspending in 1% (w/v) SDS, 50 mM Tris-HCl pH 7.5, 5 mM EDTA, 10 mM DTT, 1× Roche complete protease inhibitor cocktail, 10 U ml−1 DNase I and rotating for 30 min at 37°C. The suspension was diluted 10-fold in non-denaturing buffer (1% (v/v) Triton X-100, 50 mM Tris-HCl pH 7.5, 300 mM NaCl, 5mM EDTA, 1× Roche complete protease inhibitor cocktail) to sequester the SDS. The samples were then rotated for 2 h at room temperature and unlysed cells were removed by centrifugation. 1.4 ml of the lysate was pre-cleared by adding 30 μl of 50% protein A-sepharose slurry equilibrated in PBS, rotating for 30 min at 4°C and then removing the protein A-sepharose by centrifugation.
A protein A-sepharose-antibody complex was made by mixing 60 μl of 50% protein A-sepharose slurry per 1 μl anti-FLAG M2 monoclonal antibody (Agilent Technologies) and rotating for 3 h at 4°C. The complex was washed twice with non-denaturing buffer and then resuspended in non-denaturing buffer to restore the original 50% slurry concentration. 60 μl of this protein A-sepharose-antibody complex was added to 1.3 ml of the pre-cleared lysate and rotated overnight at 4°C. The immunoprecipitate was collected by centrifugation, washed twice with non-denaturing buffer, twice with PBS containing 0.1% (v/v) Triton X-100 and then resuspended in SDS-PAGE sample buffer and heated at ~ 90°C for 10 min. Proteins were separated by SDS-PAGE and detected by immunoblotting.
Polyclonal antisera and immunoblotting
Proteins were separated by SDS-PAGE and transferred to nitrocellulose membranes by semi-dry electroblotting. Enhanced chemiluminescent detection followed incubation with a diluted polyclonal antiserum or monoclonal antibody followed by goat α-rabbit IgG or goat α-mouse IgG horseradish peroxidase conjugate (Bio-Rad). Dilutions of polyclonal antisera were 1 in 5,000 for anti-PspF, anti-FtsH (Yamaguchi et al., 2010) and anti-RecA (Thermo Scientific), 1 in 10,000 for anti-PspA (Yamaguchi et al., 2010), anti-PspB (Gueguen et al., 2009) and anti-PspC (Maxson and Darwin, 2006). Anti-DnaK monoclonal antibody (Assay Designs) was used at 1 in 2,000 dilution, anti-GFP monoclonal antibody (Roche) at 1 in 2,000–5,000 and anti-mCherry monoclonal antibody (Novus Biologicals) at 1 in 2,000.
β-galactosidase assays
To test the regulatory function of Psp-GFP/mCherry and PspA-3xFLAG fusion proteins, saturated cultures were diluted into 5 ml of LB broth in 18-mm-diameter test tubes to an optical density (600 nm) of 0.1. The cultures were grown on a roller drum at 37°C for 2 h. Then 200 μM or 10 μM IPTG (final concentration) was added to induce YscC, or YsaC, respectively. Cells were grown for another 2 h at 37°C prior to harvest. β-galactosidase enzyme activity was determined at room temperature in permeabilized cells as described previously (Maloy et al., 1996). Activities are expressed in arbitrary Miller units (Miller, 1972) and are the mean determined from at least three independent cultures, each of which was assayed in duplicate. For the co-immunoprecipitation experiments samples were taken directly from the cultures prior to harvesting and assayed in triplicate.
Subcellular fractionation
Subcellular fractionation was done exactly as described previously (Yamaguchi et al., 2010).
Supplementary Material
Fig. 9.

PspA partner switching model for activation of the Psp response by the basal levels of PspF, -A, -B and -C. In the absence of an inducing trigger (“Uninduced”) PspBC are highly mobile, perhaps scanning the membrane for damage. PspA is also mobile, possibly shuttling between the cytoplasm and membrane to sample the state of PspBC. This could involve the shuttling of a PspA-PspF complex, as shown. Alternatively, PspA could form transient interactions with PspF and PspBC in the uninduced cell, but with the equilibrium heavily favoring the cytoplasmic PspA-PspF complex. An inducing trigger (wavy arrow) switches PspBC to an “on” state, causing PspA to form a stable interaction with them and release PspF to induce psp gene expression.
Acknowledgements
We thank Heran Darwin for supplying us with the gfp+-encoding plasmid pMN402, Marcia Goldberg for providing the mCherry-encoding plasmid pMK10, and Sindhoora Singh for constructing plasmids pAJD2144 and pAJD2152. We are grateful to Patrick Eichenberger for his early encouragement and assistance with fluorescent microscopy. This study was supported by Award Number R01AI052148 from the National Institute of Allergy and Infectious Diseases (NIAID) to AJD. The content is solely the responsibility of the authors and does not necessarily represent the official views of the NIAID or the National Institutes of Health. AJD holds an Investigators in Pathogenesis of Infectious Disease Award from the Burroughs Wellcome Fund.
References
- Adams H, Teertstra W, Demmers J, Boesten R, Tommassen J. Interactions between phage-shock proteins in Escherichia coli. J Bacteriol. 2003;185:1174–1180. doi: 10.1128/JB.185.4.1174-1180.2003. [DOI] [PMC free article] [PubMed] [Google Scholar]
- Beloin C, Valle J, Latour-Lambert P, Faure P, Kzreminski M, Balestrino D, et al. Global impact of mature biofilm lifestyle on Escherichia coli K-12 gene expression. Mol Microbiol. 2004;51:659–674. doi: 10.1046/j.1365-2958.2003.03865.x. [DOI] [PubMed] [Google Scholar]
- Darwin AJ, Miller VL. The psp locus of Yersinia enterocolitica is required for virulence and for growth in vitro when the Ysc type III secretion system is produced. Mol Microbiol. 2001;39:429–444. doi: 10.1046/j.1365-2958.2001.02235.x. [DOI] [PubMed] [Google Scholar]
- Darwin AJ. The phage-shock-protein response. Mol Microbiol. 2005;57:621–628. doi: 10.1111/j.1365-2958.2005.04694.x. [DOI] [PubMed] [Google Scholar]
- de Lorenzo V, Eltis L, Kessler B, Timmis KN. Analysis of Pseudomonas gene products using lacIq/Ptrp-lac plasmids and transposons that confer conditional phenotypes. Gene. 1993;123:17–24. doi: 10.1016/0378-1119(93)90533-9. [DOI] [PubMed] [Google Scholar]
- Diepold A, Amstutz M, Abel S, Sorg I, Jenal U, Cornelis GR. Deciphering the assembly of the Yersinia type III secretion injectisome. EMBO J. 2010;29:1928–1940. doi: 10.1038/emboj.2010.84. [DOI] [PMC free article] [PubMed] [Google Scholar]
- Dworkin J, Jovanovic G, Model P. The PspA protein of Escherichia coli is a negative regulator of σ54-dependent transcription. J Bacteriol. 2000;182:311–319. doi: 10.1128/jb.182.2.311-319.2000. [DOI] [PMC free article] [PubMed] [Google Scholar]
- Edwards RA, Keller LH, Schifferli DM. Improved allelic exchange vectors and their use to analyze 987P fimbria gene expression. Gene. 1998;207:149–157. doi: 10.1016/s0378-1119(97)00619-7. [DOI] [PubMed] [Google Scholar]
- Elderkin S, Jones S, Schumacher J, Studholme D, Buck M. Mechanism of action of the Escherichia coli phage shock protein PspA in repression of the AAA family transcription factor PspF. J Mol Biol. 2002;320:23–37. doi: 10.1016/S0022-2836(02)00404-7. [DOI] [PubMed] [Google Scholar]
- Engl C, Jovanovic G, Lloyd LJ, Murray H, Spitaler M, Ying L, et al. In vivo localizations of membrane stress controllers PspA and PspG in Escherichia coli. Mol Microbiol. 2009;73:382–396. doi: 10.1111/j.1365-2958.2009.06776.x. [DOI] [PMC free article] [PubMed] [Google Scholar]
- Engl C, Beek AT, Bekker M, de Mattos JT, Jovanovic G, Buck M. Dissipation of proton motive force is not sufficient to induce the phage shock protein response in Escherichia coli. Curr Microbiol. 2011;62:1374–1385. doi: 10.1007/s00284-011-9869-5. [DOI] [PMC free article] [PubMed] [Google Scholar]
- Eriksson S, Lucchini S, Thompson A, Rhen M, Hinton JC. Unravelling the biology of macrophage infection by gene expression profiling of intracellular Salmonella enterica. Mol Microbiol. 2003;47:103–118. doi: 10.1046/j.1365-2958.2003.03313.x. [DOI] [PubMed] [Google Scholar]
- Flores-Kim J, Darwin AJ. Phage shock protein C (PspC) of Yersinia enterocolitica is a polytopic membrane protein with implications for regulation of the Psp stress response. J Bacteriol. 2012;194:6548–6559. doi: 10.1128/JB.01250-12. [DOI] [PMC free article] [PubMed] [Google Scholar]
- Garner EC, Bernard R, Wang W, Zhuang X, Rudner DZ, Mitchison T. Coupled, circumferential motions of the cell wall synthesis machinery and MreB filaments in B. subtilis. Science. 2011;333:222–225. doi: 10.1126/science.1203285. [DOI] [PMC free article] [PubMed] [Google Scholar]
- Giacalone MJ, Gentile AM, Lovitt BT, Berkley NL, Gunderson CW, Surber MW. Toxic protein expression in Escherichia coli using a rhamnose-based tightly regulated and tunable promoter system. Biotechniques. 2006;40:355–364. doi: 10.2144/000112112. [DOI] [PubMed] [Google Scholar]
- Green RC, Darwin AJ. PspG, a new member of the Yersinia enterocolitica phage shock protein regulon. J Bacteriol. 2004;186:4910–4920. doi: 10.1128/JB.186.15.4910-4920.2004. [DOI] [PMC free article] [PubMed] [Google Scholar]
- Gueguen E, Savitzky DC, Darwin AJ. Analysis of the Yersinia enterocolitica PspBC proteins defines functional domains, essential amino acids and new roles within the phage-shock-protein response. Mol Microbiol. 2009;74:619–633. doi: 10.1111/j.1365-2958.2009.06885.x. [DOI] [PMC free article] [PubMed] [Google Scholar]
- Guilvout I, Chami M, Engel A, Pugsley AP, Bayan N. Bacterial outer membrane secretin PulD assembles and inserts into the inner membrane in the absence of its pilotin. EMBO J. 2006;25:5241–5249. doi: 10.1038/sj.emboj.7601402. [DOI] [PMC free article] [PubMed] [Google Scholar]
- Guzman L, Belin D, Carson MJ, Beckwith J. Tight regulation, modulation, and high-level expression by vectors containing the arabinose PBAD promoter. J Bacteriol. 1995;177:4121–4130. doi: 10.1128/jb.177.14.4121-4130.1995. [DOI] [PMC free article] [PubMed] [Google Scholar]
- Heckman KL, Pease LR. Gene splicing and mutagenesis by PCR-driven overlap extension. Nat Protoc. 2007;2:924–932. doi: 10.1038/nprot.2007.132. [DOI] [PubMed] [Google Scholar]
- Horstman NK, Darwin AJ. Phage shock proteins B and C prevent lethal cytoplasmic membrane permeability in Yersinia enterocolitica. Mol Microbiol. 2012;85:445–460. doi: 10.1111/j.1365-2958.2012.08120.x. [DOI] [PMC free article] [PubMed] [Google Scholar]
- Joly N, Burrows PC, Engl C, Jovanovic G, Buck M. A lower-order oligomer form of phage shock protein A (PspA) stably associates with the hexameric AAA(+) transcription activator protein PspF for negative regulation. J Mol Biol. 2009;394:764–775. doi: 10.1016/j.jmb.2009.09.055. [DOI] [PMC free article] [PubMed] [Google Scholar]
- Joly N, Engl C, Jovanovic G, Huvet M, Toni T, Sheng X, et al. Managing membrane stress: the phage shock protein (Psp) response, from molecular mechanisms to physiology. FEMS Microbiol Rev. 2010;34:797–827. doi: 10.1111/j.1574-6976.2010.00240.x. [DOI] [PubMed] [Google Scholar]
- Jovanovic G, Weiner L, Model P. Identification, nucleotide sequence, and characterization of PspF, the transcriptional activator of the Escherichia coli stress-induced psp operon. J Bacteriol. 1996;178:1936–1945. doi: 10.1128/jb.178.7.1936-1945.1996. [DOI] [PMC free article] [PubMed] [Google Scholar]
- Jovanovic G, Engl C, Mayhew AJ, Burrows PC, Buck M. Properties of the phage-shock-protein (Psp) regulatory complex that govern signal transduction and induction of the Psp response in Escherichia coli. Microbiology. 2010;156:2920–2932. doi: 10.1099/mic.0.040055-0. [DOI] [PMC free article] [PubMed] [Google Scholar]
- Karlinsey JE, Maguire ME, Becker LA, Crouch ML, Fang FC. The phage shock protein PspA facilitates divalent metal transport and is required for virulence of Salmonella enterica sv. Typhimurium. Mol Microbiol. 2010;78:669–685. doi: 10.1111/j.1365-2958.2010.07357.x. [DOI] [PMC free article] [PubMed] [Google Scholar]
- Kinder SA, Badger JL, Bryant GO, Pepe JC, Miller VL. Cloning of the YenI restriction endonuclease and methyltransferase from Yersinia enterocolitica serotype O:8 and construction of a transformable R−M+ mutant. Gene. 1993;136:271–275. doi: 10.1016/0378-1119(93)90478-l. [DOI] [PubMed] [Google Scholar]
- Korotkov KV, Gonen T, Hol WG. Secretins: dynamic channels for protein transport across membranes. Trends Biochem Sci. 2011;36:433–443. doi: 10.1016/j.tibs.2011.04.002. [DOI] [PMC free article] [PubMed] [Google Scholar]
- Lenn T, Gkekas CN, Bernard L, Engl C, Jovanovic G, Buck M, Ying L. Measuring the stoichiometry of functional PspA complexes in living bacterial cells by single molecule photobleaching. Chem Commun (Camb) 2011;47:400–402. doi: 10.1039/c0cc01707h. [DOI] [PMC free article] [PubMed] [Google Scholar]
- Lloyd LJ, Jones SE, Jovanovic G, Gyaneshwar P, Rolfe MD, Thompson A, et al. Identification of a new member of the phage shock protein response in Escherichia coli, the phage shock protein G (PspG) J Biol Chem. 2004;279:55707–55714. doi: 10.1074/jbc.M408994200. [DOI] [PubMed] [Google Scholar]
- Lucchini S, Liu H, Jin Q, Hinton JCD, Yu J. Transcriptional adaptation of Shigella flexneri during infection of macrophages and epithelial cells: Insights into the strategies of a cytosolic bacterial pathogen. Infect Immun. 2005;73:88–102. doi: 10.1128/IAI.73.1.88-102.2005. [DOI] [PMC free article] [PubMed] [Google Scholar]
- Maloy SR, Stewart VJ, Taylor RK. Genetic analysis of pathogenic bacteria. Cold Spring Harbor Laboratory Press; Plainview, NY: 1996. [Google Scholar]
- Maxson ME, Darwin AJ. Identification of inducers of the Yersinia enterocolitica phage shock protein system and comparison to the regulation of the RpoE and Cpx extracytoplasmic stress responses. J Bacteriol. 2004;186:4199–4208. doi: 10.1128/JB.186.13.4199-4208.2004. [DOI] [PMC free article] [PubMed] [Google Scholar]
- Maxson ME, Darwin AJ. Improved system for construction and analysis of single-copy β-galactosidase operon fusions in Yersinia enterocolitica. Appl Environ Microbiol. 2005;71:5614–5618. doi: 10.1128/AEM.71.9.5614-5618.2005. [DOI] [PMC free article] [PubMed] [Google Scholar]
- Maxson ME, Darwin AJ. PspB and PspC of Yersinia enterocolitica are dual function proteins: regulators and effectors of the phage-shock-protein response. Mol Microbiol. 2006;59:1610–1623. doi: 10.1111/j.1365-2958.2006.05047.x. [DOI] [PubMed] [Google Scholar]
- Merriam JJ, Mathur R, Maxfield-Boumil R, Isberg RR. Analysis of the Legionella pneumophila fliI gene: intracellular growth of a defined mutant defective for flagellum biosynthesis. Infect Immun. 1997;65:2497–2501. doi: 10.1128/iai.65.6.2497-2501.1997. [DOI] [PMC free article] [PubMed] [Google Scholar]
- Miller JH. Experiments in molecular genetics. Cold Spring Harbor Laboratory; Cold Spring Harbor, New York: 1972. [Google Scholar]
- Model P, Jovanovic G, Dworkin J. The Escherichia coli phage-shock-protein (psp) operon. Mol Microbiol. 1997;24:255–261. doi: 10.1046/j.1365-2958.1997.3481712.x. [DOI] [PubMed] [Google Scholar]
- Nilsen T, Yan AW, Gale G, Goldberg MB. Presence of multiple sites containing polar material in spherical Escherichia coli cells that lack MreB. J Bacteriol. 2005;187:6187–6196. doi: 10.1128/JB.187.17.6187-6196.2005. [DOI] [PMC free article] [PubMed] [Google Scholar]
- Rothenberg E, Sepulveda LA, Skinner SO, Zeng L, Selvin PR, Golding I. Single-virus tracking reveals a spatial receptor-dependent search mechanism. Biophys J. 2011;100:2875–2882. doi: 10.1016/j.bpj.2011.05.014. [DOI] [PMC free article] [PubMed] [Google Scholar]
- Scholz O, Thiel A, Hillen W, Niederweis M. Quantitative analysis of gene expression with an improved green fluorescent protein. Eur J Biochem. 2000;267:1565–1570. doi: 10.1046/j.1432-1327.2000.01170.x. [DOI] [PubMed] [Google Scholar]
- Seo J, Savitzky DC, Ford E, Darwin AJ. Global analysis of tolerance to secretin-induced stress in Yersinia enterocolitica suggests that the phage-shock-protein system may be a remarkably self-contained stress response. Mol Microbiol. 2007;65:714–727. doi: 10.1111/j.1365-2958.2007.05821.x. [DOI] [PubMed] [Google Scholar]
- Singh S, Darwin AJ. FtsH-dependent degradation of phage shock protein C in Yersinia enterocolitica and Escherichia coli. J Bacteriol. 2011;193:6436–6442. doi: 10.1128/JB.05942-11. [DOI] [PMC free article] [PubMed] [Google Scholar]
- Stoker NG, Fairweather NF, Spratt BG. Versatile low-copy-number plasmid vectors for cloning in Escherichia coli. Gene. 1982;18:335–341. doi: 10.1016/0378-1119(82)90172-x. [DOI] [PubMed] [Google Scholar]
- Vega NM, Allison KR, Khalil AS, Collins JJ. Signaling-mediated bacterial persister formation. Nat Chem Biol. 2012;8:431–433. doi: 10.1038/nchembio.915. [DOI] [PMC free article] [PubMed] [Google Scholar]
- Yamaguchi S, Gueguen E, Horstman NK, Darwin AJ. Membrane association of PspA depends on activation of the phage-shock-protein response in Yersinia enterocolitica. Mol Microbiol. 2010;78:429–443. doi: 10.1111/j.1365-2958.2010.07344.x. [DOI] [PMC free article] [PubMed] [Google Scholar]
- Yamaguchi S, Darwin AJ. Recent findings about the Yersinia enterocolitica phage shock protein response. J Microbiol. 2012;50:1–7. doi: 10.1007/s12275-012-1578-7. [DOI] [PMC free article] [PubMed] [Google Scholar]
Associated Data
This section collects any data citations, data availability statements, or supplementary materials included in this article.