Abstract
Contrast enhanced magnetic resonance angiography (CE-MRA) is challenging due to the need for both high spatial and temporal resolution. A multi-shot trajectory composed of pseudo-random rotations of a single multi-echo radial readout was developed. The trajectory is designed to give incoherent aliasing artifacts and a relatively uniform distribution of projections over all time scales. A field map (computed from the same data set) is used to avoid signal dropout in regions of substantial field inhomogeneity. A compressed sensing reconstruction using the GraDeS algorithm was employed. Whole brain angiograms were reconstructed at 1 mm isotropic resolution and a 1.1 s frame rate (corresponding to an acceleration factor > 100). The only parameter which must be chosen is the number of iterations of the GraDeS algorithm. A larger number of iterations improves the temporal behavior at cost of decreased image signal to noise ratio. The resulting images provide a good depiction of the cerebral vasculature and have excellent arterial/venous separation.
Keywords: 4D contrast enhanced angiography, Time-resolved angiography, GraDeS, compressed sensing
Introduction
Contrast-enhanced magnetic resonance angiography (CE-MRA) captures the enhancement of vessels during the first pass of a contrast agent. CE-MRA acquisitions are challenging because they require high spatial resolution images to be formed in a short time so that the arterial and venous phases of the contrast arrival can be clearly distinguished.
A wide variety of methods to accelerate time-resolved MR image acquisitions have been proposed. Temporal undersampling approaches where some k-space lines are shared across time frames include sliding window [1] and keyhole [2]. Image acceleration can also be achieved by undersampling the spatial frequency space (k-space) acquired in each frame by partial Fourier [3] and/or parallel imaging techniques such as SENSE [4] and GRAPPA [5]. The 4D time-resolved angiography with keyhole (4D-TRAK) approach combines keyhole, with partial Fourier and parallel imaging [6]. Time-resolved imaging of contrast kinetics (TRICKS) divides k-space into various segments, with the central k-space regions being updated more often than outer ones [7]. Time-resolved angiography with stochastic trajectories (TWIST) also undersamples k-space with more frequent sampling of central k-space regions and a randomized outer section sampling pattern [8, 9]. The Cartesian projection reconstruction-like (CAPR) technique combines parallel imaging, partial Fourier and view sharing with phase/partition encoding locations selected to form radial vanes [10]. A variant of CAPR which reduces the amount of view sharing by undersampling the radial vanes is called Max-CAPR [11] and when this approach is combined with a sparsity-promoting compressed sensing reconstruction algorithm it has been called Sparse-CAPR [12]. These time-resolved CE-MRA techniques all employ various Cartesian data sampling schemes, limiting the distribution of the aliasing artifacts among only two of the three spatial dimensions.
The use of 3D projection reconstruction sequences is attractive for angiography applications because aliasing artifacts are relatively benign even when the number of projections is well below the Nyquist rate. In the vastly undersampled isotropic projection reconstruction (VIPR) technique [13], degradation of image quality due to aliasing artifacts does not become severe until the number of projections falls below 15% of the Nyquist rate. This is due to the variable-density nature of the trajectory where the central k-space is much more densely sampled than the outer regions. To fully sample a 256 mm spherical FOV at 1 mm resolution (an image matrix size of 256×256×256) would require ~100,000 projections to satisfy the Nyquist criterion. In this case, at a minimum TR of 4 ms, even acquiring 15% of the projections would take 1 minute, which is much too slow for time-resolved angiography. Further acceleration can be achieved by acquiring multiple projections within a single TR (e.g. VIPR-ME [14], SPIDER [15]) and/or using bent-projections to enable partial Fourier reconstruction [16]. Parallel imaging with a conjugate-gradient based SENSE reconstruction (CG-SENSE [17]) can also be employed.
The CAMERA technique [18] combines a multi-echo 2D radial readout with Cartesian encoding along the third dimension (i.e. stack-of-stars). With this approach a 1.1 × 1.1 × 3 mm3 resolution was demonstrated at a temporal footprint of 6.3 s for a whole head acquisition. This approach benefits from the incoherent artifacts of radial sampling in two dimensions, but will have a higher artifact level for a given undersampling factor than a true 3D radial approach. A benefit of the stack-of-stars approach over a 3D radial approach is that it enables fast reconstruction using standard GRAPPA or SENSE parallel imaging along the Cartesian dimension.
The highly constrained projection reconstruction (HYPR) technique [19] accelerates image acquisition through the use of a composite image. Aliasing artifacts resulting from undersampling each frame are reduced by multiplication with a composite image that can be obtained over a longer temporal window or in a separate acquisition. Although the original algorithm was formulated using a back projection reconstruction approach, subsequent variants such as HYPR-LR [20] and HYPR-IT [21] are compatible with more general non-Cartesian trajectories. While HYPR-type methods have been shown to yield images from extremely few projections, there can be bleed-through of the temporal information from one vessel into neighboring vessels, which is especially problematic for closely spaced vessels. In addition, any motion that occurs during the acquisition can potentially lead to artifacts or unusual filling patterns in the final images.
Compressed sensing also offers the promise of significant acceleration of MRA data acquisition [22]. Compressed sensing theory [23, 24] states that an image that is sparse in some transform domain can be exactly reconstructed from a smaller number of measurements than would be dictated by the Nyquist sampling limit. For MRA with baseline subtraction, the images themselves are sparse (few non-zero values) and no additional sparsifying transform is required. In practice, compressed sensing reconstructions are usually formulated as an iterative optimization problem where the solution minimizes a cost function containing a data consistency term and additional sparsity promoting terms. In the work of Lustig et. al. [22], sparsity is promoted in angiograms by including terms in the cost function which correspond to the ℓ1 norm of the image as well as the Total-Variation [25] of the image. The use of a Total-Variation penalty to reduce streaking artifacts in undersampled radial images was also employed in the work of Block et al. [26]. One drawback of this approach to compressed sensing is difficulty in determining values for the regularization parameters that achieve an appropriate balance between image sparsity and data consistency. Also, the non-linear conjugate gradient algorithms employed require a line search at each iteration to determine an appropriate step size, leading to increased computational complexity.
In the present work we seek high acceleration and temporal resolution by proposing to combine a time-efficient multi-projection radial trajectory with a novel compressed sensing reconstruction method to enable time-resolved CE-MRA at high temporal resolution. The trajectory is designed with pseudo-random projection locations at various timescales to give incoherent (noise-like) aliasing artifacts. The image reconstruction approach employed, namely Gradient Descent with Sparsification (GraDeS), does not require a composite image or any parameter tuning. By combining these methods, whole head time-resolved CE-MRA images can be generated with accelaration factors of >100 and a frame rate of 1.1 s.
Theory
Multi-coil Non-Cartesian Image Reconstruction
When employing a multi-channel receiver array for data acquisition, the resulting k-space data is made up of nc sets corresponding to each of the individual coils. Let yi be the k-space data corresponding to coil i. Let x correspond to the object to be reconstructed (stored in column vector format). The relationship between image space and k-space is given by:
| [1] |
Here, the matrix is a system matrix representing the linear transformation of an image to multi-coil k-space data, Ci are diagonal matrices containing each of the complex coil sensitivities, and is a matrix representing a linear transformation from image space to k-space. In the non-Cartesian case, can be taken to represent a Fourier transform followed by interpolation from a Cartesian k-space grid to the non-Cartesian k-space locations. This process is often referred to as a non-uniform fast Fourier transform (NUFFT). A “gridding” reconstruction for multi-coil data is then given by:
| [2] |
where D is a diagonal matrix containing the density compensation weights for each k-space sample. Density compensation is necessary to account for the non-uniform sampling density present in the radial k-space sampling pattern. are the complex conjugate coil sensitivities and is the adjoint NUFFT operation (non-Cartesian k-space to image space). If the k-space data are undersampled, the image estimate, , will contain aliasing artifacts.
GraDeS
The fundamental assumption of the reconstruction algorithm used here is that at any point in time, the difference of the current frame to the previous frame should be minimal. As long as our frame rate is faster than the bolus passage, this should be true. To this end, we have adopted the gradient descent with sparsification (GraDeS) algorithm [27], since it is computationally simple and in our experience very stable. Its utility in MR angiography was previously demonstrated in a 2D+time implementation [28]. The GraDeS algorithm as adapted for use with multi-coil MRI data is given by:
| [3] |
In the above, is the image estimate after iteration number n. The summation on the right side of Eq. 3 corresponds to a multi-coil gridding reconstruction of the difference between the acquired k-space data, y, and k-space values corresponding to the current image estimate. The new guess is formed by moving a step 1/γ size along this gradient. This procedure progressively reduces the error .
The GraDeS algorithm attempts to balance data consistency and prior knowledge of the image properties to yield a reconstruction without undersampling artifacts. In the original formation, the prior knowledge took the form of sparsity in the image domain that was explicitly included in the GraDeS algorithm. In the formulation of GraDeS described in Eq. 3 and used throughout this work, the hard thresholding operation used in the original formulation of the GraDeS algorithm has been omitted, as this thresholding removed smaller vessels with low SNR and CNR because they could not be well distinguished from surrounding noise. Instead, the prior knowledge is included by using the result of the previous frame as the initial guess, , for the current time frame. In order for this formulation to work, the first timeframe (where contrast has not yet arrived) is initialized with zeros, which is an accurate representation given that there should be no signal before contrast arrival.
Like most other CS algorithms, several parameters are required to determine the importance of data consistency and prior information in the final image. The gamma in Eq. 3 serves this purpose. Unlike other CS methods, the value of gamma can be set as suggested in the original GraDeS manuscript [27], and it does not have to be tuned depending on the image to be reconstructed. The only other free parameter is the number of iterations to perform. In this work, we have chosen to use a set number of iterations instead of relying on an estimate of convergence. When few iterations are used, the GraDeS algorithm relies heavily on the a priori information in the form of the previous timeframe; this could lead to inaccurate dynamic information. When using many iterations, the data consistency term is emphasized, and the image can become noisy when few projections are used for the reconstruction although the temporal dynamics will be more accurate. In order to determine the appropriate number of iterations for further use on in vivo data, the effect of this parameter on the final reconstruction is examined.
Methods
Trajectory Design
Contrast-enhanced angiograms are sparse in the image domain after subtraction of a pre-contrast baseline image. To be compatible with compressed sensing, the aliasing artifacts produced by the undersampled trajectory should be incoherent (noise-like) in the image domain. Undersampled 3D radial trajectories produce incoherent aliasing artifacts. A variety of methods have been proposed for distributing 3D projection locations over the surface of a sphere [29, 30, 31]. In the present case, it is desirable that the sampling density be nearly uniform for any subset of the full number of shots. To accelerate image acquisition, we propose to sample a number of radial lines within a single plane using a 2D radial EPI trajectory [32]. Multiple rotations of the same 2D trajectory will then be used to fill in 3D k-space. Using multiple rotations of 2D radial EPI readouts to fill 3D k-space has previously been applied to fMRI with an UNFOLD reconstruction [33]. In the present work, instead of using a set of regularly undersampled patterns in bit-reversed order, we instead propose to use a pseudo-random schedule of rotations to give incoherent aliasing artifacts at any arbitrarily chosen number of shots per reconstructed image frame. The full set of shots will be used in determining coil sensitivity maps. For this purpose, it is desirable that the full set of projections be reasonably uniformly distributed over the k-space volume. Additionally, the individual echoes of the multi-echo radial trajectory will be used to determine a field map (as described in further detail below). For field map estimation, the individual lines of the multi-echo readout should also be distributed over the full k-space volume. A field map is necessary for the correction of signal dropout that would otherwise occur in regions of field inhomogeneity. If uncorrected, off-resonance will lead to a different phase at the center of k-space for each echo of the multi-echo readout, leading to signal loss.
For simplicity, we choose to specify rotations of a single, planar 2D EPI trajectory (Fig. 1a). Using purely random projection locations over time is one way to approximate the desired sampling properties, but it results in sub-optimal sampling patterns where some regions have samples bunched more closely together than others. It was recently demonstrated in the work of Chan et al. [34] that a 2D Golden Means approach can give a sampling density that is more uniformly distributed than random sampling after a given number of shots. In principle, multiple subsequent shots from the 2D Golden Means approach could be connected in a single readout period. However, the angular spacing between subsequent shots tends to be large, which would lead to inefficient k-space sampling (where lots of time is spent in transition to the next projection). In the 2D Golden Means approach, only a single projection is played out per TR so the orientation is fully defined by a line from the origin to a point on the surface of the sphere. In the case where each shot is a 2D EPI trajectory, a rotation angle must also be specified about this axis to define the plane in which the trajectory will be played out.
Fig. 1.
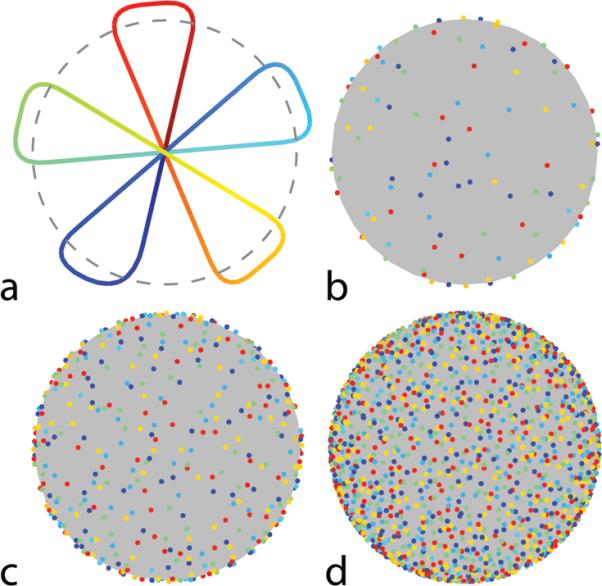
Proposed 3D radial acquisition scheme. a: A single shot consisting of 5 planar projections. Time along the trajectory is indicated in color from dark blue (start) to dark red (end). b: The distribution of the projections on the sphere after 16 shots/80 projections, c: 64 shots/320 projections and d: 256 shots/1280 projections. In each case, dots indicate where the individual projections would intersect a spherical surface (e.g. as indicated by the dotted line in panel a). Note that each of the individual readout lines are well distributed over the surface of the sphere.
In the work here, a simple algorithm was used to specify random rotations of a 2D EPI trajectory:
generate a random point on the surface of the sphere. Let the line from the origin to this point define the direction of the initial readout line of the 2D radial EPI trajectory.
generate a random rotation angle between 0 and 2π about the axis formed by the origin and the point chosen in step 1. This additional angle now defines the plane in which the trajectory will be played out.
To improve upon this purely random approach, some numerical refinement of the samples was performed at each of the stages above. At step 1, individual points having the smallest squared Euclidean distances from their neighbors were replaced by new randomly generated points. To encourage favorable distributions over any arbitrary subset of the full number of projections, the cost of being close to a neighboring sample was increased if the points were also close together in time. Specifically, let the full set of N points be ordered in time by the index i = 1 …N. The cost ψi of point i being at location , was calculated by the following summation over all other shots, j. :
| [4] |
Here the numerator is the squared Euclidean distance and the denominator increases the cost of points that are close together in time. In the absence of the temporal penalty in the denominator of Eq. 4, continued iterations of step 1 would eventually result in a uniformly distributed set of samples. The inclusion of the temporal term promotes a more uniform distribution at arbitrary timescales at the cost of a reduction in uniformity over the full set of samples. At step 2, multiple rotations about the axis of rotation were evaluated for each shot and the one resulting in the lowest net cost was chosen. In this way the bunching of samples produced by purely random selection of sampling locations was reduced. . This ad-hoc approach is not intended to produce a globally optimal sampling configuration, but merely to provide a modest improvement upon the results given by purely random sampling.
Trajectory Measurement
The trajectory was measured in a separate water phantom scan using the method of Beaumont et al.[35], employing 2 mm slices offset by 3 cm from isocenter. This technique is an extension of the k-space measurement technique originally proposed by Duyn et al. [36]. Due to the high resolution required, the method of Duyn et al. would require a very thin slice excitation (~1 mm) leading to a low SNR measurement. Rather than measure all 4096 unique shots, it is more practical to measure a small subset of the total number of shots and generate the rest via application of appropriate rotation matrices to the nearest measured shot. In our experience, measurement of only a single oblique shot was necessary for reconstruction with good image quality.
Simulation: Off-Resonant Point Spread Function
The point spread function (PSF) of a trajectory can be determined by evaluating Eq. 2 with all k-space samples, yi, set to a uniform amplitude (corresponding to the Fourier transform of a Dirac delta function). To evaluate the effect of off-resonance on the PSF, this uniform data vector is multiplied by an off-resonance frequency term. For simplicity, a spatially uniform off-resonance, for, was simulated: yi = exp (i2πfort) and the PSF was calculated as . The peak amplitude of the PSF was recorded for values of off-resonance between 0 and 600 Hz at 10 Hz increments.Image Acquisition
Images were acquired using a non-Cartesian 3D FLASH acquisition (TR=8.68 ms, flip angle=20, 1 mm isotropic resolution), with a 3T Siemens Verio scanner (Siemens Medical Solutions, Erlangen, Germany). A minimum-phase RF pulse (duration 600 μs, tip-down time 140 μs from end) was used for slab-selective excitation. A 2D radial EPI trajectory consisting of 5 projections per shot (duration=6.44 ms) was acquired in each TR interval starting at TE=0.26 ms (Fig. 1a). The additional TE times within the readout for the full echoes were 1.63, 2.89, 4.15, and 5.42 ms. Data were acquired continuously throughout the trajectory duration (including the transitions between projections). A 2.6 μs sampling interval (2476 total samples) was used, corresponding to two-fold oversampling along each readout line. Pseudo-random rotations of the 2D pattern were used to progressively fill in 3D k-space over multiple shots (Fig. 1b,c,d shows projection locations after 16, 64 and 256 shots, respectively). In total, 4096 unique shots were repeated periodically for 4 repetitions (total scan time: 2 min 10 s).
Phantom Experiments
A water phantom (Nuclear Associates model 76–903) was scanned to demonstrate the image quality provided by the proposed trajectory. Embedded within the larger phantom are a series of 6 vials which are filled with equal parts air and water, providing some magnetic susceptibility differences in this region. In addition to the 1 mm scan protocol described above, a 0.6 mm isotropic scan was performed. For the 0.6 mm isotropic case, the readout duration was 9.60 ms requiring an increased TR of 12.2 ms. A separate 2D scan of a single slice with a standard Cartesian gradient echo sequence was performed as a reference (TR=180 ms, TE = 7 ms, 10 slices, 1.5 mm slice width). A circular window in k-space was applied to the Cartesian data to match the k-space coverage of the radial acquisition. Phantom images were reconstructed using a standard non-iterative NUFFT of the density compensated data from the full set of 4096 shots (20480 projections).
In-Vivo Experiments
Ten subjects (2 volunteers, 8 patients) were scanned on a 3T Siemens Verio system equipped with a 12-channel head coil. Subjects were scanned only after informed consent in accordance with local IRB regulations. None of the subjects in the present study had any known vascular abnormalities. For patient subjects, the angiography research protocol was inserted between the pre and post-contrast anatomical scans being performed by the clinical staff. Two of the scans were performed with an additional 4-channel neck coil. A single dose (0.1 mmol/kg) of gadoversetamide (Gd-DTPA-BMEA, OptiMark™; Covidian, Mansfield, MA, USA) or gadobentate dimeglumine (Gd-BOPTA, MultiHance™; Bracco Imaging SpA, Milan, Italy) was administered at a rate ranging from 2–3 mL/s via a power injector (Optistar™ LE; Covidian, Mansfield, MA, USA). Contrast injection was immediately followed by a 25 ml saline flush. Subjects were screened according to local institutional procedures to exclude those with impaired renal function or history of kidney disease. Contrast injection was performed at approximately 1 minute into the scan, allowing the acquisition of 2 baseline acquisitions (4096 shots each) before contrast arrival.
Image Reconstruction
Subtraction of the average of the 2 baseline acquisitions from the post-baseline k-space data was performed to remove static tissue. Image reconstruction was then carried out on this difference data (corresponding to sparse images) using the GraDeS algorithm. We also performed a standard non-iterative gridding reconstruction for comparison.
In the present work, reconstructions were performed at 128 shots / 1.1 s per frame per frame. This corresponds to an acceleration factor of roughly 100 relative to a fully sampled 3D radial acquisition. It is important to note that although we chose to reconstruct frames after every 128 shots, the randomized nature of the trajectory makes it possible to choose an arbitrary number of shots per frame upon reconstruction.
Reconstruction Algorithms
Gridding operations were performed using NUFFT algorithms with table-based interpolation as provided in the Image Reconstruction Toolbox (http://www.eecs.umich.edu/~fessler/code) [37]. In all cases, data from the full readout window (including the transitions between radial lines) was used during reconstruction. The table-based approach to the NUFFT greatly reduces memory requirements, making high-resolution 3D reconstruction feasible. A kernel size of 3×3×3 and grid oversampling factor of 1.4 were chosen to minimize computation time while maintaining acceptable accuracy. The NUFFT routines were modified to take advantage of multiple CPU cores via the OpenMP API (http://www.openmp.org).
For the GraDeS algorithm, each frame was initialized with the result from the previous frame. A zero image was used to initialize the first time frame, because the first frame corresponds to an image acquired before the arrival of contrast. The GraDeS γ parameter was set to 1.5 (1/γ is the gradient descent step size). A total of 10 GraDeS iterations were performed per frame. Additional reconstructions using 3, 20 and 40 GraDeS iterations per time frame were performed on one of the subjects.
Density Compensation
For a 3D radial acquisition with equidistant projection spacing, the k-space density decreases with the square of the k-space radius. For the proposed trajectory, however, the projections are not exactly equidistant from each other and the gradient amplitude is not constant during the readout (particularly when transitioning to the following k-space line). For these reasons, we used the iterative numerical approach of Bydder et al. [38] to calculate appropriate density compensation weights for the full set of acquired samples. Within the algorithm, 6 iterations were used. The weights were calculated once using the full set of k-space shots. Subsets of these precalculated weights were subsequently used when reconstructing individual undersampled image frames. The absolute scaling of the density compensation was set so that transformation of the k-space data to the image domain and then back to k-space does not alter the scaling of the data. This can be achieved by scaling the diagonal density compensation matrix, D, by a constant so that , where is a column vector of ones.
Channel Compression
To reduce the amount of data and increase reconstruction speed, a PCA-based channel compression algorithm was employed [39]. The acquired data consisted of 12 channels for most subjects scanned, with one subject having four additional channels of data from a separate neck coil. Eight channels were generally used for the reconstructions in the present work. Compression to fewer than four channels results in substantial degradation to the reconstructed images (result not shown).
Coil Sensitivity Estimation
The full set of 4096 shots averaged across the four repetitions was reconstructed independently for each coil (via NUFFT). Because a field map has not yet been estimated at this point, each readout was truncated to keep only the first 1.5 projections of the 5 projection acquisition. This avoids signal dropouts due to susceptibility at the cost of increased undersampling artifact. To reduce aliasing artifacts in the images used to estimate the coil sensitivities, the images were smoothed to 4 mm isotropic resolution by applying a Gaussian window in k-space. Coil sensitivities were then estimated from the individual coil images using the adaptive combination algorithm of Walsh et al. [40, 41]. One could recalculate the coil sensitivities using the full set of 5 projections once the field map has been estimated, but in our experience this did not visibly improve the reconstruction results.
Field Map Estimation
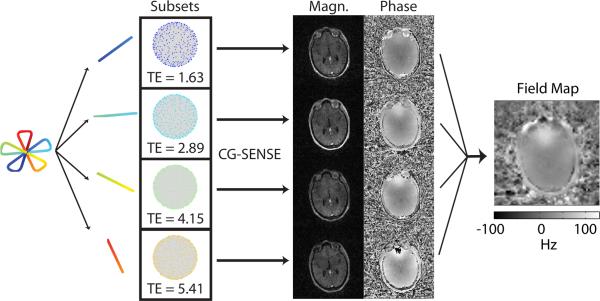
To reduce susceptibility artifacts, field-map correction via time-segmented reconstruction [42] with between 5 and 7 segments was used. The 5-line radial readout of Fig. 1a consists of 4 full echoes plus an initial and final half-echo. It can be seen in Fig. 1b–d that for each full echo, multiple shots result in a reasonably isotropic distribution of samples over the full 3D spherical k-space. The field map itself was determined from this 3D radial dataset by reconstructing images corresponding to individual echo times within the multi-echo readout as illustrated in Fig. 2. The full dataset (4096 shots averaged across the 4 repetitions) was used. Images corresponding to each of the 4 full echoes (echo spacing ~1.26 ms) provide the data necessary for field map estimation. A computationally simple field map estimation scheme is described in Appendix A.
Fig. 2.
Illustration of the field map estimation procedure. The readout is split into separate echoes. Data corresponding to each separate echo is reconstructed independently using a CG-SENSE reconstruction. The resulting images are then used to perform a multi-echo field map estimation.
To reduce aliasing in the individual echo images and accelerate the field map estimation, field maps were reconstructed at a lower 4 mm isotropic resolution. Aliasing was further reduced through parallel imaging by the use of CG-SENSE [17] (4 iterations) for reconstruction. A relatively low resolution is acceptable because in-vivo field maps are typically smoothly varying. The computed field maps were then linearly interpolated back to 1 mm isotropic resolution for later use during image reconstruction. The time-segmented field map correction approach used during reconstruction follows that described in section II, parts A-B of Sutton et al. [43] as implemented in the image reconstruction toolbox (http://www.eecs.umich.edu/~fessler/irt/).
Results
Trajectory Generation
Fig. 1a shows a single shot of the radial EPI trajectory. Color in this figure represents time along the readout (dark blue at the starting point, dark red at the end). Figs. 1b–c demonstrate how rotations of this single sampling patterns result in a progressively denser set of projections over time. These sampling locations correspond to a refinement of random sample locations as described above. Fig. 3 shows the numerically generated density compensation function (DCF), averaged across the different shots (bottom row). For reference, the corresponding k-space amplitudes are plotted (top row). Shaded regions in the DCF plot indicate periods of constant gradient amplitude where the DCF closely resembles the expected |k|2 analytical weighting of a standard 3D radial acquisition. The unshaded regions correspond to the transitions between radial lines.
Fig. 3.
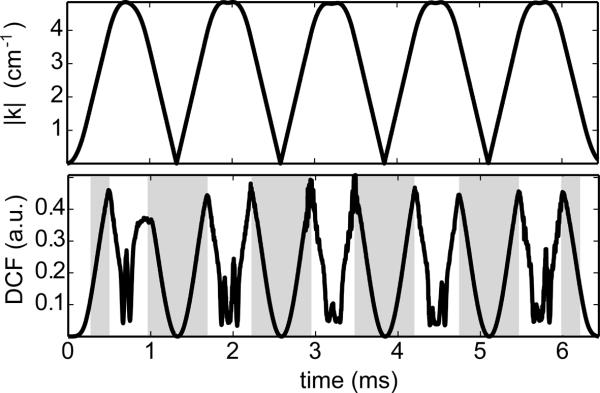
Density compensation function (bottom) and the corresponding k-space amplitude (top) averaged across all shots of the multi-echo 3D radial acquisition. The shaded regions of the DCF indicate times when the gradient amplitude is constant. In these regions, the numerically determined DCF increases quadratically with k-space radius as expected for a 3D radial acquisition.
Phantom Experiment
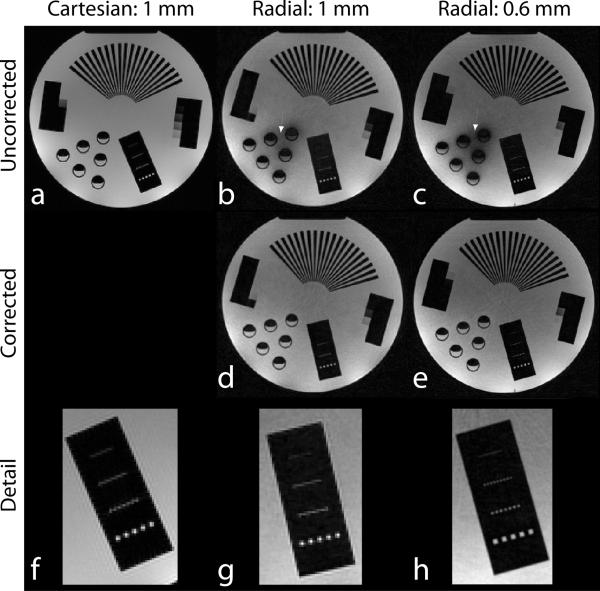
Fig. 4 demonstrates the image quality provided by the proposed trajectory. Fig. 4a shows a reference slice from a 1 mm resolution 2D Cartesian GRE acquisition. The k-space data was truncated to a circular region before reconstruction to match the coverage provided by a radial acquisition. Panel f shows a zoomed ROI for clearer depiction of the spatial resolution. Fig. 4b shows a single slice through a 3D radial acquisition with a nominal 1 mm isotropic resolution. The 4096 shots (20,480 projections) acquired correspond to sampling ~4 times below the Nyquist rate. The arrow points to a region where off-resonance is leading to moderate signal loss. The off-resonance corrected reconstruction of Fig. 4d shows recovery of the signal in this region. Panel g demonstrates that the resolution obtained is comparable to that provided by the Cartesian acquisition. A separate 3D radial acquisition acquired at 0.6 mm isotropic resolution is shown in Figs. 4c,e,f (~11 times below the Nyquist rate). Image resolution has clearly improved, but the longer readout duration leads to greater susceptibility-related signal loss (white arrow) in the uncorrected image. Note that the resolution is not significantly degraded by the presence of off-resonance. Because the radial acquisitions are undersampled there are low amplitude incoherent aliasing artifacts in the background regions that are not present in the fully sampled Cartesian case. The slight in-plane rotation of the phantom between the radial and Cartesian cases is due to differences in phantom placement within the scanner (the Cartesian data was acquired in a separate scan session at a later date).
Fig. 4.
Phantom Images reconstructed via FFT (Cartesian) or NUFFT (radial). Top row: Images generated without field map correction. White arrows indicate a region of signal loss due to off-resonance caused by the presence of air bubbles in a series of cylindrical vials of water. Middle row: Images generated with time-segmented field map correction. The signal lost due to off-resonance effects is recovered. Bottom row: zoomed ROI from the top row, demonstrating the resolution provided. The rows of “dots” from bottom to top are squares of 2 mm, 1 mm, 0.75 mm and 0.5 mm per side, respectively.
In-Vivo Experiments
Fig. 5 shows a gridding reconstruction of a mixed arterial/venous frame using a relatively wide 17.8 s post-contrast data window to minimize aliasing artifacts. The image at the left shows widespread signal dropout in the neck due to poor shimming in this region. Some additional dropout near the sinuses is apparent. The image after fieldmap correction shows that this signal loss can be recovered when a time-segmented reconstruction is used. The plot on the right shows the expected signal intensity vs. off-resonance frequency. A null in the signal intensity occurs at a frequency of 155 Hz, corresponding to the reciprocal of the 6.44 ms readout duration. This is the point at which a full 2π dephasing occurs over the set of zero crossings.
Fig. 5.
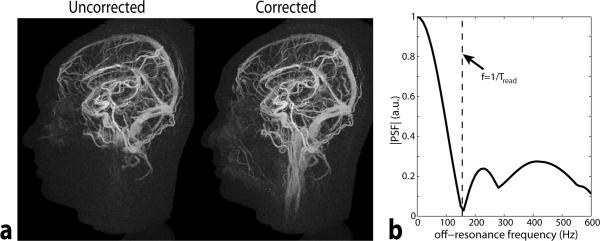
a) Gridding reconstruction of a mixed arterial/venous frame corresponding to 17.8 s of data (2048 shots). The reconstruction was performed with and without field map correction. Without field map correction, substantial regions of signal loss are apparent. The vessels in the neck are much better visualized after field map correction. b.) Simulated signal amplitude at varying amounts of off-resonance.
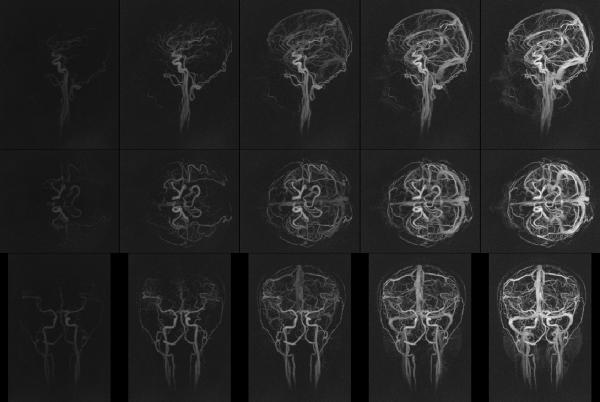
Fig. 6 demonstrates a series of time frames from a GraDeS reconstruction using 1.1 s of data per frame (10 iterations, γ=1.5). All images are scaled identically and only a subset of the image time frames is displayed. A rotational volume rendering of the full set of timeframes is available in the online supplementary material. The arterial and venous phases are well separated, the vessel edges are clearly demarcated, vessel order and branching are readily viewed, and smaller caliber vessels are discernable, yielding an overall excellent image quality.
Fig. 6.
Example sagittal (top row), axial (middle row) and coronal (bottom row) MIPs at various time points of a GraDeS reconstruction on a single subject. 1.1 seconds of data (640 projections) were used at each time frame. 10 GraDeS iterations were performed at γ=1.5. Only a subset of the even numbered timeframes is displayed in the image above. A corresponding volume rendering of all time frames is available as a video in the online supplementary material.
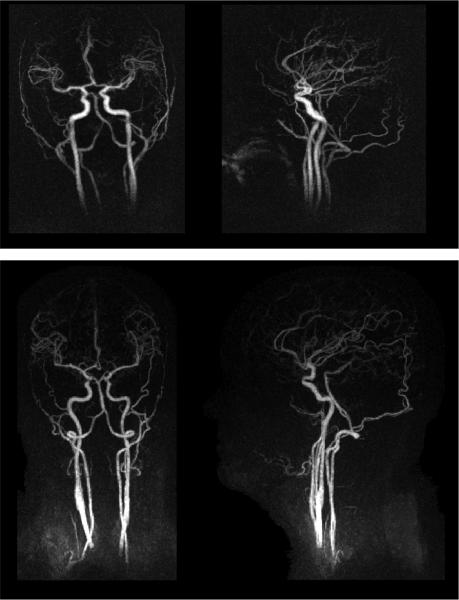
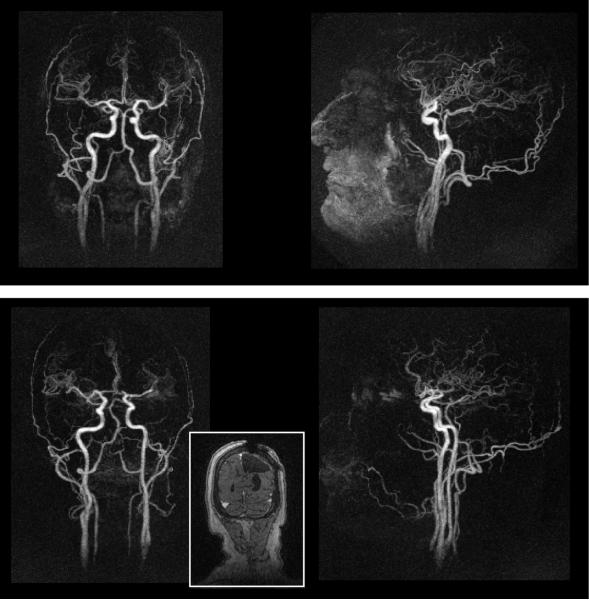
Further examples of late arterial phase time frames after GraDeS reconstruction are shown for four different subjects in Figs. 7–8. The top row of Fig. 7 is representative of the typical image quality obtained when using the head coil alone. The bottom row demonstrates reconstruction over a larger 32 cm S/I FOV provided in the case where an additional neck coil was used, permitting demonstration of more of the carotid and vertebral arteries. The top row of Fig. 8 demonstrates our worst case of background subtraction, which required masking out the anterior portion of the volume to obtain a high quality coronal MIP. Despite the decrease in image sparsity due to the patient motion in this examination, the GraDeS algorithm was still able to generate high quality images. The bottom row of Fig. 8 demonstrates a patient scanned following tumor resection with resultant diminished number of branches in that distribution.
Fig. 7.
Late arterial time frames from GraDeS reconstructions of 2 additional subjects. The top row shows another representative subject when using the head coil alone. The bottom row shows a subject for which a neck coil was used in addition to the 12-channel head coil. It has a larger (~32 cm) FOV in the S/I direction, allowing a more complete view of the carotid and vertebral arteries..
Fig. 8.
Additional examples of late arterial time frames. The top row shows the subject for which the baseline subtraction performed the poorest. There is substantial residual signal intensity in the anterior portion of the head, requiring these voxels to be masked out when creating the coronal MIP. On the bottom row is a subject where the branches of the MCA are particularly asymmetric due to a previous tumor resection (see inset coronal slice).
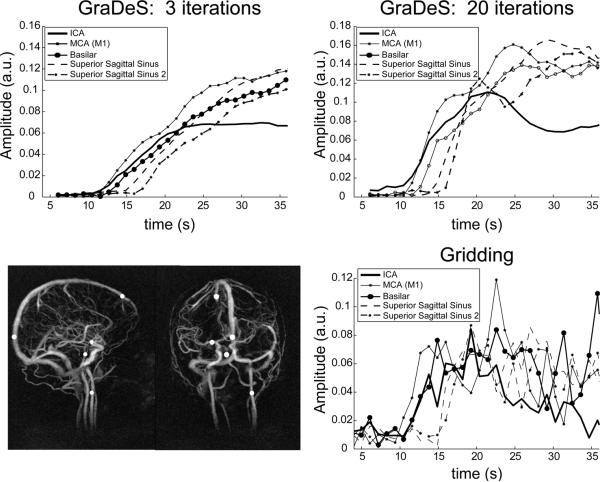
The temporal behavior for representative single voxel arterial and venous timecourses are plotted in Fig. 9. The white circles shown in the MIP at the bottom left illustrate the voxel locations. Results are shown for GraDeS at both 3 and 20 iterations in comparison to a standard gridding reconstruction. In all cases arterial enhancement precedes venous enhancement by approximately 4 s as expected. The rate of enhancement in the GraDeS reconstruction depends strongly on the number of interleaves employed; more GraDeS iterations results in a timecourse that more closely follows that of the undersampled gridded data.
Fig 9.
Single voxel temporal uptake curves for various arterial and venous vessels. The white circles in the MIPs at the bottom left illustrate the chosen voxel locations. Uptake curves for the same voxel locations are shown for 3 sets of reconstruction parameters: 1.) GraDeS with 3 iterations (top left), 2.) GraDeS with 20 iterations (top right), 3.) Gridding. Both GraDeS reconstructions used γ=1.5. The GraDeS results show fewer oscillations due to noise than the Gridding result, but the rate of uptake is delayed (particularly for the 3 iteration case), demonstrating the need for a larger number of iterations of the GraDeS algorithm. In all cases arterial signal uptake begins approximately 4–5 seconds before venous enhancement begins, indicating that these vessels can be well distinguished.
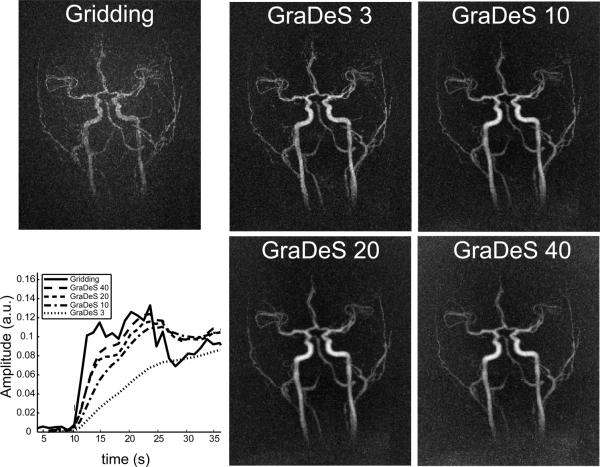
Further illustration of the variation in the spatial and temporal properties of the GraDeS reconstruction with number of iterations is given in Fig. 10. In this figure, the signal curves were averaged over a small region of interest (ROI) in the internal carotid artery (170 total voxels over a ~1 cm long segment). Here a late arterial timeframe is shown for a gridding reconstruction and for GraDeS reconstructions at 3, 10, 20 and 40 iterations. At this extreme undersampling factor (~125), the gridding reconstruction gives a non-diagnostic image due to excessive undersampling artifacts. The large oscillations in the gridding time courses of Fig. 9 are greatly reduced in Fig. 10 due to averaging over multiple voxels. This provides a reference time course that is close to the true underlying temporal behavior. It can be seen that the GraDeS uptake curves approach the gridding case as the number of iterations is increased. Unfortunately, loss of spatial resolution becomes apparent in the late arterial MIPs, particularly in the 20 and 40 iteration cases. For this reason 10 iterations was chosen as a compromise between the spatial and temporal resolution properties for the results displayed in Figs. 6–8 and in the videos provided in the online supplementary materials.
Fig. 10.
Comparsion of temporal curves and image quality for various numbers of GraDeS iterations vs. gridding. The GraDeS timecourses become closer to those for the gridding reconstruction as the number of iterations is increased. However, as the number of iterations becomes large, image resolution appears to decrease and background noise is increased. The gridding reconstruction has the poorest spatial quality due to excessive undersampling artifacts that obscure the underlying vasculature.
Discussion
The sparse nature of MR angiograms combined with the incoherent aliasing provided by undersampled 3D radial acquisitions has enabled the reconstruction of whole head angiograms at 1 mm3 resolution and 1.1 s frame rate. This spatial resolution has allowed clear visualization of the cerebral arteries and many of their branches. The temporal order of vessel enhancement was preserved regardless of the number of GraDeS iterations performed, although the enhancement rate increases with an increasing number of iterations.
An assumption of the GraDeS algorithm is that the images do not change drastically between reconstructed time frames. In the absence of severe patient motion, this should be the case, although localized features such as an AVM might enhance relatively rapidly (~ 1 s). The degree of temporal blurring which occurs in such cases remains to be determined. An attempt to recruit patient subjects for MRI scanning subsequent to a clinical x-ray digital subtraction angiography exam are underway. This will allow evaluation of the true clinical utility of this approach in typical cases of vascular pathology.
The use of a multi-echo radial EPI readout increases acquisition efficiency by allowing a greater percentage of the TR to be spent on data sampling. This longer TR also leads to a higher steady-state signal intensity. Even when using only 1.1 seconds of data, some vessels can still be seen at 1 mm isotropic resolution with a simple gridding reconstruction (Fig. 10, top left). This is possible due to a combination of the incoherent undersampling artifacts provided by the proposed trajectory and due to the sparse nature of MR angiograms (typically <2% of the reconstructed voxels contain vessels). GraDeS reconstructions performed with 1.1 s of data per frame greatly improve upon the gridding approach leading to diagnostic quality images. In addition to the image domain sparsity, the GraDeS approach benefits from the similarity of adjacent time frames (this allows the use of the result from the previous frame as the initial guess for the next).
The GraDeS γ parameter was set to 1.5 for all of the reconstructions shown in this work. This value was empirically chosen as one which gave stable reconstruction results on all subjects while not requiring an unnecessarily large number of iterations. In the original GraDeS work [27], a minimum γ of 4/3 was used, but more stable results were found for γ=3. Using a larger γ reduces the gradient descent step size, requiring a larger number of iterations to achieve an equivalent reconstruction result. For example, we found that setting γ=3 gave nearly identical results after 20 iterations as γ=1.5 at 10 iterations (result not shown). Using a γ which is too small quickly leads to unuseable images after only a few iterations.
The primary drawback of the multi-echo radial trajectory is an increased sensitivity to off-resonance effects as the number of echoes increases. Because the trajectory crosses itself multiple times at the center of k-space, off-resonance leads to different signal phase at each of these crossings resulting in signal loss. As can be seen in Fig. 5b, the frequency at which severe signal loss occurs corresponds to 1/Tread (the frequency at which a full 2π dephasing has occurred during the readout). Fortunately, this effect can be adequately addressed at the cost of additional computation time through the use of a field map during reconstruction (Fig. 5a). Because of the specifically designed trajectory shown here, the required field map can be generated from the same dataset as illustrated in Fig. 2.
Reconstruction of large 3D volumes (~256×256×256) is challenging in terms of both computation time and memory requirements. The use of relatively small gridding kernel size (3×3×3) and grid oversampling factor of 1.4 was chosen as a compromise between accuracy and computation time. With an appropriate choice of the gridding kernel, minimal oversampling ratios (1.125–1.375) still result in an accurate image reconstruction [44]. The time for an FFT operation is where K is the number of pixels on the oversampled Cartesian grid. The gridding time between Cartesian and non-Cartesian k-space is where J is the width of the separable gridding kernel along each dimension and M is the number of k-space samples. The overall computation time for each iteration of the GraDeS algorithm is then . Here L is the number of time-segments used in the field map correction and Nc is the number of coils. The factor of 2 reflects that both the forward and adjoint NUFFT operations are performed during a single iteration. In the present application, the data at each frame is highly undersampled (M<<K), making the FFT operations the most expensive part of the computation. Typical values for the current publication at 128 shots per frame are K=2.8e7, M=3.2e6, J=3, L=6, Nc=8. The memory requirements for the NUFFT were minimized by using a lookup table-based implementation. Despite these efforts to reduce computation time, several minutes are still required to calculate each image frame reconstructed with the GraDeS algorithm. However, the fact that the dominant computation time is the FFT operations indicates that this algorithm is about as efficient as possible. Any algorithm that involves any significant inverse or optimization steps at each iteration would most likely result in even more significant calculation times.
The proposed radial trajectory is compatible with a range of other compressed sensing reconstruction algorithms. A primary drawback of most compressed sensing approaches is the need to empirically tune various reconstruction parameters. To this end, several recent publications have proposed means to automatically choose these parameters. In the work of Huang et al. [45], the weight on a total variation regularization term is set to 0.01 * mean(g) where g is a SENSE g-factor image and 0.01 was empirically determined as an appropriate scaling. This approach can be applied to Cartesian SENSE, but for the non-Cartesian trajectory of the present work, no analytical form for the g-factor is available. Khare et al. [46] propose an iterative soft thresholding algorithm where the threshold is automatically determined using a data-driven approach at each iteration. Although it was applied to a Cartesian example in their work, it should be easily adapted to the non-Cartesian case as well. A comparison of the GraDeS technique with alternative compressed sensing reconstruction algorithms is an interesting area for future work.
Diagnostic quality images have been reconstructed using a smaller temporal footprint than is possible with any previously existing techniques that do not employ a separate composite image during reconstruction. The reconstruction algorithm used does not require the tuning of any regularization parameters and no separate calibration scans are required. γ can be left at a fixed value of 1.5 for all subjects. Although we chose to reconstruct frames after every 128 shots (1.1 s), the randomized nature of the trajectory makes it possible to choose an arbitrary number of shots per frame upon reconstruction. Because the field map and sensitivities are estimated from the same dataset, the total scan time was only 2 minutes and 10 seconds (plus shimming). This is substantially shorter than standard non time-resolved Cartesian angiography acquisitions that are routinely used clinically at our institution.
Supplementary Material
Acknowledgements
This work was supported in part by Siemens Medical Solutions as well as NIH 1R01HL094557 and NIH 5R01HL088437-02.
Appendix A: A simple field map estimation scheme
The multi-echo field map estimation scheme of Hernando et al. [47] can determine the correct field map in the presence of both fat and water signals. This algorithm works well over most brain regions, but fat and water are still sometimes swapped lower in the neck where the off-resonance is more severe, leading to erroneous field map values. Additionally, the computation time for a full 3D volume can be on the order of an hour. In angiography applications, any fat signal will be removed by the baseline subtraction step, so we can instead perform a simplified field map estimation, assuming that all voxels are water as described below.
The proposed radial EPI trajectory crosses itself multiple times at the center of k-space. If the individual complex images corresponding to the separate echo times are summed, signal will be attenuated in off-resonant voxels due to the presence of a different phase at each echo. A rough correction can be obtained by applying a phase at each individual voxel that is the product of the echo time and the conjugate of the off-resonance phase at a given location:
Where is the field map (in Hz) and T is the echo spacing in seconds. Ii are the complex images corresponding to echo number i. The equation above suggests a very simple approach to obtain the field map:
- Create images, I(f1) … I(fN), via eq. XX corresponding to a set of off-resonant frequencies that are constant over the whole imaging volume. For example, set f to N equally spaced values between −300 and 300 Hz. This is very fast because it only involves linear combinations of the previously reconstructed individual echo images.
The frequency offset which results in the maximum image intensity at a given voxel is taken to correspond to the field map value at that location.
The above approach may give an aliased off-resonance value for pixels that are off-resonance by more than 1/(2*T) where T is the echo spacing. For the 1.26 ms echo spacings used in the present work, the aliasing free range is approximately +/−400 Hz. This range should be adequate to represent the true off-resonance values over the full volume as long as shimming is performed during prescan. Fat voxels will be fit to an erroneous field map value that is offset by the chemical shift and are more likely to be aliased to the wrong frequency. Because any fat signal will be destroyed by the baseline-subtraction step, this is not a problem for the current application. This simple field map estimation scheme is computationally efficient because it only requires performing several linear combinations of previously reconstructed images.
References
- [1].Riederer SJ, Tasciyan T, Farzaneh F, Lee JN, Wright RC, Herfkens RJ. MR fluoroscopy: technical feasibility. Magn Reson Med. 1988 Sep;8:1–15. doi: 10.1002/mrm.1910080102. [DOI] [PubMed] [Google Scholar]
- [2].van Vaals J, Brummer M, Dixon W, Tuithof H, Engels H, Nelson R, Gerety B, Chezmar J, den Boer J. “keyhole” method for accelerating imaging of contrast agent uptake. J Magn Reson Imaging. 1993;3:671–675. doi: 10.1002/jmri.1880030419. [DOI] [PubMed] [Google Scholar]
- [3].Margosian P, Schmitt F, Purdy D. Faster MR imaging: Imaging with half the data. Health Care Instrumentation. 1986;1:195–197. [Google Scholar]
- [4].Pruessmann KP, Weiger M, Scheidegger MB, Boesiger P. SENSE: sensitivity encoding for fast MRI. Magn Reson Med. 1999 Nov;(42):952–962. [PubMed] [Google Scholar]
- [5].Griswold MA, Jakob PM, Heidemann RM, Nittka M, Jellus V, Wang J, Kiefer B, Haase A. Generalized autocalibrating partially parallel acquisitions (GRAPPA) Magn Reson Med. 2002 Jun;47:1202–1210. doi: 10.1002/mrm.10171. [DOI] [PubMed] [Google Scholar]
- [6].Willinek WA, Hadizadeh DR, von Falkenhausen M, Urbach H, Hoogeveen R, Schild HH, Gieseke J. 4D time-resolved MR angiography with keyhole (4D-TRAK): more than 60 times accelerated MRA using a combination of CENTRA, keyhole, and SENSE at 3.0T. J Magn Reson Imaging. 2008;27(6):1455–1460. doi: 10.1002/jmri.21354. [DOI] [PubMed] [Google Scholar]
- [7].Korosec FR, Frayne R, Grist TM, Mistretta CA. Time-resolved contrast-enhanced 3D MR angiography. Magn Reson Med. 1996 Sep;36:345–351. doi: 10.1002/mrm.1910360304. [DOI] [PubMed] [Google Scholar]
- [8].Vogt F, Eggebrecht H, Laub G, Kroeker R, Schmidt M, Barkhausen J, Ladd S. High spatial and temporal resolution MRA (TWIST) in acute aortic dissection. Proc Intl Soc Magn Reson Med. 2007:92. [Google Scholar]
- [9].Lim RP, Shapiro M, Wang EY, Law M, Babb JS, Rueff LE, Jacob JS, Kim S, Carson RH, Mulholland TP, Laub G, Hecht EM. 3D time-resolved MR angiography (MRA) of the carotid arteries with time-resolved imaging with stochastic trajectories: comparison with 3D contrast-enhanced bolus-chase MRA and 3D time-of-flight MRA. AJNR Am J Neuroradiol. 2008 Nov;29:1847–1854. doi: 10.3174/ajnr.A1252. [DOI] [PMC free article] [PubMed] [Google Scholar]
- [10].Haider CR, Hu HH, Campeau NG, Huston J, Riederer SJ. 3D high temporal and spatial resolution contrast-enhanced MR angiography of the whole brain. Magn Reson Med. 2008;60(3):749–760. doi: 10.1002/mrm.21675. [DOI] [PMC free article] [PubMed] [Google Scholar]
- [11].Haider CR, Borisch EA, Glockner JF, Mostardi PM, Rossman PJ, Young PM, Riederer SJ. Max CAPR: high-resolution 3D contrast-enhanced MR angiography with acquisition times under 5 seconds. Magn Reson Med. 2010;64(4):1171–1181. doi: 10.1002/mrm.22434. [DOI] [PMC free article] [PubMed] [Google Scholar]
- [12].Trzasko JD, Haider CR, Borisch EA, Campeau NG, Glockner JF, Riederer SJ, Manduca A. Sparse-CAPR: Highly accelerated 4D CE-MRA with parallel imaging and nonconvex compressive sensing. Magn Reson Med. 2011 May; doi: 10.1002/mrm.22892. In Press; DOI: 10.1002/mrm.22892. [DOI] [PMC free article] [PubMed] [Google Scholar]
- [13].Barger AV, Block WF, Toropov Y, Grist TM, Mistretta CA. Time-resolved contrast-enhanced imaging with isotropic resolution and broad coverage using an undersampled 3D projection trajectory. Magn Reson Med. 2002 Aug;48:297–305. doi: 10.1002/mrm.10212. [DOI] [PubMed] [Google Scholar]
- [14].Lu A, Brodsky E, Grist TM, Block WF. Rapid fat-suppressed isotropic steady-state free precession imaging using true 3D multiple-half-echo projection reconstruction. Magn Reson Med. 2005;53(3):692–699. doi: 10.1002/mrm.20389. [DOI] [PubMed] [Google Scholar]
- [15].Larson AC, Simonetti OP. Real-time cardiac cine imaging with SPIDER: steady-state projection imaging with dynamic echo-train readout. Magn Reson Med. 2001 Dec;46:1059–1066. doi: 10.1002/mrm.1299. [DOI] [PubMed] [Google Scholar]
- [16].Toropov Y, Block W. Increasing acquisition speed in undersampled 3D projection imaging. Proc Intl Soc Mag Reson Med 9. 2001:1809. [Google Scholar]
- [17].Pruessmann KP, Weiger M, Bornert P, Boesiger P. Advances in sensitivity encoding with arbitrary k-space trajectories. Magn Reson Med. 2001 Oct;46:638–651. doi: 10.1002/mrm.1241. [DOI] [PubMed] [Google Scholar]
- [18].Jeong HJ, Eddleman CS, Shah S, Seiberlich N, Griswold MA, Batjer HH, Carr JC, Carroll TJ. Accelerating time-resolved MRA with multiecho acquisition. Magn Reson Med. 2010;63(6):1520–1528. doi: 10.1002/mrm.22373. [DOI] [PMC free article] [PubMed] [Google Scholar]
- [19].Mistretta CA, Wieben O, Velikina J, Block W, Perry J, Wu Y, Johnson K, Wu Y. Highly constrained backprojection for time-resolved MRI. Magn Reson Med. 2006 Jan;55:30–40. doi: 10.1002/mrm.20772. [DOI] [PMC free article] [PubMed] [Google Scholar]
- [20].Johnson KM, Velikina J, Wu Y, Kecskemeti S, Wieben O, Mistretta CA. Improved waveform fidelity using local HYPR reconstruction (HYPR LR) Magn Reson Med. 2008 Mar;59:456–462. doi: 10.1002/mrm.21505. [DOI] [PMC free article] [PubMed] [Google Scholar]
- [21].Samsonov A, Wieben O, Block W. HYPRIT: Generalized HYPR reconstruction by iterative estimation. Workshop on Non-Cartesian MRI, Sedona AZ. 2007 [Google Scholar]
- [22].Lustig M, Donoho D, Pauly JM. Sparse MRI: The application of compressed sensing for rapid MR imaging. Magn Reson Med. 2007 Dec;58:1182–1195. doi: 10.1002/mrm.21391. [DOI] [PubMed] [Google Scholar]
- [23].Candes E, Romberg J, Tao T. Robust uncertainty principles: exact signal reconstruction from highly incomplete frequency information. IEEE Trans Inform Theory. 2006 Feb;52:489–509. [Google Scholar]
- [24].Donoho D. Compressed sensing. IEEE Trans Inform Theory. 2006 Apr;52:1289–1306. [Google Scholar]
- [25].Rudin L, Osher S, Fatemi E. Nonlinear total variation based noise removal algorithms. Physica D. 1992;60:259–268. [Google Scholar]
- [26].Block KT, Uecker M, Frahm J. Undersampled radial MRI with multiple coils. iterative image reconstruction using a total variation constraint. Magn Reson Med. 2007 Jun;57:1086–1098. doi: 10.1002/mrm.21236. [DOI] [PubMed] [Google Scholar]
- [27].Garg R, Khandekar R. Gradient descent with sparsification: An iterative algorithm for sparse recovery with restricted isometry property. Proceedings of the 26th Annual International Conference on Machine Learning.2009. pp. 337–344. [Google Scholar]
- [28].Seiberlich N, Jeong H, Carroll T, Griswold M. Parameter-free reconstruction of highly undersampled MR angiography images using gradient descent with sparsification. Proc. Intl. Soc. Magn. Reson. Med. 2010 [Google Scholar]
- [29].Glover GH, Pauly JM, Bradshaw KM. Boron-11 imaging with a three-dimensional reconstruction method. J Magn Reson Imaging. 1992;2(1):47–52. doi: 10.1002/jmri.1880020109. [DOI] [PubMed] [Google Scholar]
- [30].Wong ST, Roos MS. A strategy for sampling on a sphere applied to 3D selective RF pulse design. Magn Reson Med. 1994 Dec;32:778–784. doi: 10.1002/mrm.1910320614. [DOI] [PubMed] [Google Scholar]
- [31].Lethmate R. PhD thesis, Université Claude Bernard. Lyon, France: 2001. Novel Radial Scan Strategies and Image Reconstruction in MRI. [Google Scholar]
- [32].Silva AC, Barbier EL, Lowe IJ, Koretsky AP. Radial echo-planar imaging. J Magn Reson. 1998 Nov;135:242–247. doi: 10.1006/jmre.1998.1547. [DOI] [PubMed] [Google Scholar]
- [33].Lee GR, Griswold MA, Tkach JA. Rapid 3D radial multi-echo functional magnetic resonance imaging. NeuroImage. 2010;52(4):1428–1443. doi: 10.1016/j.neuroimage.2010.05.004. [DOI] [PubMed] [Google Scholar]
- [34].Chan RW, Ramsay EA, Cunningham CH, Plewes DB. Temporal stability of adaptive 3D radial MRI using multidimensional golden means. Magn Reson Med. 2009;61(2):354–363. doi: 10.1002/mrm.21837. [DOI] [PubMed] [Google Scholar]
- [35].Beaumont M, Lamalle L, Segebarth C, Barbier EL. Improved k-space trajectory measurement with signal shifting. Magn Reson Med. 2007 Jul;58:200–205. doi: 10.1002/mrm.21254. [DOI] [PubMed] [Google Scholar]
- [36].Duyn JH, Yang Y, Frank JA, van der Veen JW. Simple correction method for k-space trajectory deviations in MRI. J Magn Reson. 1998 May;132:150–153. doi: 10.1006/jmre.1998.1396. [DOI] [PubMed] [Google Scholar]
- [37].Fessler JA, Sutton BP. Nonuniform fast Fourier transforms using min-max interpolation. 2003 Feb;51:560–574. [Google Scholar]
- [38].Bydder M, Samsonov AA, Du J. Evaluation of optimal density weighting for regridding. Magn Reson Imaging. 2007;25(5):695–702. doi: 10.1016/j.mri.2006.09.021. [DOI] [PubMed] [Google Scholar]
- [39].Huang F, Vijayakumar S, Li Y, Hertel S, Duensing GR. A software channel compression technique for faster reconstruction with many channels. Magn Reson Imaging. 2008 Jan;26:133–141. doi: 10.1016/j.mri.2007.04.010. [DOI] [PubMed] [Google Scholar]
- [40].Walsh DO, Gmitro AF, Marcellin MW. Adaptive reconstruction of phased array MR imagery. Magn Reson Med. 2000 May;43:682–690. doi: 10.1002/(sici)1522-2594(200005)43:5<682::aid-mrm10>3.0.co;2-g. [DOI] [PubMed] [Google Scholar]
- [41].Griswold M, Walsh D, Heidemann R, Haase A, Jakob The use of an adaptive reconstruction for array coil sensitivity mapping and intensity normalization. Proc. Intl. Soc. Mag. Reson. Med. 10:2410–2002. [Google Scholar]
- [42].Noll D, Meyer C, Pauly J, Nishimura D, Macovski A. A homogeneity correction method for magnetic resonance imaging with time-varying gradients. IEEE Trans. Med. Imaging. 1991;10(4):629–637. doi: 10.1109/42.108599. [DOI] [PubMed] [Google Scholar]
- [43].Sutton BP, Noll DC, Fessler JA. Fast, iterative image reconstruction for MRI in the presence of field inhomogeneities. IEEE Trans Med Imaging. 2003 Feb;22:178–188. doi: 10.1109/tmi.2002.808360. [DOI] [PubMed] [Google Scholar]
- [44].Beatty P, Nishimura D, Pauly J. Rapid gridding reconstruction with a minimal oversampling ratio. IEEE Transactions on Medical Imaging. 2005;24(6):799–808. doi: 10.1109/TMI.2005.848376. [DOI] [PubMed] [Google Scholar]
- [45].Huang F, Chen Y, Yin W, Lin W, Ye X, Guo W, Reykowski A. A rapid and robust numerical algorithm for sensitivity encoding with sparsity constraints: self-feeding sparse SENSE. Magn Reson Med. 2010 Oct;64:1078–1088. doi: 10.1002/mrm.22504. [DOI] [PubMed] [Google Scholar]
- [46].Khare K, Hardy CJ, King KF, Turski PA, Marinelli L. Accelerated MR imaging using compressive sensing with no free parameters. Magn Reson Med. 2012 Jan; doi: 10.1002/mrm.24143. In Press; DOI: 10.1002/mrm.24143. [DOI] [PubMed] [Google Scholar]
- [47].Hernando D, Kellman P, Haldar JP, Z.-P. L. Robust water/fat separation in the presence of large field inhomogeneities using a graph cut algorithm. Magn Reson Med. 2010;63:79–90. doi: 10.1002/mrm.22177. [DOI] [PMC free article] [PubMed] [Google Scholar]
Associated Data
This section collects any data citations, data availability statements, or supplementary materials included in this article.


