

Abstract
Pluripotent and multipotent cells become increasingly lineage restricted through differentiation. Alterations to the cellular proteoglycan composition and structure should accompany these changes to influence cell proliferation, delineation of tissues and acquisition of cell migration capabilities. Retinoic acid plays an important role in pre-patterning of the early embryo. Retinoic acid can be used in vitro to induce differentiation, causing pluripotent and multipotent cells to become increasingly lineage restricted. We examined retinoic acid-induced changes in the cellular proteoglycan composition of the well-characterized teratocarcinoma line NCCIT. Our analysis revealed changes in the abundance of transcripts for genes encoding core proteins, enzymes that are responsible for early and late linkage region biosynthesis, as well as enzymes for GAG chain extension and modification. Transcript levels for genes encoding core proteins used as backbones for polysaccharide synthesis revealed highly significant increases in expression of lumican and decorin, 1500-fold and 2800-fold, respectively. Similarly, glypican 3, glypican 5, versican and glypican 6 showed increases between 5 and 70-fold. Significant decreases in biglycan, serglycin, glypican 4, aggrecan, neurocan, CD74 and glypican 1 were observed. Disaccharide analysis of the glycans in heparin/heparan sulfate and chondroitin/dermatan sulfate revealed retinoic acid-induced changes restricted to chondroitin/dermatan sulfate glycans. Our study provides the first detailed analysis of changes in the glycosaminoglycan profile of human pluripotent cells upon treatment with the retinoic acid morphogen.
Keywords: glycomics, teratocarcinoma, pluriotent, glycosaminoglycans
Introduction
New strategies in medical therapies, such as induced differentiation of cancer cells to block metastasis, require the ability to redirect cell behavior. In addition, optimizing the efficacy of cell-based therapies in a multicellular environment will require an understanding of how the cellular glycome can respond. In disease states, an inappropriate glycome may also provide abnormal cellular capabilities for a given tissue environment by facilitating new signaling pathways. Systematic analysis can help to provide a database of responses that can predict cellular outcomes.
The tissue multicellular environment is complex, requiring internal epigenome, transcriptome and proteome changes that are coordinated to remodel the extracellular glycome. Glycosaminoglycans (GAGs) localize mainly to the external membrane of cells and reside within the extracellular matrix. They are attached to core proteins to form cellular proteoglycans (PGs) that are critical for a variety of cell signaling and migration roles as well as mammalian organ development [1,2]. GAGs therefore act as molecular co-receptors in cell signaling for cell–cell interactions and as regulators of cell adhesion, cell growth and differentiation [2,3]. By defining temporal changes in GAG profiles on cells during cellular quiescence, proliferation, and lineage differentiation, we refine our global view of development in the multicellular environment. This is particularly critical for novel therapeutic applications with stem cells or tissue progenitors as well as efforts to optimize the in vitro stem cell niche for cell, tissue and organ based therapies [2,3].
Teratocarcinomas are malignant germ cell tumors consisting of embryonal carcinoma (EC) cells. They are malignant equivalents of normal pluripotent embryonic cells from the pre-implantation stage of embryos [4,5]. Single embryonal carcinoma cells from teratocarcinomas develop into tumors that contain a mixed population of more than two dozen well-differentiated adult tissues from all three germ layers, including brain, muscle, bone, teeth, bone marrow, eyes, secretory glands, skin and intestine, as well as placental and yolk sac tissue. The ability of in vitro cultured embryonal carcinoma cells to form organized structures that resemble the developing embryo has promoted their use as a model system for the study of early embryonic development [6]. The widely studied NCCIT cell line, derived from a mediastinal mixed germ cell tumor, has been shown to differentiate into derivatives of all three embryonic germ layers (ectoderm, mesoderm, and endoderm) and extraembryonic cell lineages [7]. The NCCIT line is responsive to retinoic acid (RA), inducing cellular differentiation accompanied by the disappearance of oligosaccharide surface antigens associated with pluripotency [8]. For these reasons, coupled with their ease of manipulation, NCCIT cells are a useful model to quantify the concomitant changes to the glycan profile upon RA treatment to reveal promotive and/or restrictive changes associated with the action of this morphogen for inducing loss of pluripotency and increased lineage restriction.
The biosynthetic pathways and enzymes involved in GAG biosynthesis are well defined and the enzymes and their isoforms have been found to be differentially expressed in various cell types [9–12]. GAGs are linear, sulfated and highly charged heterogeneous polysaccharides consisting of a repeating disaccharide unit. Polysaccharide length and fine structure, in addition to the placement of protein-binding domains, are critical to the functioning of PGs in cell signaling. Four distinct types of GAGs are present in eukaryotic cells: chondroitin sulfate/dermatan sulfate (CS/DS), heparin/heparan sulfate (HP/HS), keratan sulfate, and hyaluronan. Modification of GAG profiles with RA treatment to induce the loss of pluripotency and lineage commitment has not been previously studied. Such information on a well-studied morphogen is vital to obtain a more complete understanding of the underlying cellular signaling pathways that are immediately affected. As such, the NCCIT cell line affords an important model to discern GAG changes accompanying pluripotency loss and commitment to multi-lineage differentiation. In the current study, we have analyzed changes to the pluripotent cellular glycome that resulted from RA-induced differentiation. Changes in gene transcript and protein abundance for GAG biosynthesis pathways were quantified and examined using qRT-PCR and Western analysis, respectively. Disaccharide compositional analysis, utilizing liquid chromatography/mass spectrometry (LC/MS), was used to determine changes in GAG chain modifications for CS/DS and HP/HS pathways in response to RA-induced differentiation and concurrent loss of pluripotency.
Results
Changes in cell population upon RA treatment
NCCIT teratocarcinoma cells were treated with RA (10 μM) for up to 40 days to induce differentiation. As observed previously with RA treatment [8], growth of NCCIT cells slow in response, (Fig. 1A) and differentiation follows. NCCIT cells are known to undergo multilineage differentiation upon treatment with RA [8, 13–15]. Expression of markers for pluripotency, along with lineage-specific markers were monitored using qRT-PCR (Table 1 and Supplemental Table 1) and western blot (data not shown). In addition, immunofluorescence (Fig. 2) was used to monitor differentiation towards neuronal and glial lineages. Samples for qRT-PCR were taken at days 0, 14, 21, 29 and 40 days of RA treatment. Results for qRT-PCR reported are from day 40 of RA treatment. The rounded morphology of EC cells is altered drastically upon differentiation (Fig. 1B). We observed flattened cells, including some with branched elongated cytoplasmic processes typical of neuronal morphology. Changes in morphology were accompanied by reduced expression of Oct-3/4 (3-fold) (Fig. 2 and Table 1), which has been shown to be a pluripotency marker [3]. The expression of Nestin, a marker for neural differentiation [16], increased 3-fold suggesting proliferation of neural progenitor cells. There were no changes in expression of beta-III-tubulin (mature neuronal marker) or Olig2 (oligodendrocyte marker) observed, whereas expression of glial fibrillary acidic protein (GFAP), a type III intermediate filament protein common to cells of the central nervous system (particularly astrocytes) was not detected. Expression of keratin associated protein 3-2 remained unchanged. Expression of an example marker of mesodermal origin RET9 decreased 6-fold. Expression of MYH6 was low at the beginning of the treatment and was not detectable later during differentiation. Expression of markers for endodermal lineages such as PDX1 increased 2-fold with no change in expression of AFP. The most dramatic increase was observed in expression of PITX2 (ectodermal marker) and HOXA5 (endodermal marker), 25- and 14000-fold respectively. Our analysis indicates that RA treatment was redirecting cells from pluripotency and allowing for multiple differentiation pathways to execute. NCCIT cells treated in RA for 20 days were used for transcript analysis of GAG biosynthetic enzymes, as complete loss of pluripotency was observed at this point.
Figure 1. Differentiation of NCCIT cells by RA.
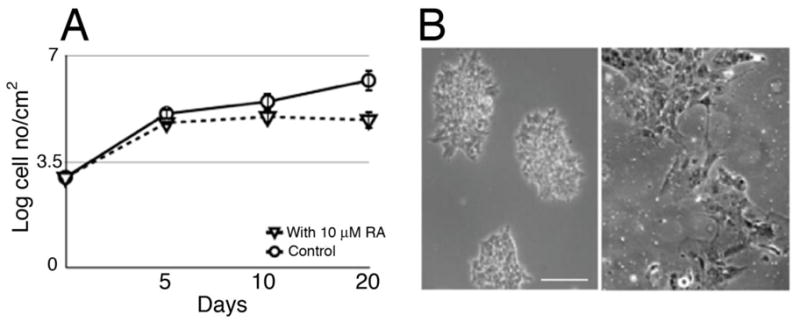
A. Growth curves of untreated and RA treated NCCIT cells. Growth retardation of cells treated with 10-μM RA is evident at day 5. B. Left panel shows phase contrast image of NCCIT cells unexposed to RA. Right panel shows phase contrast image of NCCIT cells after 20 days RA treatment, revealing distinct morphological changes consistent with differentiation.
TABLE I.
Changes in Expression of Lineage Specific Markers in NCCIT cells upon RA treatment
| Markers | Fold change, RA/Control* | Markers | Fold change, RA/Control* |
|---|---|---|---|
| OCT3/4 | −3.0 | KRTAP3-2 | 1.0 |
| Nestin | 3.0 | MYH6 | Decreased*** |
| Beta-III-Tubulin | 1.0 | RET9 | −6.0 |
| Olig2 | 1.0 | HOXA5 | 14000 |
| GFAP | n/a** | AFP | 1.0 |
| PTX2 | 25 | PDX1 | 2.0 |
Fold change of transcript abundance for NCCIT-RA compared to untreated NCCIT cells. A fold change <1 indicates that the transcript is more abundant in the control cells than in the RA-treated population and a fold change >1 indicates that the transcript is more abundant in the treated cells than in the controls. A fold change equals to 1 indicates no changes in the transcript level upon RA treatment.
Expression was not detected at any time point
Expression was not detected at Day 40 of RA treatment
Figure 2. Expression of the markers associated with Neural Lineage in differentiated NCCIT cells.

Immunofluorescence of NCCIT cells at 0, 18 and 29 days of RA treatment. RA-dependent decrease in expression of Oct-3/4 and increased expression in Nestin and beta-III-tubulin is observed. Expression of glial associated proteins GFAP was undetectable. Actin staining is shown as a positive control.
Changes in expression of core proteins carrying GAG chains upon RA treatment
The transcript abundance of genes encoding GAG core proteins were examined in RA-treated (day 20) versus untreated control NCCIT cells and fold-change determined (Table II and Fig. 3A). Levels of selected core proteins were also examined using Western blot analysis (Fig. 3B). The transcript levels for core proteins for CS/DS were examined, revealing that lumican (1500-fold) and decorin (2800-fold) increased, while fibromodulin, procollagen and versican showed no change in transcript level. Decreased expression of transcripts for CS/DS included biglycan (48-fold), aggrecan and neurocan (each 10-fold) as well as neuroglycan, bamacan, brevican, thrombomodulin, epican (CD44) and macrophage migration inhibitory factor (CD74) (range of 2–8 fold). Expression level of HS core proteins changed in RA-treated NCCIT cells in comparison to untreated NCCIT cells. In RA-treated NCCIT cells, elevated message levels for glypican 5 (68-fold), glypican 3 (12-fold) and glypican 6 (8-fold) were observed. No change in expression for agrin, syndecan 1, syndecan-2 or syndecan 4 was detected. Significant reductions in serglycin (17-fold) and glypican 4 (21-fold) messages were observed, as well as minor reductions (range of 2–6 fold) for perlecan, syndecan 3, glypican 1 and glypican 2. We next examined core proteins to determine if the magnitude of changes in their transcript levels corresponded to a concomitant increase in their expressed protein levels. Western blotting analysis (Fig. 3B) demonstrated the most dramatic changes for expression of lumican, decorin and glypican-5. Lumican and decorin, which each displayed thousand-fold increases in transcript levels, were of particular interest. Immunoblotting confirmed a steady-state increase in protein levels for production of lumican and decorin in RA-treated NCCIT cells. In contrast, expression of glypican-5 fluctuated throughout the course of RA treatment, decreasing at day 4 and day 15 of the treatment and increasing at day 9. Biglycan proteins remained at an undetectable level in pluripotent NCCIT cells and RA treated cells (Fig. 3B). Recombinant human biglycan was used as a positive control to confirm that the Western had worked, and that the negative results observed were reliable (data not shown).
TABLE II.
Change in Expression of Core Proteins of CS/DS and HP/HS Upon RA Treatment.
| Protein | Fold change, RA/Control* | GAGs attached |
|---|---|---|
| Lumican | 1500 | CS/KS |
| Fibromodulin | 1.0 | CS/KS |
| Aggrecan 1 (CSPG1) | −10 | CS |
| Versican (CSPG2) | 1.0 | CS |
| Neurocan (CSPG3) | −10 | CS |
| NG2 (CSPG4) | 1.0 | CS |
| Neuroglycan (CSPG5) | −2.0 | CS |
| Bamacan | −2.0 | CS |
| Brevican (CSPG7) | −2.0 | CS |
| Decorin | 2800 | CS/DS |
| Biglycan | −48 | CS/DS |
| Procollagen 1Xa2 | 1.0 | CS |
| Thrombomodulin | −4.4 | CS |
| Epican (CD44) | −5.1 | CS |
| CD74 | −7.4 | CS |
| Serglycin | −17 | HP/CSE |
| Perlecan | −2.0 | HS/CS |
| Agrin | 1.0 | HS |
| Syndecan 1 | 1.0 | HS |
| Syndecan 2 (HSPG1) | 1.0 | HS |
| Syndecan 3 | −2.0 | HS |
| Syndecan 4 | 1.0 | HS |
| Glypican 1 | −3.5 | HS |
| Glypican 2 (cerebroglycan) | −6.4 | HS |
| Glypican 3 | 12 | HS |
| Glypican 4 | −21 | HS |
| Glypican 5 | 68 | HS |
| Glypican 6 | 8.0 | HS |
Fold change of transcript abundance for NCCIT-RA compared to untreated NCCIT cells. A fold change <1 indicates that the transcript is more abundant in the control cells than in the RA-treated population and a fold change >1 indicates that the transcript is more abundant in the treated cells than in the controls. A fold change equals to 1 indicates no changes in the transcript level upon RA treatment.
Figure 3. Expression of Core Proteins of CS/DS and HP/HS.


A. The relative transcript abundance of CS/DS and HP/HS core proteins as normalized to β-actin. Relative transcript abundance for NCCIT control untreated pluripotent cells and NCCIT RA-differentiated cells plotted on a log10 scale for each gene assayed. B. Change in expression level of lumican, decorin, glypican-5 and biglycan in NCCIT cells after differentiation detected by Western blotting. Arrows to the left of the panel indicate an increase in protein expression following RA treatment, while a horizontal bar indicates no change with treatment and “N/A” indicated that no protein was detected with the selected antibody. γ-tubulin is shown as a loading control.
RA effects on expression levels of enzymes involved in linkage region biosynthesis and chain extension
Pathways for early and late enzymatic reactions leading to the synthesis of CS/DS and HP/HS GAG chains were examined. Early stage biosynthesis of both CS/DS and HP/HS occurs by initialization of GAG chains on core proteins within shared and distinct branched pathways (Fig. 4A). Several genes encode enzymes that regulate the early steps of CS/DS and HP/HS biosynthesis. These include xylosyl transferases (XYLT1 and XYLT2), β4-galactosyltransferase (β4GALT7), β3-galactosyltransferase (β3GALT6), and β3-glucuronosyltransferase (β3GAT3). The biosynthesis of CS/DS and HP/HS diverge in the chain extension and modification steps. For HP/HS linkage region biosynthesis and chain extension, α-N-acetylglucosaminyltransferases (EXTL2, EXTL3), α-N-acetylglucosaminyl-β-glucuronosyl transferases (EXT1, EXT2), and the combined action of the enzymes EXT1/EXT2, EXTL1, and EXTL3 are required. CS/DS linkage region biosynthesis and extension is committed by the activity of β-4-N-acetylgalactosamine transferases (CSGALNACTs) and chondroitin synthases (CHSY1, CHPF1, CHPF2, CHSY3). Relative transcript abundance was examined as a function of β-actin change (RA/Control, untreated) (Table III and Fig. 4B). Essentially no significant changes were observed in expression levels of enzymes involved in the common linkage region sequences. In the HP/HS pathway, only EXTL1 displayed a large change in expression, decreasing approximately 19-fold in RA-treated cells. A small, but statistically significant change in EXT2 (~2-fold) was detected, but no changes were detected in the levels of EXT1, EXTL2, or EXTL3. Examination of the expression of genes encoding the enzymes involved in the linkage region synthesis, chain initiation and extension of CS/DS revealed an approximate 8-fold decrease in transcript level of CSGALNACT1 in RA-treated cells. Limited (2-fold) changes in CHSY1, CHPF1, CHSY3 and CHPF2 were observed, and modest changes in transcript levels of dermatan sulfate epimerase (DSE1 and DSE2), which converts glucuronic acid (GlcA) to iduronic acid (IdoA) in DS biosynthesis, were noted.
Figure 4. HP/HS and CS/DS biosynthetic pathway.

A. Graphic diagram of GAG core tetrasaccharide biosynthesis showing the branch in formation of HP/HS and CS/DS families. The Ser/Thr-containing polypeptide core protein is glycosylated and modified through ten enzymatic reactions occurring in the endoplasmic reticulum and Golgi. Numbers on steps correspond to the reactions catalyzed by enzymes coded by (1): XYLT1, XYLT2, (2): B4GALT7, (3): B3GALT6, (4): B3GALT3, (5): EXTL2, EXTL3, (6): EXT1, EXT2, (7): EXT1, EXT2, EXTL1, EXTL3, (8): CSGALNACT1, CSGALNACT2, (9): CHSY1, CHPF1, CHSY3, CHPF2, and (10): DSE1, DSE2. B. Relative transcript levels for genes coding CS/DS and HP/HS chain initiation and elongation enzymes. Plotted as described for Fig 3A.
TABLE III.
Change in Expression of genes coding for CS/DS and HP/HS Biosynthetic Enzymes in NCCIT Control Versus RA-differentiated NCCIT Cells.
| Gene | Fold change, RA/Control* | Gene | Fold change, RA/Control* | Gene | Fold change, RA/Control* |
|---|---|---|---|---|---|
| XYLT1 | 1.0 | EXT1 | 1.0 | CHSY1 | −2.0 |
| XYLT2 | 1.0 | EXT2 | −2.0 | CHPF1 | 2.0 |
| B4GALT7 | 1.0 | EXTL1 | −19 | CHSY3 | −2.0 |
| B3GALT6 | 1.0 | EXTL3 | 1.0 | CHPF2 | 2.0 |
| B3GAT3 | 1.0 | CSGALNACT1 | −8.0 | DSE1 | 2.0 |
| EXTL2 | 1.0 | CSGALNACT2 | 1.0 | DSE2 | −2.0 |
Fold change of transcript abundance for NCCIT-RA compared to untreated NCCIT cells. A fold change <1 indicates that the transcript is more abundant in the control cells than in the RA-treated population and a fold change >1 indicates that the transcript is more abundant in the treated cells than in the controls. A fold change equals to 1 indicates no changes in the transcript level upon RA treatment.
Effect of RA on expression of genes for enzymes involved in HP/HS and CS/DS GAG chain modifications
The enzymatic pathways for HP/HS and CS/DS are shown in Figs. 5A and 6A, respectively. The combined action of N-deacetylase-N-sulfotransferases (NDSTs), C5-epimerase (GLCE), 2-O-sulfotransferase (HS2ST1), 6-O-sulfotransferases (HS6STs) and 3-O-sulfotransferases (HS3STs) are responsible for modification of HP/HS repeating units. We observed increased transcript levels for generally all enzymes involved in chain modification of HP/HS except for a few of the seven HS3ST isoforms assayed (Table IV and Fig. 5B). Of the four isoforms of NDST, the levels of NDST3 and NDST4 transcripts increased 8-fold and 4-fold, respectively. Transcript levels for GLCE, HS2ST1, HS6ST1 and HS6ST2 isoforms, and HS3ST1 increased slightly (< 5-fold) in RA-treated cells. However, a large increase in transcript abundance of ~20-fold was detected for the HS6ST3 isoform following treatment with RA. Transcripts for HS3ST3B1, HS3ST4 and HS3ST5 isoforms decreased marginally in RA treated cells. In contrast, RA treatment resulted in fewer changes to transcript levels of genes involved in the modification of CS/DS GAG repeating units (Table V and Fig. 6B). Introduction of the sulfation pattern characteristic of CS and DS requires chondroitin 4-O-sulfotransferases (CHST11 and CHST12), a dermatan 4-O-sulfotransferase (D4ST1), chondroitin uronosyl sulfotransferase (UST), chondroitin 6-O-sulfotransferases (CHST3 and CHST7), and N-acetylgalactosamine 4S, 6S transferase (CHST15). A few of the genes displayed limited changes (< 5-fold) in expression in RA treated cells, compared to control untreated NCCIT cells. However, an approximate 8-fold decrease in transcript abundance was observed for CHST15 following RA treatment.
Figure 5. HP/HS Chain Modifications.

A. Graphic diagram of the modification of the repeating units in the HP/HS chain. Numbers on steps correspond to the reactions catalyzed by enzymes coded by (1): NDST1, NDST2, NDST3, NDST4, (2): GLCE, (3): HST2T1, (4): HS6ST1, HS6ST2, HS6ST3, and (5): HS3ST1, HS3ST2, HS3ST3A1, HS3ST3B1, HS3ST4, HS3ST5, HS3ST6. B. Relative transcript abundance for genes involved in HP/HS chain modifications for RA-treated and control NCCIT cells. Plotted as described for Fig 3A. Multiple names for an enzymatic step are tissue specific isoforms.
Figure 6. CS/DS Synthesis and Modifications.

A. Graphic diagram of the modification of the repeating units of CS/DS. Numbers on steps correspond to the reactions catalyzed by enzymes coded by (1): CHST11, CHST12, (2): D4ST1, (3): UST, (4): CHST3, CHST7, and (5): CHST15. B. Relative transcript abundance for genes involved in CS/DS chain modifications for RA-treated and control NCCIT cells. Multiple names for an enzymatic step are tissue specific isoforms.
TABLE IV.
Change in Expression of genes coding for HP/HS Chain Modification Enzymes in NCCIT Control and RA-Treated Cells.
| Gene | Fold change, RA/Control* | Gene | Fold change, RA/Control* | Gene | Fold change, RA/Control* |
|---|---|---|---|---|---|
| NDST1 | 1.0 | HS2ST1 | 2.6 | HS3ST2 | 1.0 |
| NDST2 | 1.0 | HS6ST1 | 2.2 | HS3ST3B1** | −2.2 |
| NDST3 | 8.0 | HS6ST2 | 3.4 | HS3ST4 | −3.5 |
| NDST4 | 4.0 | HS6ST3 | 20 | HS3ST5 | −3.0 |
| GLCE | 2.5 | HS3ST1 | 2.5 | HS3ST6 | −2.0 |
Fold change of transcript abundance for NCCIT-RA compared to untreated NCCIT cells. A fold change <1 indicates that the transcript is more abundant in the control cells than in the RA-treated population and a fold change >1 indicates that the transcript is more abundant in the treated cells than in the controls. A fold change equals to 1 indicates no changes in the transcript level upon RA treatment.
Transcript level for HS3ST3A1 was not assayed
TABLE V.
Change in Expression of genes coding for CS/DS Chain Modification Enzymes in NCCIT Control and RA-Treated Cells.
| Gene | Fold change, RA/Control* | Gene | Fold change, RA/Control* |
|---|---|---|---|
| CHST11 | 2.4 | CHST3 | 3.4 |
| CHST12 | 1.0 | CHST7 | −4.3 |
| D4ST1 | 1.0 | CHST15 | −7.9 |
| UST | −2.2 |
Fold change of transcript abundance for NCCIT-RA compared to untreated NCCIT cells. A fold change <1 indicates that the transcript is more abundant in the control cells than in the RA-treated population and a fold change >1 indicates that the transcript is more abundant in the treated cells than in the controls. A fold change equals to 1 indicates no changes in the transcript level upon RA treatment.
Disaccharide analysis of GAGs from untreated pluripotent NCCIT and RA-induced cell derivatives
Compositional analysis of disaccharides was examined to provide detailed structural information on the appearance of GAG chain variations. Cell-associated GAGs were isolated from untreated NCCIT cells and RA-treated differentiated NCCIT cell population at 4, 7, 15 and 25 days after the start of treatment. Isolated GAGs were then digested with selected polysaccharide lyases (heparin lyase I-III and chondroitin lyases ACII and ABC) to obtain disaccharides for LC-MS analysis of HP/HS and CS/DS. Disaccharide analysis of HP/HS revealed the presence of two different disaccharide components comprising the HP/HS GAGs in the untreated pluripotent NCCIT cells. Nonsulfated (0S) HP/HS disaccharide was the major component of NCCIT cells with 6S being present in much smaller amounts. The disaccharide composition remained unchanged with RA treatment (Fig. 7A and Supplemental Fig. 1 and 2). CS/DS disaccharide analysis revealed that 4S comprised nearly 98%, with only limited amounts of detectable 6S disaccharide. The 4S was also the major disaccharide following RA treatment, but a slight drop in the amount of 6S disaccharide occurred concomitant with the appearance of 4S6S disaccharides (Fig. 7B and Supplemental Fig. 3 and 4). Thus, RA treatment of NCCIT cells results in slightly modified CS/DS GAG composition but no detectable changes in HP/HS GAG composition.
Figure 7. Changes in Glycan Composition of NCCIT Cells During Differentiation.

A. Levels of HP/HS disaccharides at various time points along RA treatment of NCCIT cells by mole percent. Dark grey bars represent 0S disaccharides and light grey bars represent 6S disaccharides. B. Levels of CS/DS disaccharides at various time points along RA treatment of NCCIT cells by mole percent. Black bars represent 6S disaccharides, dark grey bars represent 4S disaccharides, and light grey bars represent 4S6S disaccharides. See Supplemental Fig. 1–4 presenting the LC-MS data on which Fig. 6 is based.
Discussion
How GAGs contribute to developmental regulation of cell signaling upon interaction with morphogens remains an important unanswered question that has repercussions in development and medicine. NCCIT cells, like pluripotent embryonic stem cells, have the ability to differentiate into representatives of all germ layers. RA treatment directs these cells along multiple lineages, reflective of its role in early tissue formation. Our detailed analysis of the cellular glycome of the pluripotent teratocarcinoma line NCCIT upon RA-induced treatment reveals changes at the mRNA and protein levels. Our results provide evidence for quantitative transcriptional changes to core proteins and enzymes involved in early to late linkage region biosynthesis, chain extension, and chain modification. In addition, we performed disaccharide composition analysis of the CS/DS and HP/HS GAGs from pluripotent NCCIT and its RA-treated derivatives. Our analyses provide the first GAG profile for the action of the RA morphogen that drives loss of pluripotency and the remodeling of the cellular glycome that accompanies multi-lineage differentiation.
Our knowledge of the biological functions of core proteins remains in its infancy. However, it is known that these proteins are of great interest in growth regulation, cell attachment, cell-cell interaction and cell motility [17,18]. In the CS/DS PG core proteins, RA-induced differentiation of NCCIT resulted in a dramatic increase in transcript and protein levels for the decorin core protein. Decorin plays a role in axon formation and can also suppress the expression of inhibitory CS PGs such as neurocan, brevican, phosphacan and NG2 to promote axonal growth [19,20]. The ability to suppress inhibitory pathways for differentiation while initiating or promoting differentiation suggests dual roles for remodeling. In cancer, low levels of decorin are associated with poor prognosis and large tumor size [21]. Biglycan has been shown to have inhibitory effects on axonal growth [22] and on the growth of pancreatic cancer cell lines through G1-phase cell cycle arrest [23]. We observed a decrease in biglycan transcript level concomitant with increased decorin. However biglycan protein expression was not detected at any time point. That could suggest that the baseline quantity of protein is low, which makes detection upon differentiation challenging. Lumican expression increased as a result of RA treatment and has been shown to play a role in slowing the growth of retinal cells of neural epithelial origin. Its high expression may therefore facilitate differentiation through cell cycle changes. Similar to decorin in breast cancer, low levels of lumican are associated with poor prognosis with large tumor size, negative estrogen receptor and progesterone receptor status and increased inflammatory response [21]. Although not as dramatic as the changes in HSPG core proteins, we observed increased glypican 5 transcript levels upon differentiation. However the increased transcript level did not seem to affect protein expression, as glypican-5 expression fluctuated throughout the RA treatment period with a final decrease observed on day 15 of the treatment. Glypicans are thought to play an important role in development and differentiation through the interaction with growth factors and morphogens [24]. Overexpression of glypican 5 increases cell proliferation by potentiating basic fibroblast growth factor (FGF), hepatocyte growth factor and Wnt1A, resulting in mesodermal inducing effects [25]. Glypican 5 is expressed in adult brain tissue localized in neurons as well as in fetal brain, lung and liver tissues. Glypican 3 was also overexpressed in RA induced differentiated NCCIT cells and has been implicated in cancers by providing FGF and bone morphogenic protein-7, as well as stimulating Wnt signaling in hepatocarcinomas [26]. It also inhibits hepatomas and is silenced in mesotheliomas and ovarian and breast cancers [27,28]. Glypican 3 may exhibit these effects through its HS chains [29] or core protein [27,30].
Chain composition and length are known to be important effectors of cell signaling through mediation of interactions of various growth factors and chemokines. Upon loss of pluripotency by RA treatment, we observed several changes in the transcript abundances of NCCIT genes encoding enzymes involved in early to late linkage region biosynthesis and chain extension. For CS/DS and HP/HS chain initiation and elongation following differentiation, we observed overall no dramatic changes in transcript abundance. Two exceptions to this are EXTL1 and CSGALNACT1, which play roles in chain elongation of HS and CS/DS respectively, both of which showed changes in message levels. HS chain modification enzymes function as multiple tissue-specific isoforms, which are responsible for the heterogeneous structure of HS. We found that isoforms coded by NDST3 and NDST4 were upregulated. These isoforms have been shown to be expressed during embryonal development, and it has been suggested that NDST3 may play a role in development of brain, liver, kidney and heart. Both isozymes have restricted distribution in adult organisms. In the adult mouse, NDST3 is found in the brain and heart. A small amount of NDST4 is found in brain tissue [31–33]. C5-Epimerase (GLCE) and HS2ST1 are thought to work in concert to produce HP, an oversulfated variant of HS found in mast cells. HP uses serglycin as a core protein. Following differentiation, the transcript levels for GLCE and HS2ST1 increased only slightly and transcripts for serglycin declined. This indicates that overall HP production does not change during treatment of NCCIT cells with RA. HS6ST3 is the only one of the three isoforms of the 6-O-sulfotranferases that had an ample increase in transcript abundance following RA treatment. It has broad tissue distribution, but its subspecificity is not well understood [34]. Only slight changes in HS3ST isoform transcript levels were observed. The HS3ST isoforms generate subtle modifications in HS structure resulting in the formation of recurring pentasaccharide patterns in the chain structure characteristic of HP. This pentasaccharide sequence is the source of the anticoagulant activity of HP. Even though transcripts for all of the sulfotransferases were detected in NCCIT cells during their differentiation, disaccharide compositions of HS chains were primarily non-sulfated and showed little complexity. Taken together, our findings suggest that transcripts of the enzymes involved in HP/HS and CS/DS biosynthesis are produced at a steady-state level. The fluctuation in factors such as the level of transcripts encoding core proteins does not carry over into cell-associated GAG structural changes. The same disaccharide composition was observed throughout the entire treatment and is consistent with the lack of change in the transcript levels for the majority of HP/HS biosynthetic enzymes. Transcript abundance of the gene encoding the CS/DS chain modification enzyme GalNac4S-6ST dropped upon differentiation, even though disaccharide analyses revealed a slight increase in 4S6S structural disaccharides in CS/DS glycans. This result could be explained by our focus upon cell-associated CS/DS chains, whereas some portion of GAG chains are associated with core proteins that get secreted into the media. This result could also suggest that other factors or pathways may contribute to this structural profile at the glycome level.
Our analysis of HP/HS and CS/DS disaccharides in the teratocarcinoma line NCCIT indicates significant changes occur in biosynthesis of specific core proteins of CS/DS and HSPGs. This may in part reflect neuronal commitment, which occurred in a subpopulation of our cells and which has been shown to involve these changes. However, the detected changes in actual disaccharide composition of CS/DS and HS/HP were insignificant. The HP/HS and CS/DS GAGs examined here are known to be important in many signaling pathways such as FGF, Wnt, BMP, and Hedgehog [3,35,36]. Since cell-associated GAG was the only form analyzed in this study, in future experiments it would worth analyzing the structure and composition of GAG chains from PGs that are secreted into the media. This study did not examine whether changes in hyaluronic acid and keratan sulfate composition might also contribute to RA-induced morphogen effects on differentiation of NCCIT cells. Keratan sulfate has specific distribution, found in such tissues as the cornea and cartilage. However, not much is known about its role in cell development [37,38]. Hyaluronan has been shown to be important in morphogenesis via its physical properties as well as through signaling pathways including CD44. Hyaluronan is crucial in early morphogenesis of the prostate and kidney and in formation and modeling of blood vessels [39,40]. The contribution of hyaluronan and keratan sulfate remains to be determined in future studies.
In summary, our analysis of GAG profiles of pluripotent NCCIT and RA-treated cells reveals that suppression of inhibitory pathways is accompanied by the activation of differentiation-enhancing pathways. How significant the subtle changes we detected are to this remodeling is unknown at this time. It is possible that multiple glycocalyx options are initiated that are then refined through environmental reinforcement. Future analysis of these questions along with comparative analysis of GAG profiles induced by use of other morphogens will help to clarify the mechanisms. Such analyses combined with transcriptome, epigenome and proteome profiles will help reveal the complex circuitry regulating cell fate with environmental influences for pluripotent and differentiated cell states. We used NCCIT cells specifically because of their ability to differentiate along multiple lineages as a model for pluripotent cells, however it would be interesting to analyze pluripotent cells which have differentiated into various lineages in order to obtain pure cell populations for GAG profiling, and to compare those results to ours. As we better understand the precise contribution of GAGs to signaling pathways, such analyses will be critical to predict, track and drive cell fate. This capability is important not only for in vivo cell-based therapies, but also in vitro to improve the artificial cell environment in order to promote cell lineages as well as assembly of more complex multi-dimensional tissue and organ structures [41].
Materials and Methods
NCCIT Cell Culture and RA Treatment
Teratocarcinoma cell line NCCIT (ATCC, Manassas, VA) was grown in RPMI-1640 medium (Mediatech, Manassas, VA) containing 10% fetal bovine serum (Life Technologies, Grand Island, NY) and 100 U/mL penicillin and streptomycin (Invitrogen) and cultured at 37°C in a humidified atmosphere with 5% CO2. NCCIT cell differentiation was induced by adding 10 μM trans-RA (Sigma-Aldrich, St. Louis, MO) every three days for up to 40 days.
Total RNA isolation, cDNA synthesis and qRT-PCR reactions
Four biological replicates of untreated and RA-differentiated NCCIT cell samples were harvested after 9 and 20 days of growth, flash frozen in liquid nitrogen and stored at −80 C until use. For measurement of PG-related gene expression levels, RNA was isolated from cell lysates on day 20 of differentiation using the RNeasy Plus kit (Qiagen, Valencia, CA) and cDNA synthesis was performed using Superscript III First Strand Synthesis (Invitrogen) as previously described [42]. The qRT-PCR reactions, done in triplicate for each gene analyzed, cycling conditions and analysis of amplimer products were performed as described. Briefly, reactions contained 1.25 μL of diluted cDNA template (1:10), 1.25 μL of primer pair mix (125 μM final concentration) and 2.5 μL iQ SYBR Green Supermix (BioRad, Hercules, CA) added to 96 well microtiter plates. Primers for the control gene, β-actin (NM 001101), were included on each plate to control for run variation and to normalize individual gene expression. Primer pairs for GAG-related genes were designed within a single exon [43,44] and primer design validation done previously using the standard curve method [43,45]. Primer sequences and accession numbers for genes can be found in Supplemental Table I.
Calculation of relative gene expression levels and statistical analysis
An average of the triplicate Ct values for each gene was determined and the standard deviation calculated. Samples were rerun if the acceptable standard deviation value of > 0.5 Ct units was exceeded. The logarithmic average Ct value for the control gene and each tested gene was converted to a linear value by the equation 2−Ct. Converted values were normalized to -actin by dividing individual gene value by control gene value. Normalized values were scaled so that genes below the level of detection were given a value of 1 × 10⁻⁶, and this value was used as the lower limit on histograms. A non-parametric Mann-Whitney test (GraphPad InStat3, v3.1) was used to determine statistically significant changes (p < 0.05) in transcript abundance between undifferentiated and RA-treated samples. Fold change was calculated by dividing normalized values of tested genes in RA-treated cells by those in control, untreated cells.
Protein isolation, quantification and immunoblotting
Cells were lysed in Nonidet-P40 lysis buffer (Boston Bioproducts, Ashland, MA) containing a cocktail of protease and phosphatase inhibitors (Pierce, Rockford, IL,) on ice for 30 min. Protein concentration was determined using the BCA assay (Pierce, 23227). Approximately 40 μg of total protein was loaded and separated on 4–20% gradient polyacrylamide gel. After transfer to a PVDF membrane, proteins of interest were detected using relevant primary and HRP-conjugated secondary antibodies followed by chemiluminescent (Pierce, Super Signal West Pico ECL substrate) exposure on high performance chemiluminescence film (GE Healthcare, Little Chalfont, UK, Amersham Hyperfilm ECL). Primary antibodies used were -tubulin (Sigma Aldrich, T3320), decorin (Abnova, Walnut, CA, H00001634-B01P), lumican (Abnova, H00004060-D01P), biglycan (Abnova, H00000633-D01P), and glypican-5 (Santa Cruz Biotechnology INC., Santa Cruz, CA, sc-84278).
Immunofluorescence
NCCIT cells were grown in Lab-Tek chamber slides and treated with 10 μM trans-RA every 3 days. Media from cells on days 0, 18 and 29 of RA treatment was washed off and cells were fixed with 4% paraformaldehyde. Cells were blocked with DPBS-Triton 100-X solution supplemented with 5% Bovine Serum Albumin (BSA). They were incubated overnight at 4 °C with primary antibody diluted in DPBS-Triton X-100 solution supplemented with 1% BSA. The following day after several washes with DPBS, cells were incubated with secondary antibody (Goat anti-mouse Alexa Fluor 488, goat anti-rabbit Alexa Fluor 647, Life Technologies, A11001, A21244) diluted in DPBS-Triton X-100 solution supplemented with 1% BSA at room temperature for 1 hour. After several washes with DPBS cells were stained with Hoechst 33342 for 5 min at room temperature. After several washes slides were detached from chambers and incubated overnight with ProLong Gold antifade reagent covered with cover slide. The following day slides were sealed and analyzed with a Zeiss 510 Meta multiphoton confocal microscope. Primary antibodies used were Oct3/4 (BD Biosciences, Franklin Lakes, NJ, 611202), Nestin (Abcam, Boston, MA, ab6320), beta-III-tubulin (Abcam, ab7751), GFAP (Millipore, Billerica, MA H00001634-B01P). Alexa Fluor 488 conjugated phalloidin stain was used for actin staining (Invitrogen, A12379).
Isolation and purification of total and cell surface GAGs
For total GAG recovery, 1×10⁸ pluripotent NCCIT and RA-differentiated cells were harvested at the indicated time points, washed in PBS three times, and centrifuged to pellet cells. Isolation and purification of GAGs was performed as previously described with some modifications [42,46]. Specifically, cell pellets were resuspended in 1 mL water and subjected to proteolysis at 55° C in 2 mg/mL actinase E (Kaken Biochemicals, Tokyo, Japan) for 20 h. After proteolysis, particulates were removed by using a 0.22 μm syringe-top filter. Peptides were removed from the samples using Microcon Centrifugal Filter Units YM-10 (10 k MWCO, 15 mL, Vivascience, Ridgewood, NJ). Samples were collected from the top layer of the filtration membrane and lyophilized, then dissolved in 8 M urea containing 2% CHAPS (pH 8.3, Sigma-Aldrich). A Vivapure MINI Q H spin column was prepared by equilibrating with 200 μL of 8M urea containing 2% CHAPS (pH 8.3). The clarified, filtered samples were loaded onto and run through an equilibrated Vivapure MINI Q H spin column at 700×g. The columns were first washed with 200 μL of 8 M urea containing 2% CHAPS at pH 8.3, then washed five times with 200 μL 200 mM NaCl. GAGs were released from the spin column by washing three times with 100 μL of 16% NaCl, and desalted with a Microcon Centrifugal Filter Unit YM-3 (3,000 MWCO, Millipore, Billerica, MA) spin column. The isolated GAG samples were freeze-dried for future analysis.
Enzymatic depolymerization of GAGs for CS/DS and HP/HS analysis
Isolated GAG samples were incubated with chondroitin lyase ABC (10 m-units, Seikagaku Corporation, Tokyo, Japan) and chondroitin lyase ACII (5 m-units, Seikagaku Corporation) at 37 °C for 10 hours and the enzymatic products were recovered by centrifugal filtration as described above but at 13,000xg. CS/DS disaccharides that passed through the filter were freeze-dried for LC-MS analysis. GAGs remaining in the retentate were collected by reversing the filter and spinning at 13,000xg, followed by incubation with 10 m-units of heparin lyase I, II, and III at 37°C for 10 h. The products were recovered by centrifugal filtration and the HP/HS disaccharides collected and freeze-dried for LC-MS analysis. Cloning, E. coli expression and purification of the recombinant heparin lyase I (EC 4.2.2.7), heparin lyase II (no EC assigned), and heparin lyase III (EC 4.2.2.8) from F. heparinum were performed as previously described in our lab [16,47,48].
LC-MS disaccharide composition analysis of CS/DS and HP/HS
LC-MS analyses were performed on an Agilent 1200 LC/MSD instrument (Agilent Technologies, Inc. Wilmington, DE) equipped with a 6300 ion trap with two separate systems for the CS/DS disaccharide analysis and HP/HS disaccharide analysis. Unsaturated disaccharide standards of CS/DS, ΔUA-GalNAc (0S), ΔUA-GalNAc4S (4S), ΔUA-GalNAc6S (6S), ΔUA2S-GalNAc (2S), ΔUA2S-GalNAc4S (2S4S), ΔUA2S-GalNAc6S (2S6S), ΔUA-GalNAc4S6S (4S6S), ΔUA2S-GalNAc4S6S (2S4S6S) and unsaturated disaccharide standards of HP/HS, ΔUA-GlcNAc (0S), ΔUA-GlcNS (NS), ΔUA-GlcNAc6S (6S), ΔUA2S-GlcNAc (2S), ΔUA2S-GlcNS (NS2S), ΔUA-GlcNS6S (NS6S), ΔUA2S-GlcNAc6S (2S6S), ΔUA2S-GlcNS6S (NS2S6S) were obtained from Seikagaku America-NorthStar BioProducts (East Falmouth, MA) and Iduron (Manchester, UK). The column used was a 1.7 μm Acquity UPLC BEH C18 column (2.1 × 150 mm, Waters, Milford, MA). For CS/DS disaccharide analysis, solutions A and B for UPLC were 0 and 75% acetonitrile, respectively, containing the same concentration of 15 mM HXA as an ion-pairing reagent and 100 mM HFIP as an organic modifier. The column temperature was maintained at 45°C. For disaccharide analysis, solution A was used for 10 min, followed by a linear gradient from 10 to 40 min of 0 to 50% (v/v) solution B at the flow rate of 100 μL/min. The electrospray interface was set in positive ionization mode with the skimmer potential 40.0 V, capillary exit 40.0 V, with the temperature set at 350°C to obtain maximum abundance of the ions in a full-scan spectra (350–1500 Da, 10 full scans/s) [49]. Nitrogen was used as a drying gas (8 L/min) and a nebulizing gas (40 psi). For HP/HS disaccharide analysis, eluent A was water/acetonitrile (85:15) v/v, and eluent B was water/acetonitrile (35:65) v/v. Both eluents contained 12 mM tributylamine (TrBA) and 38 mM NH4OAc with pH adjusted to 6.5 with acetic acid. The column temperature was maintained at 45°C. For disaccharide analysis, solution A was used for 10 min, followed by a linear gradient from 10 to 40 min of 0 to 50% (v/v) solution B at the flow rate of 100 μL/min. The electrospray interface was set in negative ionization mode with the skimmer potential and capillary exit of −40.0 V, with a temperature of 350°C to obtain maximum abundance of the ions in a full-scan spectra (350–1500 Da, 10 full scans/s). Nitrogen was used as a drying gas (8 L/min) and nebulizing gas (40 psi) [50].
Supplementary Material
Acknowledgments
The authors thank Empire State Stem Cell Fund for funding in the form of contract #C024334 and the National Institutes of Health for funding in the form of grant #3R01HL09697203.
Abbreviations
- Ac
acetyl
- BCA assay
bicinchoninic acid assay
- BEH
ethylene bridged hybrid
- C5Epi
C5Epimerase
- cDNA
complementary deoxyribonucleic acid
- CHAPS
3-[(3-cholamidopropyl)dimethylammonio]-1-propanesulfonate
- CS/DS
chondroitin sulfate/dermatan sulfate
- ΔUA
4-deoxy-α-L-threo-hex-4-enopryanosyluronic acid
- GAG
glycosaminoglycan
- GalN
galactosamine
- GFAP
glial fibrillary acid protein
- GlcA
glucuronic acid
- IdoA
iduronic acid
- GlcN
glucosamine
- HRP
horseradish peroxidase
- HFIP
1,1,1,3,3,3-hexafluoro-2-propanol
- HP/HS
heparin/heparan sulfate
- HXA
hexylamine
- KRTAP3-2
keratin associated protein 3-2
- LC/MS
liquid chromatography/mass spectrometry
- NDST
N-deacetylase-N-sulfotransferase
- PVDF
polyvinyl difluoride
- qRT-PCR
quantitative reverse transcription-polymerase chain reaction
- RA
retinoic acid
- RPS18
ribosomal protein S18
- RNA
ribonucleic acid
- S
sulfo
- TrBA
tributylamine
- UPLC
ultra-performance liquid chromatography
- WB
Western immunoblotting
- HS2ST
2-O-sulfotransferase
- HS3ST
3-O-sulfotransferase
- HS6ST
6-O-sulfotransferase
References
- 1.Davies JA, Fisher CE, et al. Glycosaminoglycans in the study of mammalian organ development. Biochem Soc Trans. 2001;29:166–171. doi: 10.1042/0300-5127:0290166. [DOI] [PubMed] [Google Scholar]
- 2.Linhardt RJ, Toida T. Role of glycosaminoglycans in cellular communication. Accts Chem Res. 2004;37:431–438. doi: 10.1021/ar030138x. [DOI] [PubMed] [Google Scholar]
- 3.Lanctot PM, Gage FH, et al. The glycans of stem cells. Curr Opin Chem Biol. 2007;11:373–380. doi: 10.1016/j.cbpa.2007.05.032. [DOI] [PMC free article] [PubMed] [Google Scholar]
- 4.Andrews PW, Martin MM, et al. Embryonic stem (ES) cells and embryonal carcinoma (EC) cells: opposite sides of the same coin. Biochem Soc Trans. 2005;33:1526–1530. doi: 10.1042/BST0331526. [DOI] [PubMed] [Google Scholar]
- 5.Damjanov I. Teratocarcinoma stem cells. Cancer Surveys. 1990;9:303–319. [PubMed] [Google Scholar]
- 6.Pierce GB. Carcinoma is to embryology as mutation is to genetics. Amer Zoology. 1985;25:707–712. [Google Scholar]
- 7.Teshima S, Shimosato Y, et al. Four new human germ cell lines. Lab Investig. 1988;59:328–336. [PubMed] [Google Scholar]
- 8.Damjanov I, Horvat B, et al. Retinoic acid-induced differentiation of the developmentally pluripotent human germ cell tumor-derived cell line, NCCIT. Lab Investig. 1993;68:220–232. [PubMed] [Google Scholar]
- 9.Esko JD. Genetic analysis of proteoglycan structure, function and metabolism. Curr Opin Cell Biol. 1991;3:805–816. doi: 10.1016/0955-0674(91)90054-3. [DOI] [PubMed] [Google Scholar]
- 10.Linhardt RJ, Claude S. Hudson Award address in carbohydrate chemistry Heparin: structure and activity. J Medic Chem. 2003;46:2551–2564. doi: 10.1021/jm030176m. [DOI] [PubMed] [Google Scholar]
- 11.Skidmore MA, Guimond SE, et al. The activities of heparan sulfate and its analogue heparin are dictated by biosyntehsis, sequence and conformation. Connect Tissue Res. 2008;49:140–144. doi: 10.1080/03008200802148595. [DOI] [PubMed] [Google Scholar]
- 12.Sugahara K, Kitagawa H. Heparin and heparan sulfate biosynthesis. JUBMB Life. 2002;54:163–175. doi: 10.1080/15216540214928. [DOI] [PubMed] [Google Scholar]
- 13.Packer AI, Mailutha KG, et al. Regulation of the Hoxa4 and Hoxa5 Genes in the embryonic mouse lung by retinoic acid and TGFβ1: Implications for lung development and patterning. Develop Dynam. 2000;217:62–74. doi: 10.1002/(SICI)1097-0177(200001)217:1<62::AID-DVDY6>3.0.CO;2-U. [DOI] [PubMed] [Google Scholar]
- 14.Lee DCW, Chan KW, et al. RET receptor typosine kinase isoforms in kidney function and disease. Oncogene. 2002;21:5582–5592. doi: 10.1038/sj.onc.1205741. [DOI] [PubMed] [Google Scholar]
- 15.Kumar S, Duester G. Retinoic acid signaling in perioptic mesenchyme represses Wnt signaling via induction of Pitx2 and Dkk2. Develop Biol. 2010;340:67–74. doi: 10.1016/j.ydbio.2010.01.027. [DOI] [PMC free article] [PubMed] [Google Scholar]
- 16.Dahlstrand J, Zimmerman LB, et al. Characterization of the human nestin gene reveals a close evolutionary relationship to neurofilaments. J Cell Sci. 1992;103:589–597. doi: 10.1242/jcs.103.2.589. [DOI] [PubMed] [Google Scholar]
- 17.Couchman JR. Transmembrane signaling proteoglycans. Annual Review of Cell and Develop Biol. 2010;26:89–114. doi: 10.1146/annurev-cellbio-100109-104126. [DOI] [PubMed] [Google Scholar]
- 18.Esko JD, Kimata K, et al. Essentials of glycobiology. Cold Spring Harbor Laboratory Press; Cold Spring Harbor, NY: 2009. [PubMed] [Google Scholar]
- 19.Hanemann CO, Kuhn G, et al. Expression of decorin mRNA in the nervous system of rat. J Histochem Cytochem. 1993;41:1383–1391. doi: 10.1177/41.9.8354878. [DOI] [PubMed] [Google Scholar]
- 20.Minor K, Tang X, et al. Decorin promotes robust axon growth on inhibitory CSPGs and myelin via a direct effect on neurons. Neurobiol Disease. 2008;32:88–95. doi: 10.1016/j.nbd.2008.06.009. [DOI] [PubMed] [Google Scholar]
- 21.Troup S, Njue C, et al. Reduced expression of the small leucine-rich proteoglycans, lumican, and decorin is associated with poor outcome in node-negative invasive breast cancer. Clin Cancer Res. 2003;9:207–214. [PubMed] [Google Scholar]
- 22.Lemons ML, Barua S, et al. Adaptation of sensory neurons to hyalectin and decorin proteoglycans. J Neuroscie. 2005;25:4964–4973. doi: 10.1523/JNEUROSCI.0773-05.2005. [DOI] [PMC free article] [PubMed] [Google Scholar]
- 23.Weber CK, Sommer G, et al. Biglycan is overexpressed in pancreatic cancer and induces G1-arrest in pancreatic cancer cell lines. Gastroenterology. 2001;121:657–667. doi: 10.1053/gast.2001.27222. [DOI] [PubMed] [Google Scholar]
- 24.Saunders S, et al. Expression of the cell surface proteoglycan glypican-5 is developmentally regulated in kidney, limb, and brain. Dev Biology. 1997;190:78–93. doi: 10.1006/dbio.1997.8690. [DOI] [PubMed] [Google Scholar]
- 25.Williamson D, Selfe S, et al. Cancer Research. 2007;67:57. doi: 10.1158/0008-5472.CAN-06-1650. [DOI] [PubMed] [Google Scholar]
- 26.Capurro MI, Shi W, et al. Processing by convertases is not required for glypican-3-induced stimulation of hepatocellular carcinoma growth. J Biol Chemis. 2005;280:41201–41206. doi: 10.1074/jbc.M507004200. [DOI] [PubMed] [Google Scholar]
- 27.Filmus J. Glypicans in growth control and cancer. Glycobiology. 2001;11:19R–23R. doi: 10.1093/glycob/11.3.19r. [DOI] [PubMed] [Google Scholar]
- 28.Sung YK, Hwang SY, et al. Glypican-3 is overexpressed in human hepatocellular carcinoma. Cancer Science. 2005;94:259–262. doi: 10.1111/j.1349-7006.2003.tb01430.x. [DOI] [PMC free article] [PubMed] [Google Scholar]
- 29.Lai JP, Sandhu DS, et al. Sulfatase 2 up-regulates glypican 3, promotes fibroblast growth factor signaling, and decreases survival in hepatocellular carcinoma. Hepatology. 2008;47:1211–1222. doi: 10.1002/hep.22202. [DOI] [PMC free article] [PubMed] [Google Scholar]
- 30.Bishop JR, Schuksz M, et al. Heparan sulphate proteoglycans fine-tune mammalian physiology. Nature. 2007;446:1030–1037. doi: 10.1038/nature05817. [DOI] [PubMed] [Google Scholar]
- 31.Aikawa J, Esko JD. Molecular cloning and expression of a third member of the heparan sulfate/heparin GlcNAcN-Deacetylase/N-Sulfotransferase family. J Biol Chem. 1999;274:2690–2695. doi: 10.1074/jbc.274.5.2690. [DOI] [PubMed] [Google Scholar]
- 32.Aikawa J, Grobe K, et al. Multiple isozymes of heparan sulfate/heparin GlcNAc N-deacetylase/GlcN N-sulfotransferase. Structure and activity of the fourth member, NDST4. J Biol Chem. 2001;276:5876–5882. doi: 10.1074/jbc.M009606200. [DOI] [PubMed] [Google Scholar]
- 33.Grobe K, Ledin J, et al. Heparan sulfate and development: differential roles of the N-acetylglucosamine N-deacetylase/N-sulfotransferase isozymes. Biochimica et Biophysica Acta. 2002;1573:209–215. doi: 10.1016/s0304-4165(02)00386-0. [DOI] [PubMed] [Google Scholar]
- 34.Kusche-Gullberg M, Kjellén L. Sulfotransferases in glycosaminoglycan biosynthesis. Curr Opinion Struc Biol. 2003;13:605–611. doi: 10.1016/j.sbi.2003.08.002. [DOI] [PubMed] [Google Scholar]
- 35.Filmus J, Capurro MI, et al. Glypicans. Genome Biology. 2008;8:224. doi: 10.1186/gb-2008-9-5-224. [DOI] [PMC free article] [PubMed] [Google Scholar]
- 36.Kraushaar DC, Yamaguchi Y, et al. Heparan sulfate is required for embryonic stem cells to exit from self-renewal. J Biol Chem. 2010;285:5907–5916. doi: 10.1074/jbc.M109.066837. [DOI] [PMC free article] [PubMed] [Google Scholar]
- 37.Funderburgh JL. Keratan sulfate biosynthesis. IUBMB Life. 2002;54:187–194. doi: 10.1080/15216540214932. [DOI] [PMC free article] [PubMed] [Google Scholar]
- 38.Funderburgh JL, Caterson B, et al. Keratan sulfate proteoglycan during embryonic development of the chicken cornea. Develop Biol. 1986;116:267–277. doi: 10.1016/0012-1606(86)90130-2. [DOI] [PubMed] [Google Scholar]
- 39.Brown JJ, Papaioannou VE. Ontogeny of hyaluronan secretion during early mouse development. Development. 1993;117:483–492. doi: 10.1242/dev.117.2.483. [DOI] [PubMed] [Google Scholar]
- 40.Toole BP. Hyaluronan in morphogenesis. Seminars in Cell and Develop Biol. 2001;12:79–87. doi: 10.1006/scdb.2000.0244. [DOI] [PubMed] [Google Scholar]
- 41.Paluh JL, Dai G, et al. In search of the Holy Grail: Engineering the stem cell niche. European Pharm Review. 2011;16:28–33. [Google Scholar]
- 42.Li B, Liu H, et al. Analysis of glycosaminoglycans in stem cell glycomics. Methods in Molecular Biology Humana Press. 2011;690:285–300. doi: 10.1007/978-1-60761-962-8_19. [DOI] [PMC free article] [PubMed] [Google Scholar]
- 43.Nairn AV, Kinoshita-Toyoda A, et al. Glycomics of proteoglycan biosynthesis in murine embryonic stem cell differentiation. J Proteome Res. 2007;6:4374–4387. doi: 10.1021/pr070446f. [DOI] [PMC free article] [PubMed] [Google Scholar]
- 44.Nairn AV, York WS, et al. Regulation of glycan structures in animal tissues: transcript profiling of glycan-related genes. J Biol Chem. 2008;25:17298–17313. doi: 10.1074/jbc.M801964200. [DOI] [PMC free article] [PubMed] [Google Scholar]
- 45.Pfaffl MW. A new mathematical model for relative quantification in real-time PCR. Nucleic Acids Res. 2001;29:2002–2007. doi: 10.1093/nar/29.9.e45. [DOI] [PMC free article] [PubMed] [Google Scholar]
- 46.Zhang F, Sun P, et al. Microscale isolation and analysis of heparin from plasma using an anion-exchange spin column. Anal Biochem. 2006;353:284–286. doi: 10.1016/j.ab.2006.01.040. [DOI] [PMC free article] [PubMed] [Google Scholar]
- 47.Shaya D, Tocili A, et al. Crystal structure of heparinase II from Pedobacter heparinus and its complex with a disaccharide product. J Biol Chem. 2006;281:15525–15535. doi: 10.1074/jbc.M512055200. [DOI] [PubMed] [Google Scholar]
- 48.Yoshida E, Arakawa S, et al. Cloning, sequencing, and expression of the gene from bacillus circulans that codes for a heparinase that degrades both heparin and heparan sulfate. Biosci Biotech and Biochem. 2002;66:1873–1879. doi: 10.1271/bbb.66.1873. [DOI] [PubMed] [Google Scholar]
- 49.Solakyildirim K, Zhang F, et al. Ultraperformance liquid chromatography with electrospray ionization ion trap mass spectrometry for chondroitin disaccharide analysis. Analytical Biochem. 2010;397:24–28. doi: 10.1016/j.ab.2009.09.031. [DOI] [PMC free article] [PubMed] [Google Scholar]
- 50.Yang B, Weyers A, et al. Ultra-performace ion pairing liquid chromatography with on-line electrospray ion trap mass spectrometry for heparin disaccharide analysis. Analytical Biochem. 2011;415:59–66. doi: 10.1016/j.ab.2011.04.003. [DOI] [PMC free article] [PubMed] [Google Scholar]
Associated Data
This section collects any data citations, data availability statements, or supplementary materials included in this article.