

Abstract
HbA1c 6.5% has recently been recommended as an alternative diagnostic criterion for diabetes. The aims of the study were to evaluate the effects of age, sex, and other factors on prevalence of diabetes and to compare risk profiles of subjects with diabetes when defined by HbA1c and glucose criteria. Subjects were recruited among participants in the longitudinal population-based Tromsø Study. HbA1c, fasting plasma glucose, and 2-hour plasma glucose were measured in 3,476 subjects. In total, 294 subjects met one or more of the diagnostic criteria for diabetes; 95 met the HbA1c criterion only, 130 met the glucose criteria only, and 69 met both. Among subjects with diabetes detected by glucose criteria (regardless of HbA1c), isolated raised 2-hour plasma glucose was more common in subjects aged ≥ 60 years as compared to younger subjects and in elderly women as compared to elderly men. Subjects with diabetes detected by glucose criteria only had worse cardiometabolic risk profiles than those detected by HbA1c only. In conclusion, the current HbA1c and glucose criteria defined different subjects with diabetes with only modest overlap. Among a substantial proportion of elderly subjects, and especially elderly women, the 2-hour plasma glucose was the only abnormal value.
1. Introduction
Criteria for the diagnosis of diabetes are based on measurements of fasting plasma glucose (FPG), 2-hour plasma glucose (2hPG), or haemoglobin A1c (HbA1c). Single raised values with symptoms or raised values on two occasions of any one of these tests, or a combination of these tests can be used for diagnosis of diabetes [1, 2]. The most commonly used test is the FPG as it is simple and inexpensive. The 2hPG is measured in combination with FPG in the oral glucose tolerance test (OGTT), where plasma glucose is measured in the morning after an overnight fast and 2 hours after oral ingestion of 75 g glucose. HbA1c was recently introduced as a diagnostic test for diabetes. Compared to glucose measurements, HbA1c has better sample stability, lower within-person variation and is independent of acute factors such as illness, recent food ingestion, stress, or exercise [3].
Diagnostic levels of FPG, 2hPG, and HbA1c are based on thresholds for increased risk of micro- and macrovascular disease, in particular retinopathy [1, 4]. In the DETECT-2 study, sensitivity and specificity for prediction of prevalent retinopathy were almost equal when comparing FPG, 2hPG and HbA1c [5]. Several recent studies have shown that both the prevalence of diabetes and the subjects diagnosed with diabetes vary when different diagnostic criteria for diabetes are applied [6–11]. According to current guidelines, clinicians can choose freely among FPG, OGTT, and HbA1c when testing a patient for diabetes [1, 2]. As HbA1c and glucose criteria have been shown to identify different subjects with diabetes with relatively modest overlap, the choice of test may affect the test outcome [6, 7, 9]. This is important both at the individual level, where correct diagnosis, treatment, and prevention of later complications are in focus, and at the population level where early identification of the “correct” individuals at risk of developing complications is important for cost-effective utilisation of resources. Furthermore, race, age, and sex have been reported to affect the outcome of diabetes testing with different diagnostic criteria [6–8, 12, 13]. This could have implications for the preferred choice of test in subgroups of patients. In Tromsø we have recently performed a large health survey where we measured HbA1c, FPG, and 2hPG in 3,476 subjects without previously diagnosed diabetes. These data enabled us to study the effect of age, sex, and other factors on diabetes defined by different diagnostic criteria and to compare cardiometabolic risk profiles of subjects with diabetes defined by different criteria.
2. Materials and Methods
2.1. Subjects
Subjects were recruited from the sixth survey of the longitudinal population-based Tromsø Study performed by the University of Tromsø from October 2007 to December 2008, where HbA1c was measured in 12,769 participants. All subjects without self-reported diabetes and with HbA1c in the range 5.8–6.9% and a random sample of approximately 200 subjects with HbA1c 5.3% and 5.4% and 100 subjects with HbA1c 5.5%, 5.6%, and 5.7%, respectively, were invited to participate in the Tromsø OGTT Study. Race was not registered, but practically all subjects were Caucasian.
2.2. Measurements
Waist and hip circumference, height, weight, and blood pressure were measured, body mass index (BMI) was defined, and physical activity score (PAS) was calculated as previously described [14]. HbA1c was determined by high performance liquid chromatography (HPLC) using an automated analyser (Variant II, Bio-Rad Laboratories Inc., Hercules, CA, USA). The reference interval was 4.3–6.1%. This analysis has been certified by the National Glycohemoglobin Standardization Program (NGSP) as having documented traceability to the Diabetes Control and Complication Trial (DCCT) reference method [15]. Haemoglobin (Hb) was measured by photometry using an automated analyser (reference intervals 11.5–16.0 g/dL for women and 13.0–17.0 g/dL for men). Plasma glucose, serum insulin, and serum C-peptide were measured and analysed as previously described [14]. Serum triglyceride (TG) was analysed with an enzymatic colorimetric assay using an automated clinical chemistry analyser (reference interval 0.5–2.6 mmol/L). Estimates of insulin sensitivity in the fasting state were calculated using homeostasis model assessment (HOMA-IR) and the Quantitative Insulin-Sensitivity Check Index (QUICKI) [16, 17], and insulin sensitivity including the 2-hour values for glucose and insulin with the insulin sensitivity index (ISI0.120) according to the formula by Gutt et al. [(m/MPG)/log MSI, where m = (75 000 mg + [fasting glucose (mg/dL) − 2-h glucose (mg/dL)] × 0.19 × body weight (kg))/120 min, MPG = mean of fasting and 2-h glucose concentrations (mmol/L); MSI = mean of fasting and 2-h insulin concentrations (milliunits per liter)] [18].
OGTTs were performed from February 2008 until August 2010 as previously described [14]. All OGTTs were performed in the morning after an overnight fast. To minimize time between OGTT and HbA1c, the latter was measured simultaneously with the OGTT from September 2008 onwards. HbA1c from the Tromsø Study 2007-2008 was used for the 932 participants who completed OGTT before September 2008. Mean change in HbA1c for the 2,544 subjects who measured HbA1c on both occasions was −0.03 ± 0.3%. For the purpose of this study, we chose to classify subjects with a single value of FPG ≥ 7.0 mmol/L, 2hPG ≥ 11.1 mmol/L, and/or HbA1c ≥ 6.5% as having diabetes, even though subjects were asymptomatic. Subjects with diabetes were subdivided into diabetes detected by HbA1c only, by OGTT (raised FPG and/or 2hPG) only and by both. Furthermore, subjects with diabetes detected by OGTT (regardless of HbA1c) were subdivided into diabetes detected by FPG (regardless of 2hPG) and by isolated raised 2hPG.
2.3. Statistics
Normal distribution was evaluated by visual inspection of histograms and determination of skewness and kurtosis, and after natural log transformation of TG, PAS, QUICKI, HOMA-IR, and ISI0.120, all variables except the PAS (where several subjects had “0” values) were considered normally distributed. Ln values were used when these variables were dependent variables. Pearson Chi-square test was used for subgroup analysis in Table 2. Comparisons between groups were performed with logistic regression for categorical variables and univariate analysis of variance with Bonferroni post hoc adjustment or Mann Whitney U test for continuous variables in Table 3. Venn diagrams were constructed to illustrate overlap between diagnostic criteria and scatterplots to illustrate the distribution of FPG and 2hPG values in relation to HbA1c. Unless otherwise stated, data are expressed as mean ± SD for normally distributed values and as median (5, 95 percentile) for non-normally distributed values. All tests were two-sided, and P value < 0.05 was considered statistically significant. The Statistical Package for Social Sciences version 17.0 was used for all statistical analyses (SPSS Inc., Chicago, IL, USA).
Table 2.
Diabetes detected by HbA1c only, OGTT only and both, and by OGTT components (FPG and isolated 2hPG), by subgroups in the Tromsø OGTT Study.
| Category | Subcategory | Subjects without diabetes |
All subjects with diabetes N (% of total) |
Subjects with diabetes detected by | Subjects with diabetes detected by OGTT regardless of HbA1c | |||
|---|---|---|---|---|---|---|---|---|
| HbA1c only |
OGTT only |
Both HbA1c and OGTT | Raised FPG (regardless of 2hPG) |
Isolated raised 2hPG | ||||
| N (% of diabetes) | N (% of diabetes) | N (% of diabetes) | N (% of diabetes by OGTT) | N (% of diabetes by OGTT) | ||||
| All | 3182 | 294 (8.5) | 95 (32.3) | 130 (44.2) | 69 (23.5) | 119 (59.8) | 80 (40.2) | |
| Sex† | Men | 1593 | 163 (9.3) | 53 (32.5) | 72 (44.2) | 38 (23.3) | 76 (69.1) | 34 (30.9) |
| Women | 1589 | 131 (7.6) | 42 (32.1) | 58 (44.3) | 31 (23.7) | 43 (48.3) | 46 (51.7) | |
| Age (years)† | <60 | 1153 | 61 (5.0) | 26 (42.6) | 20 (32.8) | 15 (24.6) | 31 (88.6) | 4 (11.4) |
| ≥60 | 2029 | 233 (10.3) | 69 (29.6) | 110 (47.2) | 54 (23.2) | 88 (53.7) | 76 (46.3) | |
| BMI (kg/m2)* | <25 | 865 | 47 (5.2) | 25 (53.2) | 17 (36.2) | 5 (10.6) | 9 (40.9) | 13 (59.1) |
| 25–29 | 1491 | 121 (7.5) | 33 (27.3) | 56 (46.3) | 32 (26.4) | 54 (61.4) | 34 (38.6) | |
| ≥30 | 824 | 124 (13.1) | 37 (29.8) | 56 (45.2) | 31 (25.0) | 55 (63.2) | 32 (36.8) | |
| Smoking status | Smoker | 746 | 69 (8.5) | 27 (39.1) | 25 (36.3) | 17 (24.6) | 23 (54.8) | 19 (45.2) |
| Nonsmoker | 2436 | 225 (8.5) | 68 (30.2) | 105 (46.7) | 52 (23.1) | 96 (61.1) | 61 (38.9) | |
| PAS tertile* | Low | 949 | 121 (11.3) | 26 (21.5) | 63 (52.1) | 32 (26.4) | 50 (52.6) | 45 (47.4) |
| Medium | 1079 | 101 (8.6) | 39 (38.6) | 38 (37.6) | 24 (23.8) | 39 (62.9) | 23 (37.1) | |
| High | 1154 | 72 (5.9) | 30 (41.7) | 29 (40.3) | 13 (18.1) | 30 (71.4) | 12 (28.6) | |
| TG (mmol/L)* | <1.2 | 1855 | 115 (5.8) | 52 (45.2) | 46 (40.0) | 17 (14.8) | 37 (58.7) | 26 (41.3) |
| 1.2–2.6 | 1180 | 150 (11.3) | 39 (26.0) | 66 (44.0) | 45 (30.0) | 70 (63.1) | 41 (36.9) | |
| >2.6 | 146 | 28 (16.1) | 3 (10.7) | 18 (64.3) | 7 (25.0) | 12 (48.0) | 13 (52.0) | |
Data are N (%). Pearson Chi-square test was used for subgroup analysis. ∗ P < 0.05 for subjects with diabetes detected by HbA1c only as compared to OGTT only. † P < 0.05 for subjects with raised FPG as compared to isolated raised 2hPG.
Abbreviations: Haemoglobin A1c: HbA1c: oral glucose tolerance test: OGTT; fasting plasma glucose: FPG; 2-hour plasma glucose: 2hPG; physical activity score: PAS; triglycerides: TG.
Table 3.
Characteristics of subjects with diabetes detected by OGTT only, HbA1c only, and both, and by OGTT components (FPG and isolated 2hPG) in the Tromsø OGTT Study.
| Subjects without diabetes | All subjects with diabetes | Subjects with diabetes detected by | Subjects with diabetes detected by OGTT regardless of HbA1c | ||||
|---|---|---|---|---|---|---|---|
| HbA1c only | OGTT only | Both HbA1c and OGTT | Raised FPG (regardless of 2hPG) | Isolated raised 2hPG | |||
| N | 3182 | 294 | 95 | 130 | 69 | 119 | 80 |
| Women (%) | 49.9 | 44.6 | 44.2 | 44.6 | 44.9 | 36.1† | 57.5 |
| Age (years) | 60.7 ± 10.3 | 64.5 ± 8.6 | 63.7 ± 10.0 | 64.7 ± 7.4 | 65.3 ± 8.8 | 64.0 ± 8.6† | 66.3 ± 6.6 |
| BMI (kg/m2) | 27.7 ± 4.3 | 29.7 ± 5.2 | 29.2 ± 6.0 | 29.5 ± 4.5 | 30.9 ± 5.1 | 30.6 ± 4.9† | 29.1 ± 4.4 |
| Smokers (%) | 23.4 | 23.5 | 28.4 | 19.2 | 24.6 | 19.3 | 23.8 |
| SBP (mmHg) | 139 ± 22 | 147 ± 24 | 140 ± 22* | 150 ± 22 | 151 ± 28 | 150 ± 25 | 151 ± 23 |
| PAS (hours/week) | 0.94 (0.0, 4.5) | 0.38 (0.0, 4.5) | 0.94 (0.0, 4.5)* | 0.38 (0.0, 4.5) | 0.38 (0.0, 3.0) | 0.38 (0.0, 4.5) | 0.19 (0.0, 4.5) |
| HbA1c (%) | 5.9 ± 0.3 | 6.4 ± 0.3 | 6.6 ± 0.1* | 6.1 ± 0.2 | 6.7 ± 0.3 | 6.4 ± 0.4† | 6.2 ± 0.3 |
| FPG (mmol/L) | 5.5 ± 0.5 | 6.6 ± 0.96 | 6.0 ± 0.6* | 6.7 ± 0.9 | 7.4 ± 0.9 | 7.5 ± 0.7† | 6.1 ± 0.6 |
| 2hPG (mmol/L) | 5.6 ± 1.7 | 9.8 ± 3.3 | 7.0 ± 2.1* | 11.1 ± 2.8 | 11.2 ± 3.3 | 10.2 ± 3.4† | 12.5 ± 1.3 |
| HOMA-IR | 2.18 ± 1.65 | 4.18 ± 3.56 | 3.38 ± 2.79* | 4.34 ± 4.05 | 4.96 ± 3.31 | 5.34 ± 4.51† | 3.38 ± 1.97 |
| QUICKI | 0.35 ± 0.04 | 0.33 ± 0.04 | 0.34 ± 0.06* | 0.32 ± 0.03 | 0.31 ± 0.03 | 0.31 ± 0.03† | 0.33 ± 0.04 |
| ISI0.120 | 4.77 ± 1.25 | 4.01 ± 1.27 | 4.42 ± 1.61* | 3.87 ± 1.07 | 3.71 ± 0.92 | 3.72 ± 0.94 | 3.96 ± 1.12 |
| TG (mmol/L) | 1.32 ± 0.81 | 1.64 ± 0.94 | 1.34 ± 0.59* | 1.80 ± 1.16 | 1.78 ± 0.75 | 1.76 ± 0.90 | 1.84 ± 1.21 |
Data are means ± SD or median (5, 95 percentile). Logistic regression was used for categorical variables and univariate analysis of variance with Bonferroni post-hoc adjustment or Mann-Whitney U test for continuous variables. ∗ P < 0.05 as compared to OGTT only. † P < 0.05 as compared to isolated raised 2hPG. Abbreviations: Haemoglobin A1c: HbA1c; oral glucose tolerance test, OGTT; fasting plasma glucose, FPG; 2-hour plasma glucose: 2hPG; systolic blood pressure: SBP; physical activity score: PAS; homeostasis model assessment-insulin resistance: HOMA-IR; quantitative insulin-sensitivity check index: QUICKI; insulin sensitivity index, ISI0.120; triglycerides, TG.
3. Results
Among the 4,393 subjects who were invited, 3,520 attended and 3,476 completed the OGTT. The number of subjects planned to participate, invited to OGTT, and attended at different HbA1c levels, as measured in the Tromsø Study 2007-2008, is presented in Table 1. In total, 294 (8.5%) subjects met one or more of the diagnostic criteria for diabetes. Mean age was 61 years and 49.5% were women.
Table 1.
Number of participants planned to participate, invited to participate, attended, and completed OGTT in the Tromsø OGTT Study.
| HbA1c level in the sixth Tromsø | Number of subjects |
|||
|---|---|---|---|---|
| study survey (2007-2008) | Planned to participate | Invited to participate | Attended OGTT | Completed OGTT |
| 5.3% | 200 | 309 | 180 | 176 |
| 5.4% | 200 | 308 | 195 | 194 |
| 5.5% | 100 | 144 | 109 | 107 |
| 5.6% | 100 | 164 | 128 | 123 |
| 5.7% | 100 | 157 | 115 | 112 |
| 5.8–6.9% | All | 3311 | 2793 | 2764 |
|
| ||||
| Total | 4393 | 3520 | 3476 | |
Abbreviations: Haemoglobin A1c, HbA1c; oral glucose tolerance test, OGTT.
The table summarises how many subjects were planned to participate in the OGTT Study, how many were invited to OGTT, how many attended, and how many who completed OGTT at different HbA1c levels and in total.
3.1. Prevalence of Diabetes Defined by Different Diagnostic Criteria
Among those who completed OGTT, 164 (4.7%) met the HbA1c criterion, 119 (3.4%) met the FPG criterion, and 126 (3.6%) met the 2hPG criterion. In total 199 (5.7%) met the OGTT (FPG and/or 2hPG) criteria. As presented in Table 2, 95 (32.3%) of those with diabetes met the HbA1c criterion only, 130 (44.2%) met the OGTT criteria only, and 69 (23.5%) met both criteria. The overlap between subjects with diabetes defined by HbA1c and OGTT varied between 10–35% in different subgroups.
HbA1c alone detected more subjects with diabetes as compared to OGTT alone in those with BMI < 25 kg/m2, TG < 1.2 mmol/L, and high PAS, but there were no significant differences in subgroup analysis of age and sex (Table 2). Among those with diabetes detected by OGTT (regardless of HbA1c), isolated raised 2hPG was more common in subjects aged ≥ 60 years and women (Table 2). This effect of age and sex was not due to differences in BMI. Stratification for age showed that the sex difference was significant only in those aged ≥ 60 years, where 58% of women and 36% of men had isolated raised 2hPG (P < 0.01). Mean age and BMI did not differ significantly between men and women. Furthermore, the sex difference was significant only in the two lower BMI groups (P < 0.05) and in the lowest PAS tertile (P < 0.05).
The distribution of subjects with diabetes detected by HbA1c only, OGTT only, and both, as well as by OGTT components (FPG and isolated raised 2hPG) is illustrated stratified for age and sex in Figure 1. The overlap between subjects with diabetes defined by HbA1c and OGTT was relatively consistent, but prevalence of isolated raised 2hPG was higher in subjects aged ≥ 60 years as compared to younger subjects, and in elderly women as compared to elderly men. In subjects aged ≥ 60 years the distribution of 2hPG values in relation to HbA1c values was more scattered as compared to younger subjects (Figure 2), illustrating that for many subjects in this age group an HbA1c value < 6.5% did not exclude a 2hPG value above the cut off point for diabetes.
Figure 1.
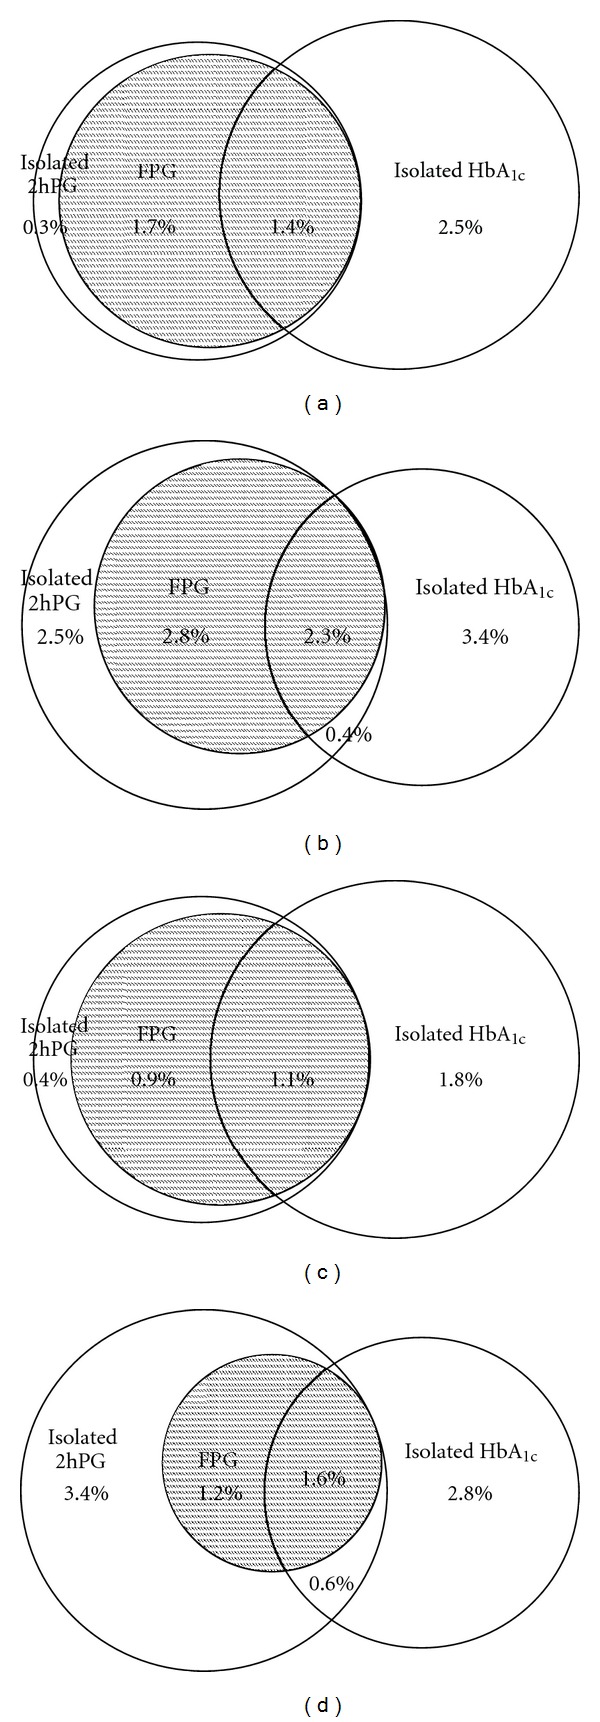
Diabetes prevalence by different diagnostic criteria. Venn diagrams illustrating prevalence of diabetes (%) defined by OGTT criteria (FPG and isolated raised 2hPG) and HbA1c in (a) men aged < 60 years; (b) men aged ≥ 60 years; (c) women aged < 60 years; (d) women ≥ 60 years. The Tromsø OGTT Study.
Figure 2.
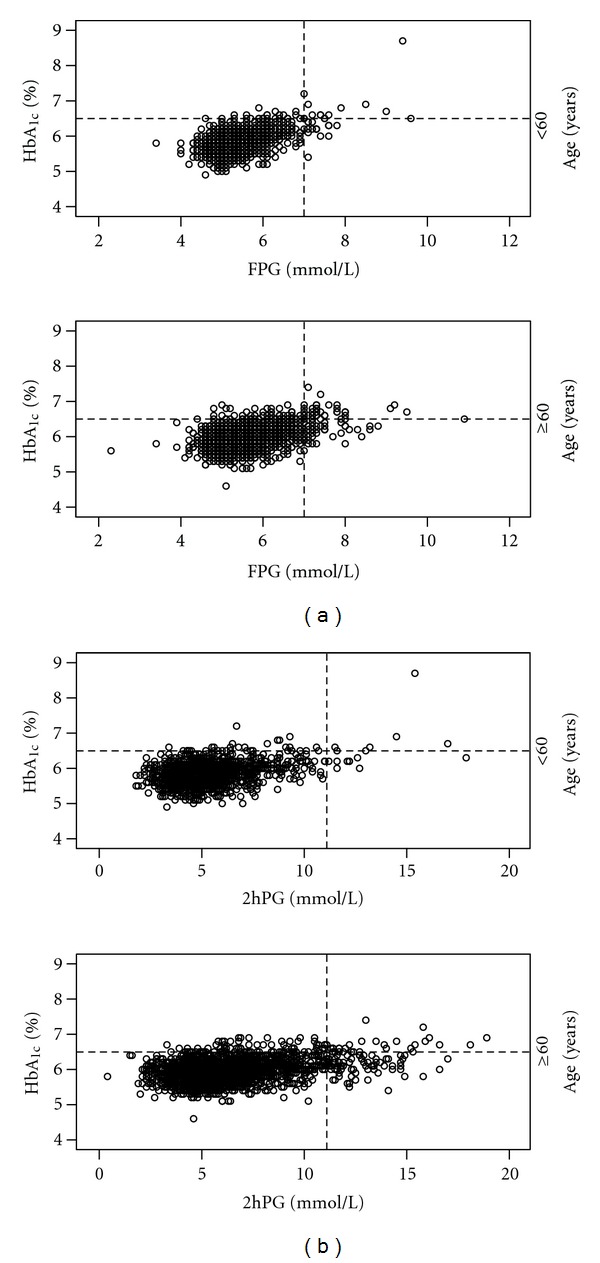
Distribution of FPG and 2hPG values in relation to HbA1c. Scatterplots illustrating the distribution of (a) FPG and (b) 2hPG values in relation to HbA1c in subjects aged < 60 years and subjects aged ≥ 60 years. Stippled lines show cut-off points for diabetes. The Tromsø OGTT Study.
3.2. Characteristics of Subjects with Diabetes Defined by Different Diagnostic Criteria
As presented in Table 3, subjects with diabetes detected by HbA1c only had lower TG, lower systolic blood pressure, higher insulin sensitivity and were less insulin resistant and more physically active as compared to subjects with diabetes detected by OGTT only. Among subjects with diabetes detected by OGTT (regardless of HbA1c), those with raised FPG differed from those with isolated raised 2hPG by being younger, predominantly men and more insulin resistant (Table 3).
4. Discussion
4.1. Prevalence of Diabetes Defined by Different Diagnostic Criteria
In our population, we found prevalence of diabetes detected by OGTT only to be higher than prevalence of diabetes detected by HbA1c only. The present study also confirmed results from recent studies showing that HbA1c and OGTT define different subjects with diabetes with relatively modest overlap, which in our study was only 23.5% [6, 7, 9]. Prevalence of diabetes defined by HbA1c and OGTT, and overlap between these, differs in previous studies, probably due to differences in age, race, and sex composition of the populations and/or lack of standardisation of HbA1c and glucose measurements [7, 8, 12, 13, 19].
Race, age, and sex have been reported to affect the outcome of diabetes testing with different diagnostic criteria [6–8, 12, 13]. Our study population did not allow us to study the effect of race as practically all subjects were Caucasian. When comparing subjects aged ≥ 60 years with younger subjects, we found no difference in prevalence of diabetes detected by HbA1c only and OGTT only. Among those with diabetes detected by OGTT (regardless of HbA1c), prevalence of isolated raised 2hPG was higher in older (≥60 years) as compared to younger subjects. Furthermore, we found that among subjects aged ≥ 60 years, having a 2hPG in the diabetic range but a nondiabetic HbA1c value was more common as compared to younger subjects. Similarly, in the Finnish population-based cross sectional FIN-D2D study including 2,826 men and women aged 45–74 years, any given HbA1c value was found to imply a much higher 2hPG and slightly lower FPG in elderly as compared to middle aged subjects [13]. The 2hPG is known to increase more with age than FPG [20, 21]. Possible explanations for the increased prevalence of isolated raised 2hPG among elderly subjects could be reduced basal insulin secretion [22], delayed insulin response after oral glucose intake [21], physical inactivity, and/or weight gain [23].
In our data, there was no sex difference in diabetes detected by HbA1c only and OGTT only. However, we found that among those with diabetes detected by OGTT (regardless of HbA1c), isolated raised 2hPG was more common in elderly women as compared to elderly men, a difference that could not be explained by differences in age or BMI. Similarly, the FIN-D2D study reported that HbA1c tends to miss more elderly diabetic people and especially women [13]. Previous studies have suggested that differences in FPG and HbA1c levels are likely to reflect sex-specific differences in glucose regulation as they, unlike differences in 2hPG, remained after adjusting for height and body composition [24, 25]. We also found that HbA1c alone detected more subjects with diabetes as compared to OGTT alone in subjects with BMI < 25 kg/m2 as compared to those with higher BMI. In a recently published paper, we reported that a particular HbA1c value implied relatively higher 2hPG and FPG in subjects with high BMI compared to subjects with lower BMI [14]. As very few reports have addressed this issue, it remains uncertain whether BMI has an effect on diagnosis of diabetes by different criteria.
4.2. Characteristics of Subjects with Diabetes Defined by Different Diagnostic Criteria
In our population, subjects with diabetes detected by OGTT only had a worse cardiometabolic risk profile than those detected by HbA1c only. Previous studies have shown conflicting results; some have found the worst risk profiles in subjects with diabetes defined by OGTT [6, 8, 9], some in subjects with diabetes defined by HbA1c [26], and some have found the two groups to have equally unfavourable risk profiles [8, 10]. In the international A1C-Derived Average Glucose study including 427 subjects with diabetes, HbA1c, FPG, and 2hPG were all associated with CVD risk factors, but the strongest association was seen with HbA1c [27]. We did not have data to evaluate the risk of diabetes complications in the different groups. Although both HbA1c and 2hPG have been shown to be independent risk factors for cardiovascular morbidity and mortality, the added prognostic information may be marginal as compared to standard nonglycaemic risk factors [28–30]. In a prospective study based on the Norwegian population-based longitudinal HUNT study, the risk of macrovascular complications in subjects with relatively low HbA1c values was found to be mainly related to conventional risk factors [31].
The strength of our study is that OGTT was performed in a large number of subjects recruited from a population representative of the general population in our area. The main shortcomings of our study are that only subjects with HbA1c in the range of 5.3–6.9% were invited to participate and that subjects included at an early stage of the study did not have HbA1c measured simultaneously with the OGTT, but were included in the analysis with the HbA1c value measured in the Tromsø Study 2007-2008. We chose to include these subjects in the analysis as we found that change in HbA1c from the Tromsø Study to the OGTT visit was negligible for those who had HbA1c measured at both occasions. Furthermore, in the absence of clear symptoms, diagnosis of diabetes requires raised values of HbA1c, FPG, or 2hPG on two occasions. For practical reasons, we did not repeat either HbA1c, or the OGTTs, but chose to classify subjects with a single raised value of HbA1c, FPG, or 2hPG as having diabetes. As FPG, and especially 2hPG, are known to have high within-person variation, repeating the OGTTs to confirm the diagnosis would probably have reduced the number of subjects with diabetes detected by OGTT [32]. HbA1c is known to be affected by anaemia. Hb was measured in the Tromsø Study 2007-2008, but not simultaneously as OGTT. However, anaemia is not a source of error when analysing HbA1c with the HPLC method used in our study as the analysis is not performed if there are too few or too many erythrocytes in the sample. Haemolytic anaemia could result in falsely low HbA1c, but the condition is rare in our population and is not likely to affect the results. Other shortcomings are that we did not have information about retinopathy or other end organ diseases, and that we did not differentiate between type 1 and type 2 diabetes. However, as subjects in our study did not have previously diagnosed diabetes and age ranged from 30–87 years, most diabetes cases were likely to be type 2 diabetes. The cross-sectional study design is a major limitation when evaluating the impact of using different diagnostic criteria for diabetes. Prospective studies are needed to clarify which test detects the population with the highest risk of disease progression and complications of diabetes.
5. Conclusions
The current HbA1c and glucose criteria for diabetes defined different subjects with only modest overlap. Among those with diabetes detected by OGTT (regardless of HbA1c), isolated raised 2-hour plasma glucose was more common in subjects aged ≥ 60 years as compared to younger subjects, and in elderly women as compared to elderly men. As race, age, sex, and possibly BMI seem to affect HbA1c, FPG, and 2hPG and the relationship between these, creating an algorithm for choice of diagnostic test in different subgroups is a possibility and may be beneficial. If the aim is to detect as many patients with diabetes as possible, our data suggest that OGTT would be preferable for those aged ≥ 60 years, and especially women, while HbA1c would be preferable for the younger and those with low BMI. However, in order to decide which diagnostic test should be preferred, and whether race, age, sex, and/or BMI specific guidelines should be considered, prospective studies with micro- and macrovascular end-points are needed.
Ethical Approval
The study was approved by the Regional Committee for Medical and Health Research Ethics, North Norway. All participants gave written informed consent prior to the study.
Conflict of Interests
No potential conflict of interests relevant to this paper was reported.
Authors' Contribution
M. S. Hutchinson gathered and researched data and wrote the paper. R. M. Joakimsen contributed to the discussion and reviewed the paper. I. Njølstad was responsible for the Tromsø Study data and reviewed the paper. H. Schirmer contributed to the discussion and reviewed the paper. Y. Figenschau was responsible for the laboratory analyses and reviewed the paper. J. Svartberg contributed to the discussion and reviewed the paper. R. Jorde led the Tromsø OGTT Study, contributed to the discussion and reviewed the paper.
Acknowledgments
The superb assistance provides by study nurse Anita Korsberg and the staff at the Clinical Research Unit at the University Hospital of North Norway as well as the staff at the Division of Laboratory Medicine, University Hospital of North Norway, is gratefully acknowledged. The present study was supported by a grant from The Northern Norway Regional Health Authority and the Research Council of Norway.
Abbreviations
- Hb:
Haemoglobin
- HbA1c:
Haemoglobin A1c
- OGTT:
Oral glucose tolerance test
- FPG:
Fasting plasma glucose
- 2hPG:
2-hour plasma glucose
- HPLC:
High precision liquid chromatography
- BMI:
Body mass index
- HOMA-IR:
Homeostasis model assessment-insulin resistance
- QUICKI:
Quantitative insulin-sensitivity check index
- ISI0.120:
Insulin sensitivity index,
- PAS:
Physical activity score
- TG:
Triglycerides.
References
- 1.World Health Organization. Use of Glycated Haemoglobin (HbA1c) in the Diagnosis of Diabetes Mellitus: Abbreviated Report of a WHO Consultation. Geneva, Switzerland: World Health Organization; 2011. [PubMed] [Google Scholar]
- 2.American Diabetes Association. Diagnosis and classification of diabetes mellitus. Diabetes Care. 2012;35(supplement 1):S64–S71. doi: 10.2337/dc12-s064. [DOI] [PMC free article] [PubMed] [Google Scholar]
- 3.Sacks DB. A1C versus glucose testing: a comparison. Diabetes Care. 2011;34(2):518–523. doi: 10.2337/dc10-1546. [DOI] [PMC free article] [PubMed] [Google Scholar]
- 4.Report of the expert committee on the diagnosis and classification of diabetes mellitus. Diabetes Care. 1997;20(7):1183–1197. doi: 10.2337/diacare.20.7.1183. [DOI] [PubMed] [Google Scholar]
- 5.Colagiuri S, Lee CMY, Wong TY, Balkau B, Shaw JE, Borch-Johnsen K. Glycemic thresholds for diabetes-specific retinopathy: implications for diagnostic criteria for diabetes. Diabetes Care. 2011;34(1):145–150. doi: 10.2337/dc10-1206. [DOI] [PMC free article] [PubMed] [Google Scholar]
- 6.Rathmann W, Kowall B, Tamayo T, et al. Hemoglobin A1c and glucose criteria identify different subjects as having type 2 diabetes in middle-aged and older populations: The KORA S4/F4 Study. Annals of Internal Medicine. 2012;44(2):170–177. doi: 10.3109/07853890.2010.531759. [DOI] [PubMed] [Google Scholar]
- 7.Cowie CC, Rust KF, Byrd-Holt DD, et al. Prevalence of diabetes and high risk for diabetes using A1C criteria in the U.S. population in 1988–2006. Diabetes Care. 2010;33(3):562–568. doi: 10.2337/dc09-1524. [DOI] [PMC free article] [PubMed] [Google Scholar]
- 8.Borg R, Vistisen D, Witte DR, Borch-Johnsen K. Comparing risk profiles of individuals diagnosed with diabetes by OGTT and HbA1cThe Danish Inter99 study. Diabetic Medicine. 2010;27(8):906–910. doi: 10.1111/j.1464-5491.2010.03034.x. [DOI] [PubMed] [Google Scholar]
- 9.Mostafa SA, Davies MJ, Webb D, et al. The potential impact of using glycated haemoglobin as the preferred diagnostic tool for detecting Type 2 diabetes mellitus. Diabetic Medicine. 2010;27(7):762–769. doi: 10.1111/j.1464-5491.2010.03015.x. [DOI] [PubMed] [Google Scholar]
- 10.Cosson E, Nguyen MT, Hamo-Tchatchouang E, et al. What would be the outcome if the American Diabetes Association recommendations of 2010 had been followed in our pratice in 1998–2006? Diabetic Medicine. 2011;28(5):567–574. doi: 10.1111/j.1464-5491.2010.03215.x. [DOI] [PubMed] [Google Scholar]
- 11.Lorenzo C, Haffner SM. Performance characteristics of the new definition of diabetes: the insulin resistance atherosclerosis study. Diabetes Care. 2010;33(2):335–337. doi: 10.2337/dc09-1357. [DOI] [PMC free article] [PubMed] [Google Scholar]
- 12.Christensen DL, Witte DR, Kaduka L, et al. Moving to an A1C-based diagnosis of diabetes has a different impact on prevalence in different ethnic groups. Diabetes Care. 2010;33(3):580–582. doi: 10.2337/dc09-1843. [DOI] [PMC free article] [PubMed] [Google Scholar]
- 13.Saltevo JT, Kautiainen H, Niskanen L, et al. Ageing and associations of fasting plasma glucose and 2h plasma glucose with HbA(1C) in apparently healthy population., “FIN-D2D” study. Diabetes Research and Clinical Practice Journal. 2011;93:344–349. doi: 10.1016/j.diabres.2011.05.006. [DOI] [PubMed] [Google Scholar]
- 14.Hutchinson MS, Joakimsen RM, Njolstad I, Schirmer H, Figenschau Y, Jorde R. Haemoglobin A1c in diagnosis of diabetes mellitus and pre-diabetes, validation by oral glucose tolerance test. The Tromso OGTT Study. Journal of Endocrinological Investigation. 2012;35(9):835–840. doi: 10.3275/8191. [DOI] [PubMed] [Google Scholar]
- 15.Little RR, Rohlfing CL, Sacks DB. Status of hemoglobin A1c measurement and goals for improvement: from Chaos to order for improving diabetes care. Clinical Chemistry. 2011;57(2):205–214. doi: 10.1373/clinchem.2010.148841. [DOI] [PubMed] [Google Scholar]
- 16.Katz A, Nambi SS, Mather K, et al. Quantitative insulin sensitivity check index: a simple, accurate method for assessing insulin sensitivity in humans. Journal of Clinical Endocrinology and Metabolism. 2000;85(7):2402–2410. doi: 10.1210/jcem.85.7.6661. [DOI] [PubMed] [Google Scholar]
- 17.Matthews DR, Hosker JP, Rudenski AS, Naylor BA, Treacher DF, Turner RC. Homeostasis model assessment: Insulin resistance and β-cell function from fasting plasma glucose and insulin concentrations in man. Diabetologia. 1985;28(7):412–419. doi: 10.1007/BF00280883. [DOI] [PubMed] [Google Scholar]
- 18.Gutt M, Davis CL, Spitzer SB, et al. Validation of the insulin sensitivity index (ISI0,120): comparison with other measures. Diabetes Research and Clinical Practice. 2000;47(3):177–184. doi: 10.1016/s0168-8227(99)00116-3. [DOI] [PubMed] [Google Scholar]
- 19.International Expert Committee report on the role of the A1C assay in the diagnosis of diabetes. Diabetes Care. 2009;32:1327–1334. doi: 10.2337/dc09-9033. [DOI] [PMC free article] [PubMed] [Google Scholar]
- 20.Consequences of the new diagnostic criteria for diabetes in older men and women: The DECODE Study (Diabetes Epidemiology: Collaborative Analysis of Diagnostic Criteria in Europe) Diabetes Care. 1999;22(10):1667–1671. doi: 10.2337/diacare.22.10.1667. [DOI] [PubMed] [Google Scholar]
- 21.Davidson MB. The effect of aging on carbohydrate metabolism: a review of the English literature and a practical approach to the diagnosis of diabetes mellitus in the elderly. Metabolism: Clinical and Experimental. 1979;28(6):688–705. doi: 10.1016/0026-0495(79)90024-6. [DOI] [PubMed] [Google Scholar]
- 22.Iozzo P, Beck-Nielsen H, Laakso M, Smith U, Yki-Järvinen H, Ferrannini E. Independent influence of age on basal insulin secretion in nondiabetic humans. Journal of Clinical Endocrinology and Metabolism. 1999;84(3):863–868. doi: 10.1210/jcem.84.3.5542. [DOI] [PubMed] [Google Scholar]
- 23.Imbeault P, Prins JB, Stolic M, et al. Aging per se does not influence glucose homeostasis: in vivo and in vitro evidence. Diabetes Care. 2003;26(2):480–484. doi: 10.2337/diacare.26.2.480. [DOI] [PubMed] [Google Scholar]
- 24.Færch K, Borch-Johnsen K, Vaag A, Jørgensen T, Witte DR. Sex differences in glucose levels: a consequence of physiology or methodological convenience? the Inter99 study. Diabetologia. 2010;53(5):858–865. doi: 10.1007/s00125-010-1673-4. [DOI] [PubMed] [Google Scholar]
- 25.Sicree RA, Zimmet PZ, Dunstan DW, Cameron AJ, Welborn TA, Shaw JE. Differences in height explain gender differences in the response to the oral glucose tolerance test—The AusDiab study. Diabetic Medicine. 2008;25(3):296–302. doi: 10.1111/j.1464-5491.2007.02362.x. [DOI] [PubMed] [Google Scholar]
- 26.Boronat M, Saavedra P, Lopez-Rios L, Riano M, Wagner AM, Nóvoa FJ. Differences in cardiovascular risk profile of diabetic subjects discordantly classified by diagnostic criteria based on glycated hemoglobin and oral glucose tolerance test. Diabetes Care. 2010;33(12):2671–2673. doi: 10.2337/dc10-0529. [DOI] [PMC free article] [PubMed] [Google Scholar]
- 27.Borg R, Kuenen JC, Carstensen B, et al. HbA1cand mean blood glucose show stronger associations with cardiovascular disease risk factors than do postprandial glycaemia or glucose variability in persons with diabetes: The A1C-Derived Average Glucose (ADAG) study. Diabetologia. 2011;54(1):69–72. doi: 10.1007/s00125-010-1918-2. [DOI] [PMC free article] [PubMed] [Google Scholar]
- 28.Khaw KT, Wareham N, Bingham S, Luben R, Welch A, Day N. Association of hemoglobin A1c with cardiovascular disease and mortality in adults: The European prospective investigation into cancer in Norfolk. Annals of Internal Medicine. 2004;141(6):413–420. doi: 10.7326/0003-4819-141-6-200409210-00006. [DOI] [PubMed] [Google Scholar]
- 29.Meigs JB, Nathan DM, D’Agostino RB, Wilson PWF. Fasting and postchallenge glycemia and cardiovascular disease risk: the framingham offspring study. Diabetes Care. 2002;25(10):1845–1850. doi: 10.2337/diacare.25.10.1845. [DOI] [PubMed] [Google Scholar]
- 30.The DECODE Study Group. Glucose tolerance and cardiovascular mortality: comparison of fasting and 2-hour diagnostic criteria. Archives of Internal Medicine. 2001;161:397–405. doi: 10.1001/archinte.161.3.397. [DOI] [PubMed] [Google Scholar]
- 31.Dale AC, Midthjell K, Nilsen TI, Wiseth R, Vatten LJ. Glycaemic control in newly diagnosed diabetes patients and mortality from ischaemic heart disease: 20-year follow-up of the HUNT Study in Norway. European Heart Journal. 2009;30(11):1372–1377. doi: 10.1093/eurheartj/ehp039. [DOI] [PubMed] [Google Scholar]
- 32.Selvin E, Crainiceanu CM, Brancati FL, Coresh J. Short-term variability in measures of glycemia and implications for the classification of diabetes. Archives of Internal Medicine. 2007;167(14):1545–1551. doi: 10.1001/archinte.167.14.1545. [DOI] [PubMed] [Google Scholar]