Abstract
We demonstrate a personalized food allergen testing platform, termed iTube, running on a cellphone that images and automatically analyses colorimetric assays performed in test tubes toward sensitive and specific detection of allergens in food samples. This cost-effective and compact iTube attachment, weighing approximately 40 grams, is mechanically installed on the existing camera unit of a cellphone where the test and control tubes are inserted from the side and are vertically illuminated by two separate light-emitting-diodes. The illumination light is absorbed by the allergen assay that is activated within the tubes, causing an intensity change in the acquired images by the cellphone camera. These transmission images of the sample and control tubes are digitally processed within1 sec using a smart application running on the same cellphone for detection and quantification of allergen contamination in food products. We evaluated the performance of this cellphone based iTube platform using different types of commercially available cookies, where the existence of peanuts was accurately quantified after a sample preparation and incubation time of ~20 min per test. This automated and cost-effective personalized food allergen testing tool running on cellphones can also permit uploading of test results to secure servers to create personal and/or public spatio-temporal allergen maps, which can be useful for public health in various settings.
Introduction
Food allergy is an emerging public concern, affecting as many as 8% of young children and 2% of adults especially in developed countries1–3. Allergic reactions might be life-threating by inducing e.g., respiratory and gastrointestinal symptoms, systemic, cutaneous and fatal reactions, which can even be triggered by small traces of food allergens3–6. Although food consumer protection act7 ensures the safety of the allergic individuals by labelling pre-packaged food with a list of potential allergen-related ingredients, there might be still hidden amounts of allergens in processed food due to possible cross-contamination occurring in the processing, manufacturing and transportation of food samples8–11. Toward detection of such hidden allergens in food products, numerous analytical methods have been developed, including the ones that are based on polymerase chain reaction (PCR)12, mass spectroscopy13, antibody based immunoassays14, surface-plasmon-resonance (SPR) biosensors15, array immunoassays16, electrochemical immunosensors17 and others18. These existing approaches have achieved very high sensitivities; however, they are relatively complex and require bulky equipment to perform the test, making them less suitable for personal use in public settings.
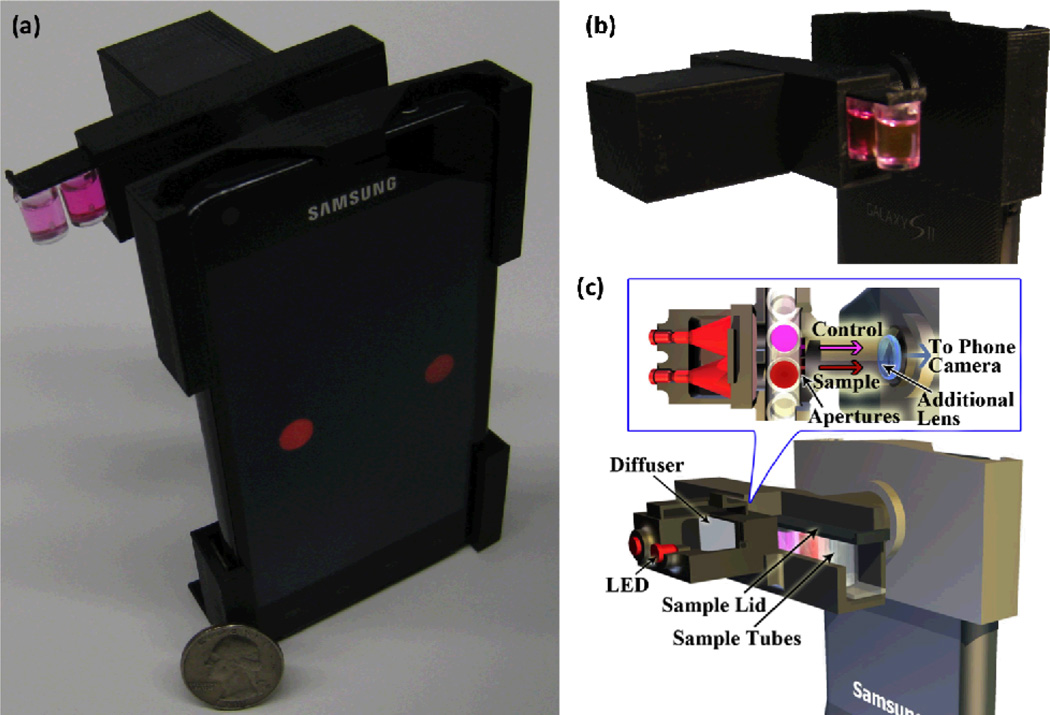
To provide an alternative solution to this important need, here we demonstrate a personalized allergen testing platform (termed iTube) running on a smart phone, which utilizes a sensitive colorimetric assay processed in test tubes for specific detection and quantification of allergens in food products (see Fig. 1). This iTube platform, weighing approximately 40 grams, images the test tube along with a control tube using a cost-effective opto-mechanical attachment to the cellphone camera unit. This attachment is composed of an inexpensive plastic plano-convex lens, two light-emitting diodes (LEDs), two light diffusers, and circular apertures to spatially control the imaging field-of-view. The test and control tubes, once activated with an allergen-specific sample preparation and closed with lids, are then inserted into this attachment from the side where the transmission intensities for each tube are acquired using the cellphone camera (see Fig. 1). These tube images are then digitally processed within one second through a custom-developed smart application running on the cellphone for quantification of the amount of allergen present in the sample as illustrated in Figure 2.
Fig. 1.
(a) A picture of the iTube platform, utilizing colorimetric assays and a smart phone based digital reader, is shown. (b) The opto-mechanical attachment that is installed at the back of the cellphone is shown; dimensions: ~ 22 mm × 67 mm × 75 mm. (c) The schematic diagram of the same iTube platform is also illustrated.
Fig. 2.
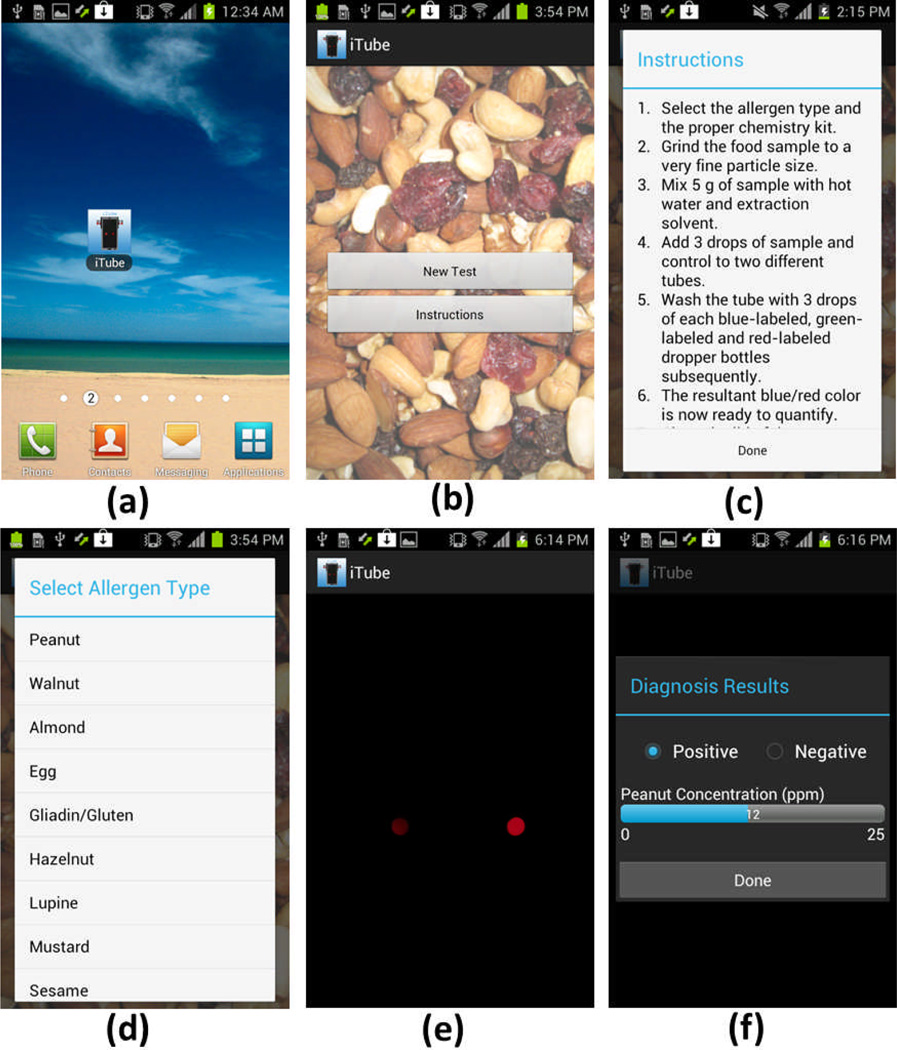
Screenshots of our iTube application running on an Android cellphone are shown. (a) Once the application runs, either New Test or Instructions tab can be selected. (c) The user can read the testing protocol explained under Instructions. (d) With the selection of New Test, an allergen type of interest can be designated within the pop-up menu. (e) Following the activation of the cellphone camera, the user can simply touch the screen to capture the transmission images of the test and control tubes. (f) The acquired images are rapidly processed on the cellphone to quantify the allergen amount within the target food sample.
Compared to visual inspection of the same tube assay by human eye, a separate optical readout with its own software and optimized illumination and imaging configuration is significantly more sensitive, repeatable, and immune from manual reading errors. Furthermore, it also permits digital quantification of allergen concentration beyond a yes/no decision. When compared to digital processing of cellphone camera pictures taken without a separate read-out attachment, i.e., under ambient light, the presented approach is much more robust since it is independent of the optical spectrum or intensity of external lighting conditions which might significantly vary based on the setting that the test is used, and therefore could result in sensitivity problems in e.g., airplanes or other poorly illuminated environments. Furthermore, using a separate optical attachment on the cellphone, as presented in our work, eliminates possible image artefacts due to the hand motion of the user, creating a more repeatable, reliable and sensitive platform for personal use in various public health settings including e.g., restaurants, schools, airplanes, etc.
Methods
Overview of the iTube platform
In this cellphone based iTube platform, we designed a cost-effective digital tube reader and a smart application that measures the absorption of colorimetric assays and digitally converts raw transmission images captured by the cellphone into concentration measurements of the allergen traces detected in food samples.
Hardware design
Our digital reader was implemented on an Android phone (Samsung Galaxy S II, 1.2 GHz Dual Core ARM Cortex-A9 Processor, 8MP Camera with F/2.65 aperture and 4 mm focal length lens). The same tube reader can also be built on other smart-phones, including iPhone as well as other Android devices with slight mechanical modifications. The 3D structure of the cellphone attachment was designed using Inventor software (Autodesk) and built using a 3D printer (Elite, Dimension), providing a lightweight (~ 40 grams) and robust hardware that can be operated in field conditions. In our design, we utilized two interchangeable LEDs (Digikey, 751–1089-ND, 650 nm peak wavelength with 15 nm bandwidth) to vertically illuminate the test and control tubes (see Fig. 1).The wavelength of these LEDs was specifically chosen to match the absorption spectrum of the colorimetric assay performed in the test tube. To uniformly illuminate the cross-section of each tube (i.e., 8 mm × 12 mm), two diffusers (Digikey, 67–1845-ND) were also inserted between the LEDs and the tubes. The transmitted light through each tube of interest is then collected via two circular apertures (1.5 mm diameter) to be imaged onto the digital camera of the cellphone using a plano-convex lens (Edmund Optics, NT65–576, Focal length ~ 28 mm). This imaging configuration provides an optical demagnification of the tube cross-section by 28/4 =7 fold, which permits fitting both the test (i.e., sample) and control tubes into the field-of-view of the cellphone camera (see Fig. 1(a) or 2(e)).
Android based smart application
We developed an Android application, which functions as follows (see Fig. 2):
-
(a)
The user clicks on the iTube icon and starts to run our smart application on the mobile phone.
-
(b–d)
The new window provides two options: Either New Test or Instructions. Once Instructions tab is selected, the user protocol for allergen testing is displayed (see Fig. 2(c)). Otherwise, if New Test is selected, the user is asked to identify the allergen type to be tested (Fig. 2(d)).
-
(e)
When the user decides on the type of the allergen to be tested (e.g., peanut), the cellphone application powers on the digital camera of the phone. The user can then touch the screen of the mobile phone to simultaneously capture the transmission images of the tubes (i.e., both the sample and control tubes).
-
(f)
These captured images are processed within one second (see the next subsection on digital processing for details) to determine the concentration of the selected allergen within a range of 1 to 25 parts per million (ppm). The test result is displayed as “positive” for ≥1 ppm or “negative” for < 1 ppm.
Digital processing of tube images
The acquired transmission images of tubes (sample and control) are first converted into binary mask images by localizing their centroids. A rectangular frame (i.e., 300 × 300 pixels) around each one of these centroids is then used to calculate a transmission signal per tube. The resulting signal of the control tube is divided by a normalization factor (see the System Calibration subsection for details), and then is divided by the signal calculated for the sample tube to determine the relative absorbance (A) of the assay, which scales with the allergen concentration within the sample. Finally, this relative absorbance value is divided by a calibration factor (refer to Figure 3 and the System Calibration subsection for details), yielding the final concentration of the allergen (in ppm) measured within the sample of interest.
Fig. 3.
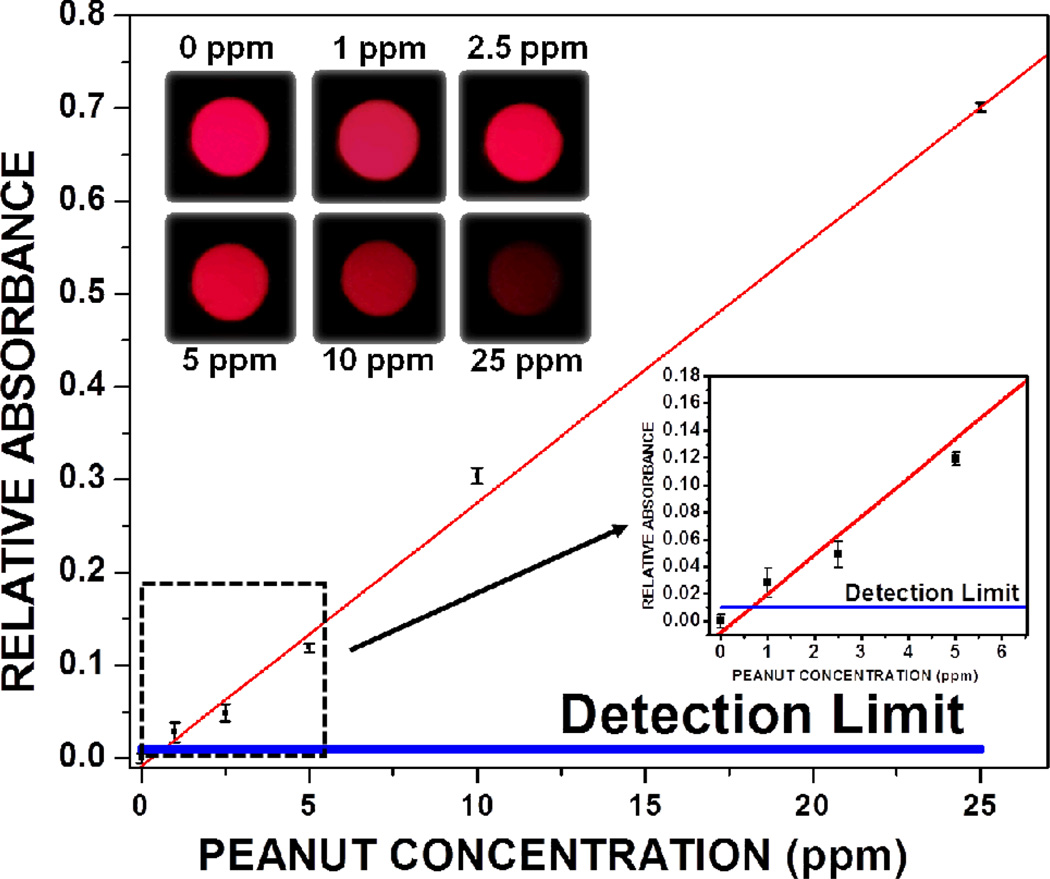
Dose-response curve for peanut allergen detection through iTube platform is illustrated. For this curve, 6 different sets of calibration samples (0, 1, 2.5, 5, 10 and 25 ppm) were measured and converted into relative absorbance values (i.e., A). The inset shows that even very low absorbance values can be quantified, yielding ~ 1 ppm as our minimum detectable peanut concentration, calculated by adding twice the standard deviation to the control tube signal level.
Colorimetric assay preparation
In this work, to demonstrate the proof of concept of our iTube platform, colorimetric assays were performed based on a food allergy test kit that is specific to peanuts, i.e., Veratox test kit, Neogen, 8430. The assay preparation starts with grinding the target food sample to a fine particle size and then ~5 grams of the ground food sample is mixed with hot water (50–60°C) and extraction solvent. Three drops of this sample solution and the control solution that does not contain any food, are added separately to two different tubes. Following ~10 minutes of incubation, the test and control tubes are rinsed sequentially with 3 drops of blue-labelled (conjugate), green-labelled (substrate) and red-labelled (stop solution) dropper bottles, where a wash buffer is also used to thoroughly clean the tubes in between each step, all of which add another ~10 minutes to sample preparation in total. The resultant blue and red mixture colour activated in the tubes can then be measured by our digital reader implemented on a cellphone, providing a quantified measurement of the peanut concentration within the sample.
System calibration
Our iTube platform was calibrated by testing known amounts of peanut concentrations, ranging from 0 ppm, 1 ppm, 2.5 ppm, 5 ppm, 10 ppm and 25 ppm (see Fig. 3). These calibration samples were then digitally quantified using iTube to find the relative absorbance (A) of each test tube:
| (1) |
where Itest is the transmitted signal for the test tube and Icontrol is the transmitted signal for the control tube. Assuming that the optical properties (e.g., reflection, absorption) of the tube containers are the same for both the sample and control tubes and that the illumination is uniform, i.e., approximately the same for both tubes, then would be correlated to the concentration of the allergen in the sample tube. In our iTube platform, however, the LED intensity illuminating the control tube was measured to be slightly higher (i.e., 1.15 fold), and therefore we divided the transmitted control signal (Icontrol) by a normalization factor of 1.15 to take this into account. Following 4 different tests for each concentration of peanuts (spanning 0 ppm to 25 ppm), the calibration curve of Figure 3 provides a linear fit with R=0.99, i.e., A = 0.028 * C, where C is the peanut concentration in ppm. This linear fit/equation is used to quantify the target allergen concentration (C) in a given food product of interest by measuring the relative absorbance of the target sample (A). Based on these calibration experiments, our peanut detection limit is also found as ~ 1 ppm as illustrated in Fig. 3.
Results and Discussion
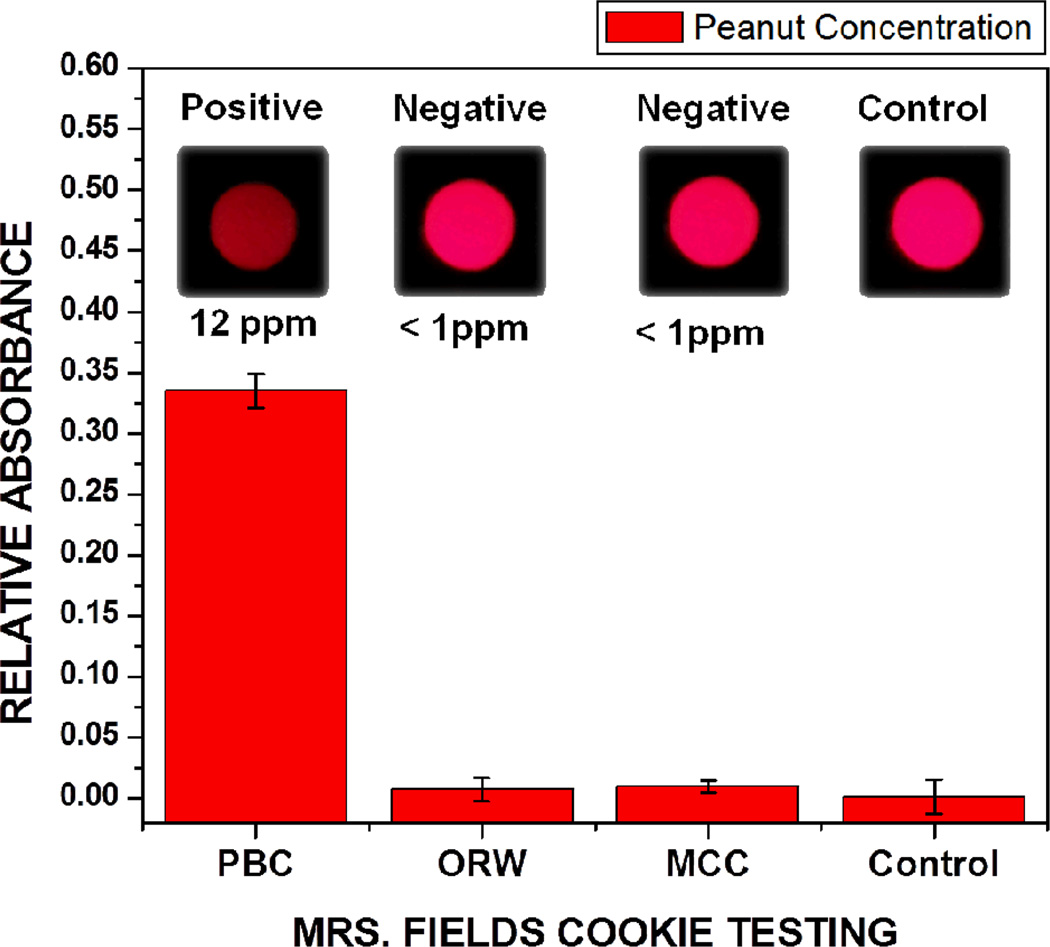
We evaluated the performance of this iTube platform by testing 3 different kinds of Mrs. Fields Cookies (a commercial brand), such that peanut butter chocolate (PBC), oatmeal raisin with walnut (ORW) and milk chocolate chip (MCC) cookies were tested (each repeated 3 times) for quantification of their peanut concentrations. Our test results (see Fig. 4), processed through the iTube application running on the cellphone, revealed the following:
PBC was found positive for peanut testing and had a relative absorbance value of 0.33, corresponding to a peanut concentration of 12 ppm. We should emphasize that in these measurements we diluted the PBC extract at least 5,000 times with phosphate buffered saline (PBS) solution so that the relative absorbance value remains within the range of our calibration curve. Therefore, the actual peanut concentration within the PBC sample was in fact >60,000 ppm. This large dilution factor is not necessary for practical purposes since such high concentrations of allergens are not as important as “hidden” contamination cases, and therefore quantification of these high concentration levels is not necessarily useful for our personalized allergen testing platform. If desired, however, a set of successive measurements with varying dilution levels could be used to accurately quantify allergen concentrations that are e.g., larger than 1,000 ppm.
ORW was negative for peanut testing and had negligible relative absorbance, corresponding to a peanut concentration of < 1 ppm, i.e., at the level of our control tube signal. In this case, we did not get any positive signal due to walnuts present in this cookie, verifying the specificity of our test results to peanuts.
MCC was also found negative for peanut testing and had negligible absorbance, corresponding toa peanut concentration of < 1 ppm.
Fig. 4.
Testing of the peanut concentrations of different cookies is demonstrated through iTube platform, where 3 sets of peanut butter chocolate (PBC), oatmeal raisin with walnut (ORW) and milk chocolate chip (MCC) cookies were measured. Note that we diluted the PBC extract at least 5,000 times with PBS solution so that the relative absorbance value remains within the range of our calibration curve. This large dilution factor is not necessary for practical purposes since such high concentrations of allergens would not be observed in “hidden” contamination cases.
Although the presented work was performed for peanut allergen testing, the iTube platform can be employed for a variety of other allergens, including e.g., almond, egg, gluten, hazelnut, lupine, mustard, sesame, crustacean, soy as well as milk19–22. The allergic individuals can choose the allergen type from the smart-phone application menu (Fig. 2d), which should be pre-programmed with different calibration factors for each allergen type of interest and its associated test kit.
Finally, as the allergic individuals use the iTube platform to perform allergen testing, the test results of various food products can be uploaded to iTubeservers to create a personalized testing archive, which could provide additional resources for allergic individuals globally. Such a statistical allergy database and its spatio-temporal analysiscould especially be useful for food related regulations and policies instructed in for example restaurants, food production lines as well as consumer protection organizations.
Conclusions
We demonstrated a personalized allergen testing platform (termed iTube), utilizing colorimetric assays performed in test tubes and smart-phone based digital analysis, to specifically and sensitively detect and quantify the allergen concentration in food products. Such a cost-effective and personalized allergen testing tool, combined with an easy-to-use and rapid application running on a cellphone, could especially be useful for public health in various settings, including e.g., schools, restaurants, airplanes as well as other public venues.
Acknowledgments
A. Ozcan gratefully acknowledges the support of the Presidential Early Career Award for Scientists and Engineers (PECASE), Army Research Office Young Investigator Award, National Science Foundation CAREER Award, Office of Naval Research Young Investigator Award and National Institutes of Health Director's New Innovator Award DP2OD006427 from the Office of the Director, National Institutes of Health.
Notes and references
- 1.Sampson HA. Journal of Allergy and Clinical Immunology. 1999;103:717–728. doi: 10.1016/s0091-6749(99)70411-2. [DOI] [PubMed] [Google Scholar]
- 2.Sampson HA. J. Allergy Clin. Immunol. 2003;111:S540–S547. doi: 10.1067/mai.2003.134. [DOI] [PubMed] [Google Scholar]
- 3.Besler UM. TrAC Trends in Analytical Chemistry. 2001;20:662–672. [Google Scholar]
- 4.Yunginger JW, Sweeney KG, Sturner WQ, Giannandrea LA, Teigland JD, Bray M, Benson PA, York JA, Biedrzycki L, Squillace DL. JAMA. 1988;260:1450–1452. [PubMed] [Google Scholar]
- 5.Wüthrich B. J Investig Allergol Clin Immunol. 2000;10:59–65. [PubMed] [Google Scholar]
- 6.Poms RE, Klein CL, Anklam E. Food Additives and Contaminants. 2004;21:1–31. doi: 10.1080/02652030310001620423. [DOI] [PubMed] [Google Scholar]
- 7.Food Allergen Labeling and Consumer Protection Act. 2004 doi: 10.1016/j.jada.2006.08.010. Public Law 108–282, Title II. [DOI] [PubMed] [Google Scholar]
- 8.Besler M, Steinhart H, Paschke A. Journal of Chromatography B: Biomedical Sciences and Applications. 2001;756:207–228. doi: 10.1016/s0378-4347(01)00110-4. [DOI] [PubMed] [Google Scholar]
- 9.Kirsch S, Fourdrilis S, Dobson R, Scippo M-L, Maghuin-Rogister G, De Pauw E. Analytical and Bioanalytical Chemistry. 2009;395:57–67. doi: 10.1007/s00216-009-2869-7. [DOI] [PubMed] [Google Scholar]
- 10.Taylor SL, Hefle SL. Current Opinion in Allergy and Clinical Immunology. 2006;6:186–190. doi: 10.1097/01.all.0000225158.75521.ad. [DOI] [PubMed] [Google Scholar]
- 11.Stephan O, Vieths S. J. Agric. Food Chem. 2004;52:3754–3760. doi: 10.1021/jf035178u. [DOI] [PubMed] [Google Scholar]
- 12.Poms RE, Anklam E, Kuhn M. Journal of AOAC International. 2004;87:1391–1397. [PubMed] [Google Scholar]
- 13.Careri M, Elviri L, Maffini M, Mangia A, Mucchino C, Terenghi M. Rapid Communications in Mass Spectrometry. 2008;22:807–811. doi: 10.1002/rcm.3427. [DOI] [PubMed] [Google Scholar]
- 14.Yman IM, Eriksson A, Johansson MA, Hellens K-E. Journal of AOAC International. 2006;89:856–861. [PubMed] [Google Scholar]
- 15.Pollet J, Delport F, Janssen KPF, Tran DT, Wouters J, Verbiest T, Lammertyn J. Talanta. 2011;83:1436–1441. doi: 10.1016/j.talanta.2010.11.032. [DOI] [PubMed] [Google Scholar]
- 16.Shriver-Lake LC, Taitt CR, Ligler FS. J AOAC Int. 2004;87:1498–1502. [PubMed] [Google Scholar]
- 17.Liu H, Malhotra R, Peczuh MW, Rusling JF. Anal. Chem. 2010;82:5865–5871. doi: 10.1021/ac101110q. [DOI] [PMC free article] [PubMed] [Google Scholar]
- 18.Narsaiah K, Jha S, Bhardwaj R, Sharma R, Kumar R. Journal of Food Science and Technology. 2012;49:383–406. doi: 10.1007/s13197-011-0437-6. [DOI] [PMC free article] [PubMed] [Google Scholar]
- 19.Lee P-W, Niemann LM, Lambrecht DM, Nordlee JA, Taylor SL. Journal of Food Science. 2009;74:T46–T50. doi: 10.1111/j.1750-3841.2009.01162.x. [DOI] [PubMed] [Google Scholar]
- 20.Cucu T, Platteau C, Taverniers I, Devreese B, de Loose M, de Meulenaer B. Food Additives & Contaminants: Part A. 2011;28:1–10. doi: 10.1080/19440049.2010.535026. [DOI] [PubMed] [Google Scholar]
- 21.L’Hocine L, Boye JI, Munyana C. Journal of Food Science. 2007;72:C145–C153. doi: 10.1111/j.1750-3841.2007.00298.x. [DOI] [PubMed] [Google Scholar]
- 22.Garber E, Perry J. Analytical and Bioanalytical Chemistry. 2010;396:1939–1945. doi: 10.1007/s00216-009-3424-2. [DOI] [PubMed] [Google Scholar]


