Abstract
The maturation of magnetic cell separation technology places increasing demands on magnetic cell separation performance. While a number of factors can cause suboptimal performance, one of the major challenges can be non-specific binding of magnetic nano or micro particles to non-targeted cells. Depending on the type of separation, this non-specific binding can have a negative effect on the final purity, the recovery of the targeted cells, or both. In this work, we quantitatively demonstrate that non-specific binding of magnetic nanoparticles can impart a magnetization to cells such that these cells can be retained in a separation column and thus negatively impact the purity of the final product and the recovery of the desired cells. Through experimental data and theoretical arguments, we demonstrate that the number of MACS magnetic particles needed to impart a magnetization that is sufficient to causes non-targeted cells to be retained in the column to be on the order of 500 to 1,000 nanoparticles. This number of non-specifically bound particles was demonstrated experimentally with an instrument, cell tracking velocimeter, CTV, and it is demonstrated that the sensitivity of the CTV instrument for Fe atoms contained in magnetic nanoparticles on the order of 1 × 10⁻¹⁵ g/mL of Fe.
Introduction
Immuno-magnetic separation is a rapidly growing technology widely used in biomolecular research and is beginning to penetrate the clinical market for the separation and/or purifications of targeted cell populations (i.e. CellSearch® Veridex, LLC). Currently available, commercial magnetic separation devices can be categorized into batch and semi-batch modes of operation. An example of a batch mode of operation is the Magnetic Particle Concentrator (MPC) developed by John Ugelstad and marketed under the tradename of Dynal™, in which the magnetically labeled cells are attracted to the magnet adjacent to the tube wall while the non-magnetic cells are decanted (Dynabeads Technology Overview). An example of the semi-batch mode of operation is the high-gradient magnetic separation system developed and marketed by Miltenyi Biotec and sold under the tradename of MACS™ family of separation systems. With the MACS systems, the unlabeled cells flow through a packed column while the magnetically labeled cells are retained (MACS® Technology information sheet). The magnetically labeled cells are subsequently collected by removing the packed column from the externally applied magnetic field and the magnetically labeled cells are then flushed out of the column.
Magnetic cell labeling
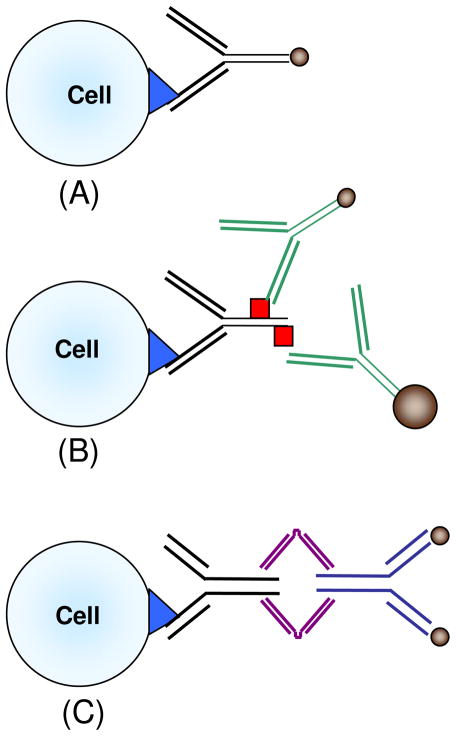
Fundamental to any magnetic cell separation approach are the magnetic forces that are applied to the targeted cells. This magnetic force is typically the result of an externally applied magnetic field interacting with magnetic nano or microparticles bound to the targeted cell, typically through an antibody-antigen interaction. As a result of the large number of commercially available antibodies, Abs, targeting thousands of different cell surface markers, there are typically three ways to magnetically label a cell (Figure 1): 1) a one-step labeling in which a magnetic particle (from 50 nanometers to over 1 micron in diameter) is conjugated to the Ab targeting the cell surface marker, 2) a two-step labeling, employing a primary Ab specific to the cell surface antigen and a secondary Ab targeting the primary Ab to which a magnetic particle is conjugated. The secondary Ab either targets the primary Ab, or a molecule bound to the primary antibody (i.e. FITC, PE, etc). A common alternative to antibody-antigen interactions for the primary-secondary interaction is streptavidin-biotin labeling. The third method, 3) is a combination of a one-step and a two-step approach: a tetrameric Ab is used that simultaneously targets a marker on the cell surface and a magnetic particle which is added as a second step after the cell has been labeled with the Ab.
Figure 1.
Example of a one step, (1A), two step, (1B), and a modified two step labeling process, (1C). The first two labeling techniques use an antibody conjugated to the magnetic particle. The third technique uses a tetrameric antibody complex, TAC, which is a fusion of two antibodies with two different affinities: one affinity is for the target molecule on the cell and the other affinity is for the magnetic nano, or microparticle.
Theoretical Considerations
Quantification of Magnetic Labeling
To obtain a high level of cell separation performance, optimization of the magnetic forces acting on the targeted cells is crucial. The magnetic force, on a per magnetic particle basis, is mathematically expressed as:
| (1) |
where φp is the field interaction parameter, B0 is the applied magnetic field induction, and Sm is the magnetic energy gradient (Zhang et al. 2005). The field interaction parameter is defined by:
| (2) |
or
| (3) |
where χp is the magnetic susceptibility of the magnetic particle, χf is the magnetic susceptibility of the suspending buffer (approximately −9.05 × 10⁻⁶), Vp is the volume of the magnetic particle, B is the magnitude of the magnetic field induction at the specific location of the magnetic particle, Bsat is the magnitude of the magnetic field induction above which the magnetic particle is saturated, Msat is the value of the magnetic saturation of magnetic particle, and μ0 is the magnetic permeability of free space (Zhang et al. 2005). Here the functional dependence of particle magnetization, M, on the applied field, B0, has been simplified to a linear function for low fields (Equation 2) and a constant for high fields (Equation 3). The need for presenting both Equation 2 and Equation 3, as was presented and discussed by Jin et al. 2008, exists since this Bsat value can be achieved, and surpassed, in a variety of magnetic cell separation instruments.
As presented in previous publications (Chalmers et al. 1999a; Moore et al. 2000; Zhang et al. 2006) an instrument was developed, referred to as Cell Tracking Velocimetry, CTV, and experimentally verified, which allows the magnetic force exerted on a cell or particle, either from bound magnetic labels, or intrinsic to the cell itself (Zborowski et al. 2003; Melnik et al. 2007) to be quantified. While the actual measurements made by the CTV instrument are induced velocities, either from the magnetic field induction, or gravity, the CTV program results are typically reported in the form of magnetophoretic mobility. Magnetophoretic mobility, m, has analogies to electrophoretic mobility and is mathematically defined by:
| (4) |
where vm is the magnetically induced velocity. In the case of the CTV instrument, the value of Sm is accurately known, and nearly constant in the microscopic viewing region; therefore, by experimentally determining the magnetically induced velocity through digitized video images and tracking algorithms, the CTV instrument can produce the histograms of a cell populations magnetophoretic mobility.
In addition to being experimentally measurable, this magnetophoretic mobility can be related to a number of parameters associated with an immunomagnetically labeled cell:
| (5) |
where ABC is the antibody binding capacity of the cell, β is the number of magnetic nanoparticles per antibody, DCell is the diameter of the cell, η is the viscosity of the suspending fluid, and mCell is the intrinsic magnetophoretic mobility of the cell without labeling (Zhang et al. 2005; 2006). For lymphocytes, this mobility has been reported to be from −5.2 × 10⁻⁶ mm3/T-A-s to 2 × 10⁻⁶ mm3/T-A-s (Zhang et al. 2005); however, for a small number of cases such as specific strains of the spore form of Bacillus, the intrinsic magnetophoretic mobility can be positive and significantly higher (Melnik et al. 2007).
In addition to further refining the previously presented relationships, Zhang et al. (2005) performed a study characterizing a number of commercial, magnetic nanoparticles with respect to the particle size and magnetic susceptibility. With such an analysis, estimates of φp were made and are reported. Table 1 presents these values from that publication.
Table 1.
The experimentally determined values of Msμ0/B0, magnetic saturation, Ms, the experimentally determined mean diameter, and the particle-field interaction parameter, φp, for the four types of magnetic nanobeads studied. From a previous study by Zhang et al., (2005)
| Magnetic Beads | Lot # | Ms μ0/B (SI unit system) | Ms (A/m) | Mean Diameter (nm) | φp (×10−25m3) |
|---|---|---|---|---|---|
| Streptavidin-MACS | 5020305031 | 1.1 ±0.3 E-03 | 1,100 | 116 | 8.8 ± 2.1 |
| 5020918049 | 1.4 ± 0.4 E-03 | 1,400 | 67.2 | 2.3 ± 0.6 | |
| BD Imag | 44023 | 1.4 ± 0.3 E-03 | 231 | 91 ± 20 | |
| Captivate | 71A1-1 | 3.8 ± 1.0 E-04 | 136 | 5.1 ± 1.4 | |
| EasySep | 2L226593 | 3.5 ±1.2 E-04 | 348 | 142 | 5.4 ± 2.0 |
| 3A317176 | 5.5 ±1.8 E-05 | 55 | 160 | 12 ± 4 |
By rearranging Equation 5, the number of magnetic nanoparticles immunomagnetically bound to a cell, βABC, can be determined if one knows the magnetophoretic mobility, the cell diameter, the solution viscosity, and the field interaction parameter, φp, for the specific magnetic particle used to label the cell:
| (6) |
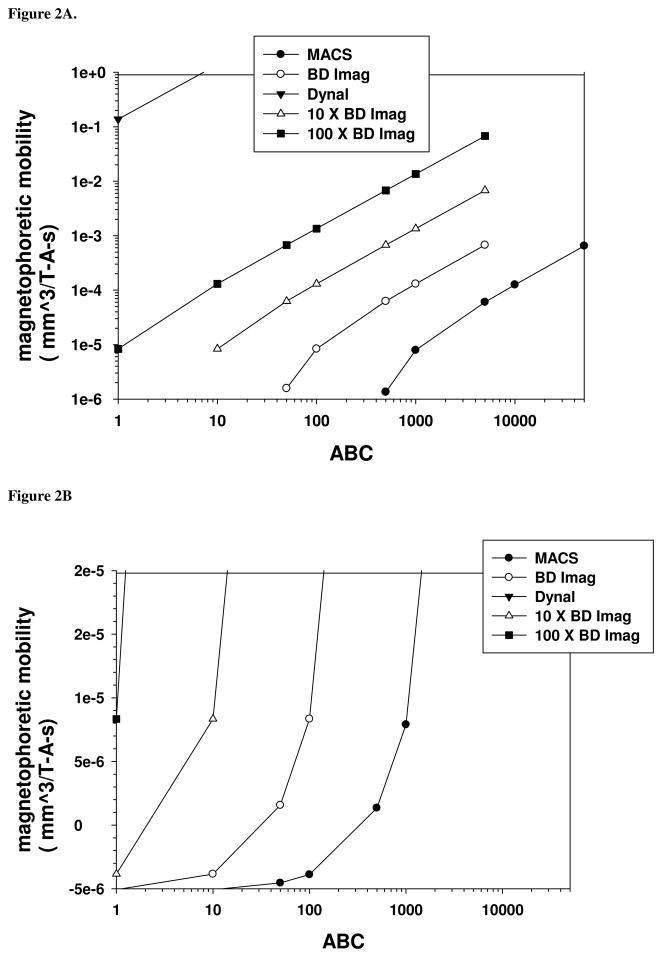
Using values of φp for various magnetic particles, estimates of the cell diameter and solution viscosity, and assuming that the magnetophoretic mobility of a cell is −5.2 × 10⁻⁶ mm3/T-A-s, one can use either Equation 5 or 6 to plot the theoretical, magnetophoretic mobility of immunomagnetically labeled lymphocytes as a function of the number of magnetic nanoparticle conjugates specifically bound to a cell (assuming a value of β of 1). Such a plot is presented in Figures 2A and 2B. Figure 2A is a logarithmic plot of the predicted magnetophoretic mobility as a function of the ABC of the cell for five different field interactions parameters: three from experimental data: MACS, BD Imag, and Dynal particles, and two more lines represent 10 and 100 x the field interaction parameter of the BD Imag particles. The “flattening” of three of the lines above 5,000 ABC for the BD Imag particle represent the estimated saturation of the binding sites on a lymphocyte with 230 nm particles due to steric hindrance (McCloskey et al. 2003; Zhang et al. 2005). Figure 2B is a linear plot of magnetophoretic mobility ranging from −5 × 10⁻⁶ mm3/T-A-s, the reported, mean magnetophoretic mobility of lymphocytes in PBS buffer, to 2 × 10⁻⁵ mm3/T-A-s.
Figure 2.
Theoretical plots (based on experimentally determined constants) of the relationship between a cell’s magnetophoretic mobility and the number of magnetic nanoparticles bound to a cell (assuming a one-to-one correspondence between ABC and bound magnetic particles). Figure 2A is a log-log plot of magnetophoretic mobility as a function of ABC; note that the flat portion of lines corresponds to the steric hindrance limit for bound beads. Figure 2B is a linear plot of mobility as a function of ABC.
Effect of magnetophoretic mobility on magnetic cell separator performance
In a number of previous publications, the importance of the relationship of the magnetophoretic mobility of immunomagnetically labeled cells to the performance of several magnetic cell separation systems was experimentally demonstrated (Comella et al. 2001; Lara et al. 2004; Tong et al. 2007). In general, by making the targeted cells more magnetic, the cell separator performance, with some qualifications, improved. For example, Comella et al. (2001) demonstrated that increasing the average, magnetically targeted cell population magnetophoretic mobility by a factor of 50 resulted in a significant drop, by an average factor of 6, in the percentage of targeted cells in the negative eluent of a binary separation; however, the percentage of positive cells in the positive eluent also slightly decreased, by an average factor of 0.93. Correspondingly, the average, overall recovery of the positive cells (the sum of the targeted cells in both the negative and positive eluent) decreased from 92 percent to 55 percent. The authors attributed this drop in recovery to the most highly magnetically labeled cells become irreversibly trapped in the column.
Lara et al. (2006) observed a similar effect when the final product desired was a cell suspension depleted of the immunomagnetically targeted cells, i.e. a negative depletion separation. Specifically, they reported that by increasing the average magnetophoretic mobility of the cells targeted for depletion (CD3+ cells in this case), the effectiveness of depletion of CD3+ cells increased from no depletion (a control without a label) to a 2.9 log10 depletion of the CD3+ cells. (A log10 depletion is the log10 of the quotient of the initial number of targeted cells to the final number of targeted cells). The average magnetophoretic mobility of the targeted cells to achieve a 2.9 log10 depletion was approximately 8 to 10 times higher than the mobility achieved when following the manufacturers recommended labeling protocol. Interestingly, as with the study by Comella et al. (2001) reported above, the total recovery of the immunomagnetically targeted cells (sum of the CD3+ cells in the negative and positive eluent) significantly decreased from 90% when no immunomagnetic label was used to 51% when the targeted cells had the highest magnetophoretic mobility. Equally disturbing was the observation that the recovery of a non-targeted, spiked cell line (a CD34 expressing cell line) was only 60%, further indicating a non-specific loss of cells in the column.
There are two primary ways to increase the magnetophoretic mobility of immunomagnetically labeled cells: increasing the concentration of the antibody- magnetic label colloid during the cell labeling process, such that a higher number of magnetic nanoparticles are bound to the cell (until the binding sites become saturated, Zhang et al. 2006) or the use of Ab magnetic particle conjugates that have a higher field interaction parameter (McCloskey et al. 2003; Zhang et al. 2005).
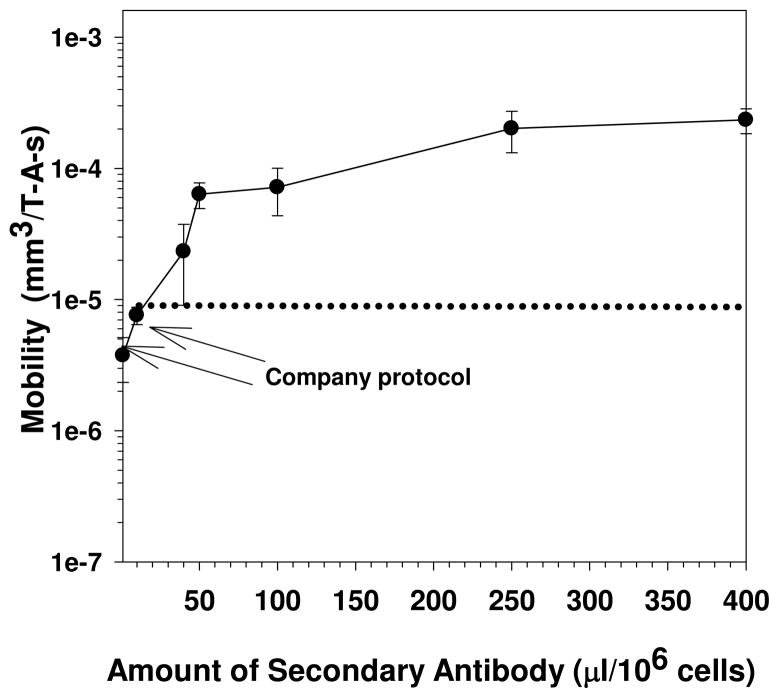
Figure 3 is a plot from Comella et al. (2001) which demonstrates the relationship between the magnetophoretic mobility of human lymphocytes and the labeling concentration of the secondary Ab-magnetic colloid conjugate. The arrow highlights both the labeling concentration, and the subsequent magnetophoretic mobility, that is obtained if one follows the manufactures protocol (Cat # 130-048-801). However, while increasing the concentration of antibody-magnetic particle conjugates increases the magnetophoretic mobility of the targeted cells, it also has the potential to non-specifically bind to non-targeted cells.
Figure 3.
Saturation curve of the magnetophoretic mobility as a function of the concentration of the secondary antibody, magnetic nanoparticle conjugate (adapted from Comella et al. 2001). In this example, the cells were human peripheral blood leukocytes, the primary antibody was an anti-CD56-PE conjugate, and the secondary antibody was an anti-PE-MACS conjugate. The arrows represent the magnetophoretic mobility that corresponds to labeling with the company protocol and the error bars represent one standard deviation.
Focus of this study
Given the increasing demand in the performance of magnetic cell separation systems, such as high purity and recovery of the targeted cells (e.g., as a result of positive selection, such as separation of stem cells), or removal of unwanted cells with a concurrent high level of recovery of non-labeled cells (e.g., as a result of negative depletion, such as a very high level of T-cell depletions for mismatched bone marrow transplants) further fundamental understanding and optimization studies of magnetic cell separation is needed. The previous examples cited above indicate that the magnitude of the immunomagnetic labeling, which can be quantified through magnetophoretic mobility measurements, can have significant effects on the performance of immunomagnetic separation systems. With these assumptions, we asked the following set of questions: 1) Do cells have a minimum, intrinsic magnetophoretic mobility, and what is the distribution of this mobility?, 2) What is the level of non-specific binding of various, commercial magnetic particles?
Materials and methods
Cell sources
In the studies presented in this work, peripheral human blood and cell lines were used. Peripheral blood white cell fractions (“buffy coat”) from healthy donors were purchased from the American Red Cross, Central Ohio Region. Preparation of peripheral blood leukocytes (PBLs) was carried out by diluting buffy coat aliquots with Hank’s balanced salt solution (HBSS, JRH Biosciences) at a ratio of 1:2, and laid over a Ficoll-Hypaque (Mediatech Inc.) density gradient (1.077g/ml). Tubes were spun for 30min at 350×g with the centrifuge brake off. The recovered mononuclear cell layer was washed twice with PBS buffer (JRH Biosciences). Further isolation was subsequently used for some studies to obtain more specific lymphocyte cell types.
A number of different human cancer cell lines, all being, or previously, used in magnetic cell separation studies were used in this current report. Cal 27, Detroit 562, KG-1a, MCF7, and Jurkat cell lines were purchased from ATCC. KG-1a cells were maintained in Iscove’s modified Dulbecco’s medium with 4 mM L-glutamine adjusted to contain 1.5 g/L sodium bicarbonate (ATCC) supplemented with 20% FBS (JRH Biosciences) in an incubator at 37 °C and 5% CO2. MCF7 cells were maintained in minimum essential medium (Eagle) with 2mM L-glutamine and Earle’s BSS adjusted to contain 1.5 g/L sodium bicarbonate, 0.1mM non-essential amino acids, 1 mM sodium pyruvate and 0.01 mg/ml bovine insulin (ATCC) supplemented with 10% FBS (JRH Biosciences) in an incubator at 37 °C and 5% CO2. Jurkat cells were cultured in RPMI 1640 with 2 mM L-glutamine supplemented with 10% FBS in an incubator at 37°C and 5% CO2. Before usage, cell cultures were transferred from 75cm2 T-flasks and washed once with PBS buffer. The concentrations of cells in the PBS suspension, or the Stem Cell magnetic microparticles in suspension were determined by hemacytometer using Unopette® Microcollection system (BD Biosciences).
Preparation of oxyHb and metHb-containing RBC
Blood was collected at the Cleveland Clinic Blood Banking and Transfusion Medicine under an Institutional Review Board-approved protocol for blood collection from normal volunteers for research purposes. The samples were drawn in EDTA Vacutainer tubes (Becton, Dickinson, Rutherford, NJ). A stock suspension was prepared by diluting 0.1ml whole blood with 10ml PBS (without calcium chloride and without magnesium chloride). An oxyHb RBC sample for CTV analysis was prepared by further diluting the stock suspension with PBS to a concentration of 3×10⁵/ml. The preparation of metHb-containing RBC was described in detail by Zborowski et al. (2003). Briefly, the oxidative treatment was performed by mixing the stock solution with 10mM sodium nitrite solution at a ratio of 1:1. Cell mixtures were incubated for about one hour to achieve a 100% methemoglobin condition.
Cell labeling
Four types of magnetic particles (of these four, two are from the same manufacturer, just different sizes) were used in this study: a) unconjugated MACS particles (Miltenyi Biotec Inc.) and MACS beads conjugated to anti-PE antibodies, b) anti-PE DM conjugates (Cat # 557899, BD Bioscience), and the micro and nano scale, dextran coated magnetic particles, EasySep® (Cat # 18150, and 19250, StemCell Technologies Inc). Of the four types of magnetic particles used, only the 1 micron EasySep particle concentration could be determined visually using a heamocytometer. Iron content of the magnetic particles suspensions was determined using a inductively coupled plasma spectroscopy (ICP-OES/MS). Table 2 presents the concentration of 1 micron magnetic particles and the Fe concentrations. The actual labeling process of the cells with the magnetic reagents followed published company protocols except when higher amounts of magnetic particles were used or additional washing steps were conducted. These variations are noted in the results section when the data is presented.
Table 2.
Iron concentration, and in one case, particle concentration, of magnetic reagents as supplied by the manufacturer
| Reagent | Lot number | # particle/ml | Fe gr/L |
|---|---|---|---|
| MACS, anti-PE | 5060823002 | ----- | 0.820 ± 0.03 |
| BD Imag, anti-PE | 26667 | ----- | 0.514 ± 0.012 |
| BD Imag, anti-PE | 02284 | ----- | 0.383 ± 0.007 |
| Stem Cell Technologies Microparticles | 06L20962 | 2.45 × 10¹⁰ | 8.23 ± 0.26 |
| Stem Cell Technologies Nanoparticles | 05E15556 | ------ | 0.331±0.008 |
Cell analysis
Cell magnetophoretic mobility was measured using CTV. As has been discussed in previous publications, the basic CTV algorithm used to determine the cell (or particle) velocity, from which the magnetophoretic mobility is calculated, is based on path “coherence” of a specific cell (or particle) from video frame to video frame. (Chalmers et al. 1999a) The performance, accuracy, and range of this CTV algorithm were determined theoretically, and experimentally verified by Nakamura et al. (2001). With respect to this current study, for a given frame rate dictated by the specific video camera, a maximum magnetophoretic mobility can be measured. While the current permanent magnetic system is optimized for the magnetic nanoparticle, such as MACS reagents, it is to strong for most micron sized, magnetic particles. To address this limitation, two approaches have been taken: an electromagnetic system previously reported (Jin et al. 2008) and a lower power, permanent magnet assembly which has a Sm value of 0.65 TA/mm2, compared to previously reported high power system of 140 TA/mm2 (Chalmers et al. 1999a). While using the same overall dimensions, which allows easily interchangeablity with the high power assembly, this lower power magnet assembly has a nearly constant gradient of B, dB/dx, of 7.78 10−3 T/mm and a value of B of 0.11 T.
For each cell sample that was analyzed with the CTV, 2 mL cell suspension were prepared with a concentration of 0.5×10⁶ cells/ml. Previous reports indicate that at this concentration, cell-cell interactions are not significant (McCloskey et al. 2001). More than 1,000 cell tracks in the CTV channel were recorded for each sample and then analyzed with the CTV software. The final output provides mobility distribution and a size distribution of the sample, by which the cell population was determined.
Results
Intrinsic magnetophoretic mobility
Given the importance of a targeted cell populations magnetophoretic mobility on the performance of magnetic cell separation systems, a fundamental question to ask is: What is the intrinsic magnetophoretic mobility of a number of commonly separated, unlabeled cell types?
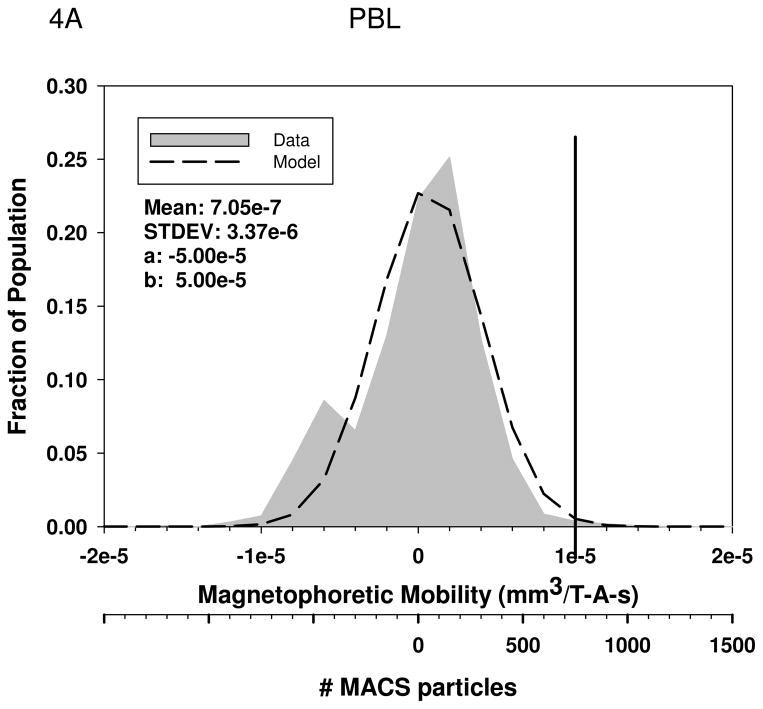
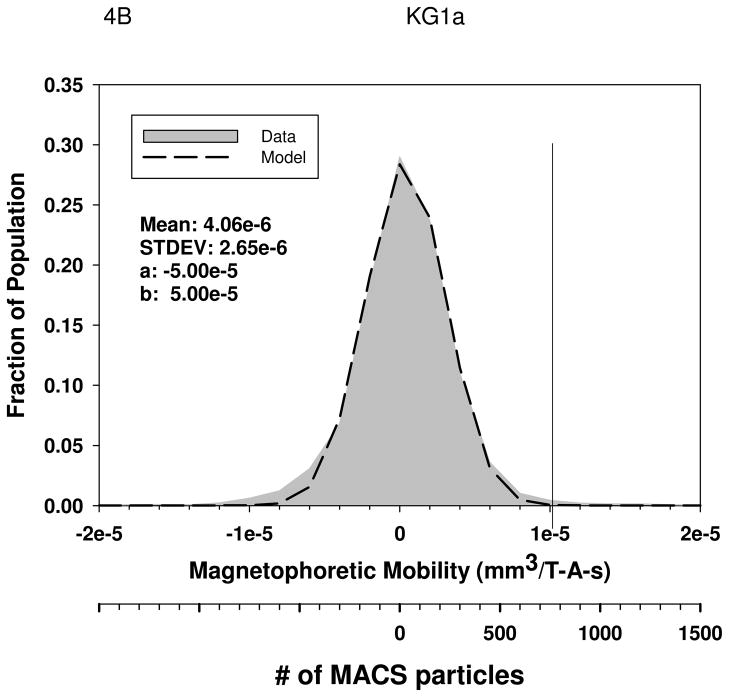
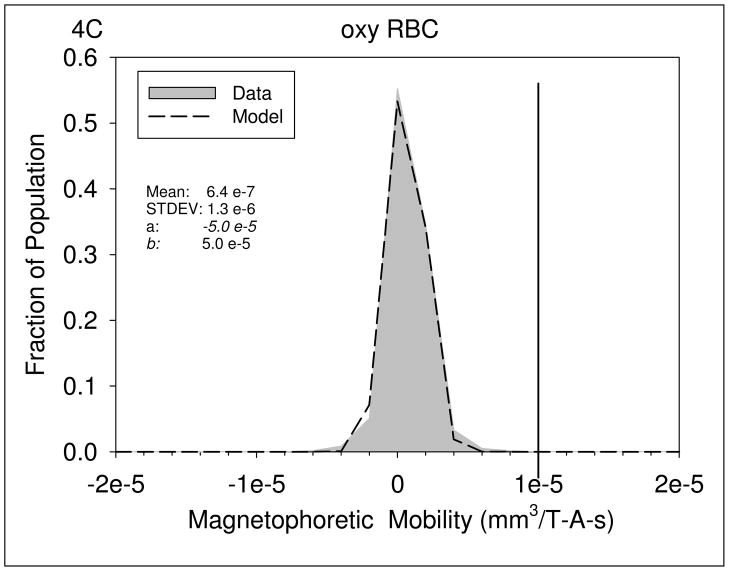
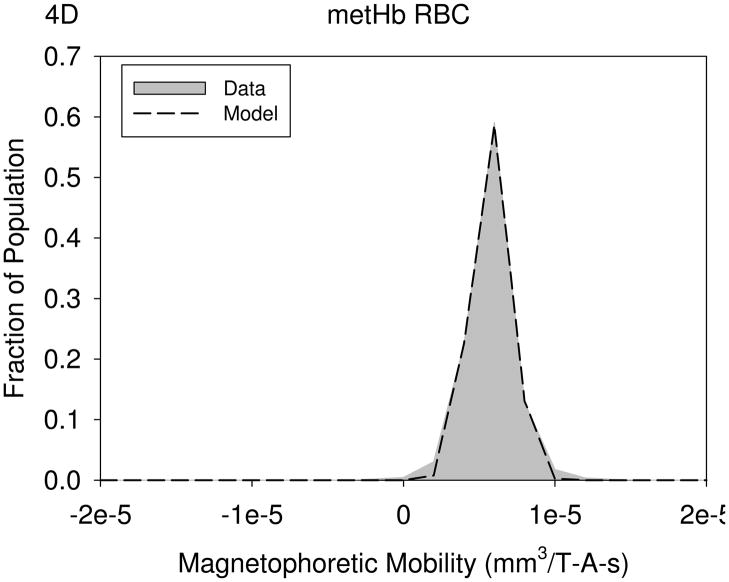
Figures 4A through 4D are histograms of the magnetophoretic mobility of unlabeled PBL, KG1a cells, oxygenated red blood cells, and metHb RBC’s, respectively. Table 3 presents the result of the mean magnetophoretic mobility, standard deviation, and the number of cells tracked per study for PBL, KG1 cells, oxygenated and metHB RBCs, and the cancer cell lines: Detroit 562, Cal 27, and Jurkat. In the case of the PBL, the values presented are from 14 independent CTV studies.
Figure 4.
Magnetophoretic mobilities of unlabeled PBL, (4A), KG1a cells, (4B), oxygenated red blood cells, (4C), and deoxygenated RBC, (4D). The numerical parameter presented in the Figures represents the constants used in the truncated normal distribution model used to fit the data.
Table 3.
Percent of cells with magnetophoretic mobility higher than the cut-off mobility of 1 × 10⁻⁵ mm3/T-A-s
| Cell Type | Mean Mobility (mm3/T-A-s) | Average Standard Deviation (mm3/T-A-s) | Average number of cells tracked | Percent of cells with a mobility greater than 1 × 10⁻⁵ mm3/T-A-s |
|---|---|---|---|---|
| PBL (n = 14) | −1.39 e-6 | 4.12 e-6 | > 1000 per sample | 0.1 |
| KG1 (n=7) | −1.31 e-6 | 4.97e-6 | 1,910 | 0.44 |
| Oxygenated RBC (n=2) | −2.00 e-7 | 1.20e-6 | 1184 | 0 |
| metHb RBC (n=2) | 4.90 e-6 | 1.45 e-6 | 1158 | 0.43 |
| Detroit 562 (n = 6) | −9.3 e-7 | 1.64 e-5 | 1,600 | 0.19 |
| Cal 27 (n=6) | −1.36 e-6 | 1.26 e -6 | 1,770 | 0.021 |
| Jurkat (n=6) | −1.13 e-6 | 5.77 e-6 | 1,440 | 0.98 |
Given the relatively large number of tracked cells which create these CTV histograms, a number of statistical models were used to attempt to fit the data. Since the histograms roughly resemble a normal distribution, presented in a normalized format, a probability density function, in combination with a cumulative density function, was used to model the data. The probability density function of a normal distribution is given by:
| (7) |
and the cumulative density function of normal distribution is given by:
| (8) |
After working with several data sets, and different versions of the normal distribution function, it was observed that the truncated normal distribution provided the best fit. The truncated normal distribution assumes that a pseudo-normal distribution lies within the interval x ∈(a, b), −∞ ≤ a < b ≤ ∞ (Castillo, Joan del 1994). The probability density function of x then becomes:
| (9) |
The dotted lines in Figures 4 superimposed on the histograms are the predicted population fraction using this truncated normal distribution. The four parameters: mean, μ, standard deviation, σc, and the low and high limits, a and b, for each histogram are also included in these Figures.
Using the value of φp for MACS magnetic nanoparticles, 8.8 × 10⁻²⁵ m3 (Table 1), a suspension viscosity of 0.93 × 10⁻³ kg/m3, and a cell diameter of 7 microns for PBL and and 10 microns for KG1a cells, and a zero mobility for cells, Equation 6 can be solved for the number of MACS beads needed to create a specific mobility of the cell. The second x-axis in Figures 4A and 4B corresponds to these numbers of MACS nanobeads bound to the cell to create the specific magnetophoretic mobility.
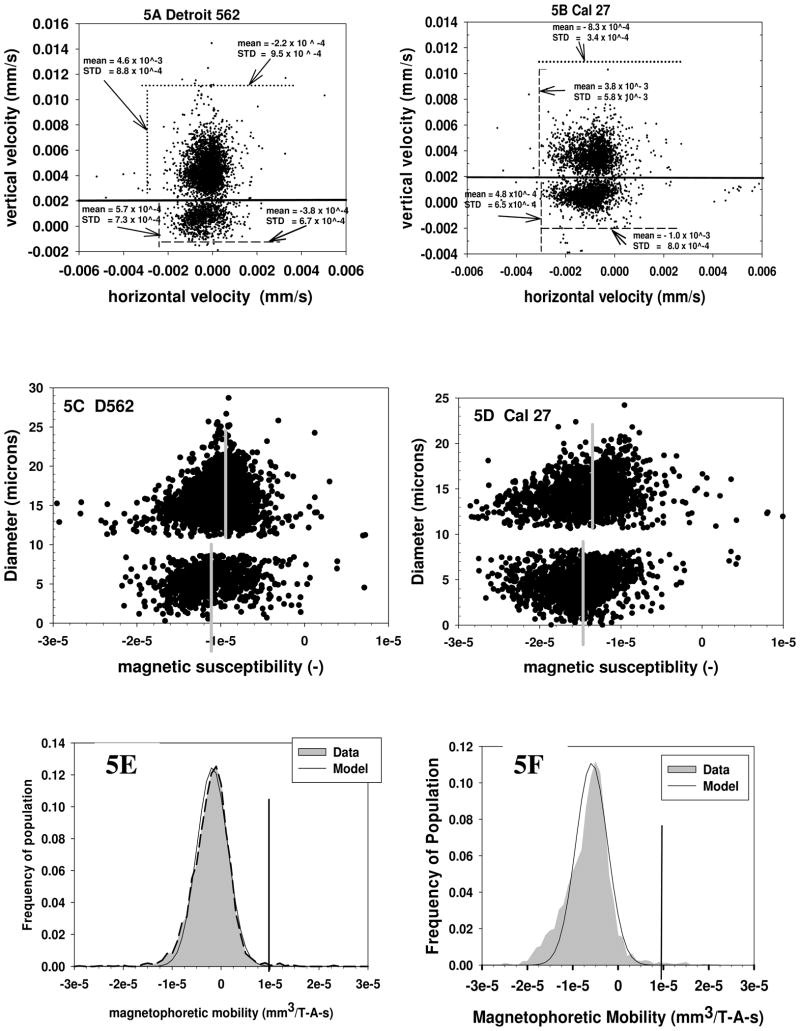
To provide an “internal control” for some of these studies to determine the intrinsic magnetophoretic mobility of cells, two experiments were conducted in which 4.5 micron Spherotech polystyrene microspheres were mixed with two different human cancer cell lines, Detroit 562 or Cal 27. The inclusion of these significantly smaller, polystyrene beads allowed an internal control with respect to any fluid motion which might introduce dispersion into the movement of the cells. Figures 5A and 5B are dot plots of the raw data obtain from the CTV analysis; vertical (settling) velocity along the y-axis, and horizontal (magnetically induced) velocity along the x-axis. The corresponding mean velocity of the clusters representing the cells and the polystyrene microspheres are also reported in Figures 5A and 5B.
Figure 5.
Dot plot of settling velocity, y axis, and magnetically induced velocity, x axis, for Detroit 562, (5A) and Cal 27, (5B), human cancer cell lines. Both cell suspensions were spiked with 4.5 micron polystyrene microspheres and these microspheres are represented by the lower densities of dots in both Figures. Figures 5C and 5D correspond to the calculated diameters (y axis) and magnetic susceptibility. Figures 5E and 5F are the corresponding magnetophoretic mobility histograms for the two cancer cell lines.
As has been reported in a previous publication (Chalmers et al. 1999b; Jin et al. 2008), the settling velocity of the cells and the polystyrene microspheres can be related to the density difference between the cells (or microspheres) and the cell diameter by:
| (10) |
Further, Jin et al. (2008) demonstrated that the magnetically induced velocity, umag, is equal to:
| (11) |
Using Equation 10, the company reported polystyrene bead diameter of 4.5 microns, and a viscosity of 0.93 × 10⁻³ kg/m-s, an average density of difference of these polystyrene beads in the buffer is determined to be 48 kg/m3. We are not aware of any reported density values for Detriot 562 or Cal 27; however, we previous reported that the density difference for one cancer cell line, MCF-7, is 30 kg/m3 (Chalmers et al. 1999b).
Rearranging Equation 10,
| (12) |
and using this average value of the density difference for the polystyrene particles and cancer cells (with respect to the suspending buffer), the settling velocity data can be transformed to a diameter which is plotted in Figures 5C and 5D.
With respect to magnetic susceptibility of the cell, or polystyrene particle, dividing Equations 11 by 10, and rearranging, one obtains:
| (15) |
Alternatively, Equation 11 can be rearranged directly if the diameter of cell or particle is known independently (as in the case of polystyrene particles). Using a value of Sm for the CTV system of 141 TA/mm2 (kg/s2mm2), a magnetic susceptibility of the suspending buffer, χf, of −0.905 × 10⁻⁵, and either Equation 13 or 11, the magnetic susceptibility for each cell or particles can be determined and is also presented in Figures 5C and 5D.
The mean value of the magnetic susceptibility of the polystyrene particles, (vertical gray bars) while slightly different in Figure 5C and 5D, are similar to a literature value of −7.5 × 10⁻⁶. Correspondingly, the cancer cells, Detroit 562 and Cal 27, have a mean magnetic susceptibly very similar to polystyrene beads of 1.01 × 10⁻⁵ and 1.4 × 10⁻⁵, respectively. This general agreement of the magnetic susceptibility of the cells with the internal, polystyrene particles was expected and indicates that most cells that do not have internal high concentrations of iron (such as red blood cells) have magnetic susceptibilities similar to organic polymers, such as polystyrene. This specific internal control also demonstrates that mixing the cells with the beads did not introduce any unusual artifacts. Given this general agreement, no further CTV experiments with internal controls were conducted.
Using the truncated normal distribution model, it is possible to determine the percent of the cell population with a magnetophoretic mobility above a specific value. In this case, visual inspection indicates that a reasonable “gate” to determine the cut-off value above which a cell can be considered to have a magnetic particle attached is 1 × 10⁻⁵ mm3/T-A-s. With this gate, 99 percent of all of the five different cell types (not including RBC) will have a mobility below 1 × 10⁻⁵ mm3/T-A-s (Table 3). This gate is the vertical line in Figures 4A, 4B, 5E and 5F. Interesting, visual inspections and comparisons of all of the histograms of the magnetophoretic mobility of the unlabeled cells reveals that the RBC have the smallest distribution around the mean. This is most probably the result of the high uniform size of RBC.
Non-specific binding of MACS antibody conjugates
As presented earlier, Lara et al (2006) reported that while increasing the labeling concentration of the secondary, antibody magnetic particle conjugate increased the removal of the magnetically targeted cells during a magnetic separation process, it also resulted in a lower yield of the non-targeted cells after a magnetic separation. The implication is that the secondary antibody magnetic particle conjugate non-specifically bound to the non-targeted cells, resulting in the non-targeted cells captured with the targeted cells in magnetic fraction.
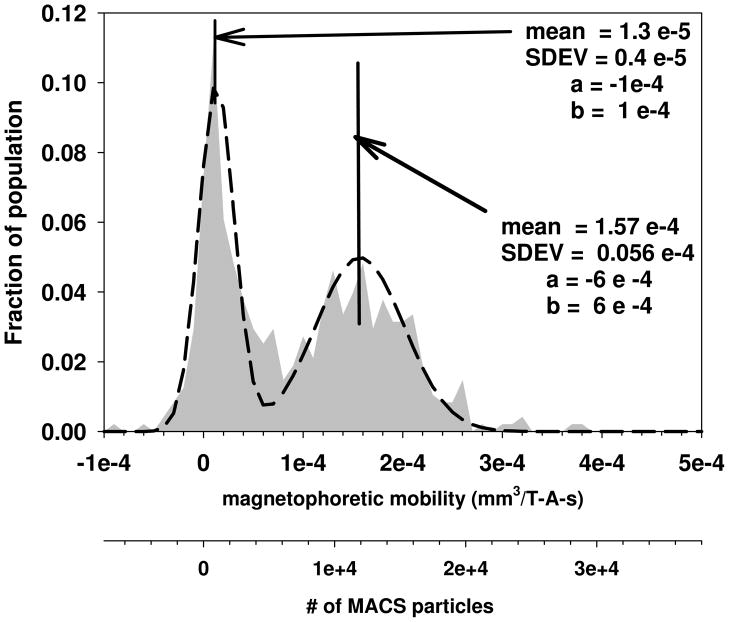
Figure 6 is a plot of the magnetophoretic mobility of PBL labeled with anti-CD3-PE antibody conjugates followed by anti-PE MACS beads conjugates. A concentration of the primary antibody, anti-CD3 PE, was 50 ul per million cells, while for the secondary labeling, anti-PE MACS, 75 ul per million cells was used which is approximately 5 time the company recommended value for the anti-PE-MACS (adapted from Lara et al. 2006). Depending on the specific donor, the percent of the PBL that are positive for CD3 can range from 10% up to 50%; therefore the fraction of the population in this Figure that are positive (peak on the right) is reasonable. However, the negative peak (peak on the left) has a significantly higher magnetophoretic mobility, mean of 1.3 × 10⁻⁵, than unlabeled PBL which have an average mobility of −1.4 × 10⁻⁶ (Table 3). Clearly, non-specific binding of the magnetic particles is occurring, resulting in a significant, positive shift in the non-targeted cells.
Figure 6.
Magnetophoretic mobility of human PBL labeled with anti-CD3-PE and anti-PE MACS particles. The labeling concentration was 40 ul for the anti-CD3-PE and 5 times the company recommended value for the anti-PE-MACS. (adapted from Lara et al. 2006)
Non-specific binding of basic MACS magnetic nanoparticles (no antibody) as a function of cell type and labeling concentrations
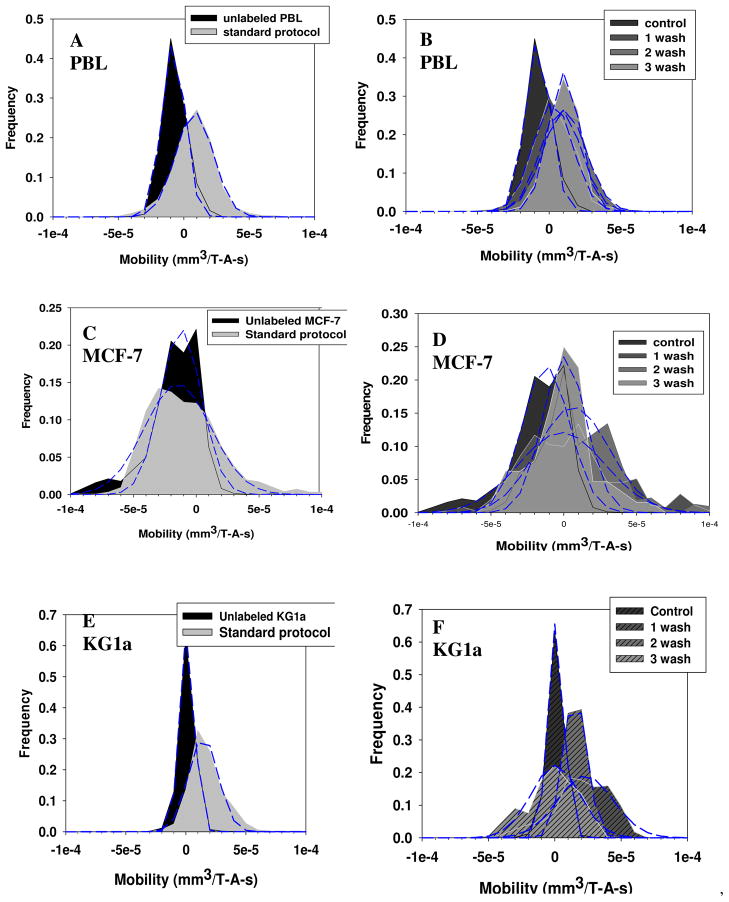
To test whether this non-specific binding effect is the result of the magnetic nanoparticles themselves, or the Ab conjugated to the magnetic nanoparticles, a series of experiments were conducted on unlabeled cells with only MACS nanoparticles to which no antibodies had been conjugated. This series of experiments were conducted with PBL cells from buffy coats, and two human cancer cell lines, MCF-7 and KG1a. These three cell types have been routinely used in our laboratory for a variety of cell separation studies. The cells were labeled following the typical company protocol suggested by Miltenyi Biotec Inc, (15 minute incubation on ice with one washing step) except for varying amounts of nanoparticle concentrations and washing steps.
The results of these studies are presented in Figures 7A through 7F. For 7A, 7C, and 7E, a control and cells incubated with the standard labeling protocol was used. For 7B, 7D, and 7E, the cells were labeled with 10x the standard labeling protocol, and the magnetophoretic mobility of the cells were subsequently measured after each of three washing steps. As with the previous histograms, a truncated normal distribution was used to attempt to fit the data. The mean, standard deviation, and values of a and b are presented in Table 4. In addition, the number of MACS particles required to give the cells the mean magnetophoretic mobility, relative to the control, is also presented in Table 4.
Figure 7.
Magnetophoretic mobility histograms of human peripheral blood leukocytes, (A, B), MCF-7 human breast cancer cells, (C, D), and KG1a human cell line, (E, F). For panels A, C, and E, the cells were incubated with unconjugated MACS magnetic nanoparticle following a standard company protocol (10 μl of MACS reagent in a total suspension of 100 μl containing 1 × 10⁷ cells) and in panels B, D, and F, a high concentration of unconjugated MACS reagent (100 μl of MACS reagent in a total suspension of 100 μl containing 1 × 10⁶ cells) was used. To determine if the nonspecifically bound MACS reagents could be washed off, the mobility after one, two and three washings was determined.
Table 4.
Magnetophoretic mobility distribution parameters and the equivalent number of non-functional MACS beads (no antibody attached) needed to give the cells the measured mobility
| Sample | Mean | STDEV | a | b | # of MACS particles | |
|---|---|---|---|---|---|---|
| PBL | Control | −7.87E-06 | 8.75E-06 | −1E-04 | 1E-04 | - |
| Standard | 8.22E-06 | 1.42E-05 | −1E-04 | 1.5E-04 | 734 | |
| 1 wash | 2.72E-06 | 1.38E-05 | −1E-04 | 1E-04 | 314 | |
| 2 wash | 1.09E-05 | 1.49E-05 | −1E-04 | 1E-04 | 870 | |
| 3 wash | 1.05E-05 | 1.09E-05 | −1E-04 | 1E-04 | 870 | |
| MCF-7 | Control | −1.21E-05 | 1.62E-05 | −2E-04 | 2E-04 | - |
| Standard | −1.47E-05 | 2.64E-05 | −5E-04 | 5E-04 | - | |
| 1 wash | −1.40E-06 | 2.95E-05 | −5E-04 | 5E-04 | - | |
| 2 wash | 6.52E-05 | 2.47E-05 | −5E-04 | 5E-04 | 5,890 | |
| 3 wash | 3.8E-07 | 1.49E-05 | −5E-04 | 5E-04 | 953 | |
| KG1a | Control | −6.4 E-07 | 6.00E-06 | −2E-04 | 2E-04 | - |
| Standard | 1.45E-05 | 1.23E-05 | −2E-04 | 2E-04 | 1,160 | |
| 1 wash | 2.31E-05 | 2.10E-05 | −2E-04 | 2E-04 | 1,810 | |
| 2 wash | 1.52E-05 | 8.83E-06 | −2E-04 | 2E-04 | 1,210 | |
| 3 wash | 4.63E-07 | 1.84E-05 | −2E-04 | 2E-04 | 84 | |
Inspection of both Figures 7A–7F, as well as the calculations presented in Table 4, indicate that a significant number of MACS particles non-specifically bind to cells. In addition to a shift to a higher magnetophoretic mobility, potentially of more importance is the shift, in general, to a much wider distribution in mobility; i.e. there are a significant number of cells that have a magnetophoretic mobility much higher than the mean in a non-normal distribution. This is most clearly observed in the mobility histograms of the MCF-7 cells, Figure 7C and 7D. This non-“truncated normal distribution” diminishes the value of the mean and standard deviation numbers presented in Table 4. Specifically, inspection of Figures 7C and 7D indicates that with each washing step, a reduction in the number of cells with high magnetophoretic mobility is observed (reduction in the right hand side “tails”); yet the mean mobility reported in the Table 4 does not change significantly.
Non-specific binding of the BD DM nanoparticles anti-PE conjugates
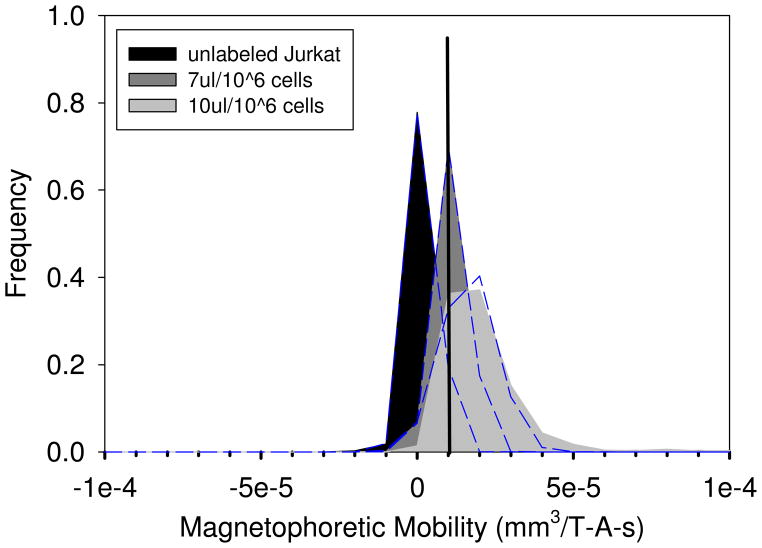
The non-specific binding effect of BD Imag DM nanoparticles that are conjugated to anti-PE antibodies was tested on Jurkat cells. The cells were labeled following the typical company protocol suggested by BD Biosciences. Two nanoparticle concentrations were tested: 7μl/106 cells and 10μl/106 cells. The magnetophoretic mobilities of the cells were then measured after two washing steps. The results are presented in Figure 8. Using the value of φp for BD Imag magnetic nanoparticles, 91 × 10−25 m3 (Table 1), cell diameter, 12.5 μm (from coulter counter), and Equation 6, the number of BD particles required to give the cells the mean magnetophoretic mobility, relative to the control, is calculated and presented in Table 5.
Figure 8.
Magnetophoretic mobility histograms of Jurkat cells (a human T cell lymphoblast-like cell line). Cells were incubated with BD™ Imag DM magnetic nanoparticles at two concentrations, 7μL beads/106 cells, 10μL beads/106 cells. The mobility was determined after two washings.
Table 5.
Magnetophoretic mobility distribution parameters and the equivalent number of BD Imag beads conjugated to anti-PE antibodies needed to give the cells the measured mobility
| Sample | Mean | STDEV | A | b | # of BD Imag particles |
|---|---|---|---|---|---|
| Control | −2.27E-06 | 4.42E-06 | −1E-04 | 5E-04 | - |
| 7μl/106 | 1.13E-05 | 5.17E-06 | −1E-04 | 5E-04 | 109 |
| 10μl/106 | 1.65E-05 | 8.56E-06 | −1E-04 | 5E-04 | 171 |
Characterization of Stem Cell Technologies dextran magnetic particles
As outlined in Figure 1, in addition to direct conjugation of magnetic particles to antibodies, Stem Cell technologies provides a product, TAC, in which a bifunctional antibody is used to bind to the cell surface marker of interest as well as the dextran magnetic nanoparticles of nominal diameters of either 200 nanometers or 1 micron. While the 200 nanometer magnetic particles can not be directly analyzed in the CTV system (to small to be visually tracked), the 1 micron particle can be evaluated. Using the lower power magnet assembly, an average magnetically induced velocity, um, of 0.01761 mm/s (S.D. of 0.0076 mm/s) was obtained. From Jin et al. (2008), for FexOy, this velocity is mathematically defined by:
| (11) |
Rearranging Equation 11, one can solve for the average magnetization of a single particle, Ms(H):
| (12) |
If we make the following assumptions for the constants: a magnetically induced velocity of 0.01761 mm/s, Dt of 1 × 10⁻⁶ m, Ns (the number of magnetic particles) of 1, η is equal to 0.93 × 10⁻³ kg/m-s, and a magnetic gradient of 7.78 × 10⁻³ T/mm (7.78 T/m) the magnetization of the 1 micron particle is 3.78 × 10⁴ A/m (Note: 1 T = 1 N/A-m). Using this calculated value of magnetization, a value of B0 of 0.11T, and Equation 3, the value of φp for these 1 micron magnetic particles is 2.26 × 10⁻¹⁹ m3. Assuming the Stem Cell Technologies nanoparticles have a mean diameter of 200 nanometers, and that the composition is equivalent to the 1 micron particles, the value of φp for the 200 nm Stem Cell particles is 1.81 × 10⁻²¹ m3.
Nonspecific binding of Stem Cell Technologies particles to Jurkat cells
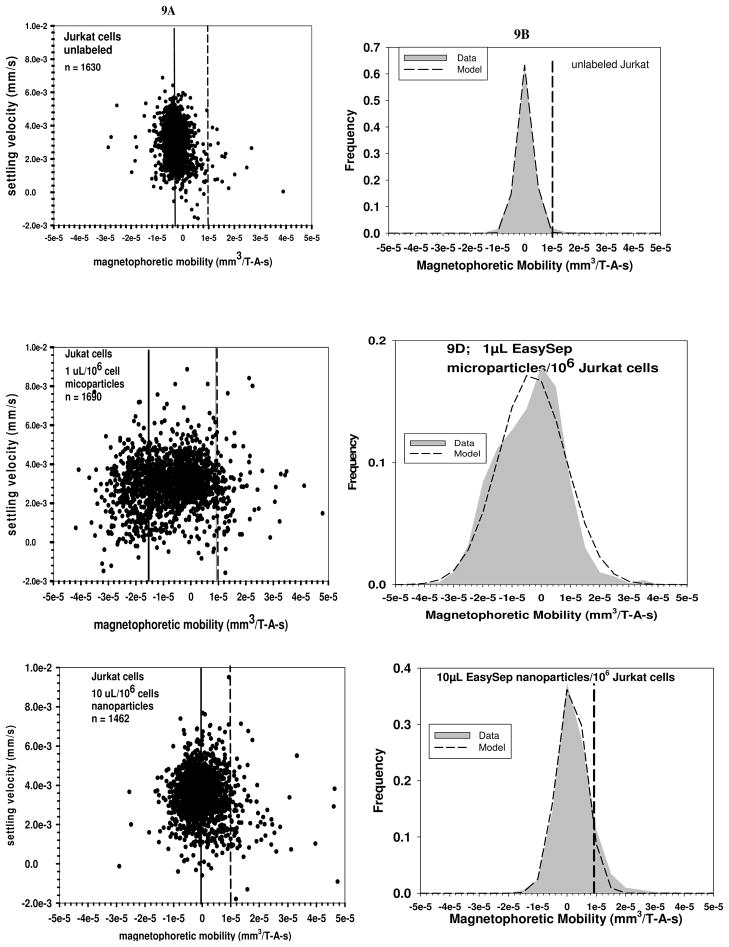
Figures 9A, 9C, and 9E are representative dot plots of settling velocity versus magnetophoretic mobility for unlabeled Jurkat cells, 9A, Jurkat cell incubated with 1 microliter per 106 cells of Stem Cell Technologies microparticles, 9C, and Jurkat cells incubated with 10 microliter per 106 cells of Stem Cell Technologies nanoparticles, 9E. Figure 9B, 9D, and 9F are the corresponding histograms of the magnetophoretic mobility, with a mobility of 1 × 10⁻⁵ mm3/T-A-s represented by the doted vertical line. Table 6 provides further data on the experiments represented in Figures 9A-9F, and the number of Stem cell particles required to give the cells the mean magnetophoretic mobility, relative to the control.
Figure 9.
Figures 9A through 9F are representative dot plots of settling velocity versus magnetophoretic mobility for unlabeled Jurkat cells, 9A and 9B, Jurkat cell incubated with 1 microLiter per 106 cells of Stem Cell Technologies microparticles, 9C and 9D, and Jurkat cells incubated with 10 microLiter per 106 cells of Stem Cell Technologies nanoparticles, 9E and 9F. The vertical solid line is the mean mobility of the cells, and the dotted line corresponds to a mobility of 1 × 10⁻⁵ mm3/T-A-s.
Table 6.
Magnetophoretic mobility distribution parameters and the equivalent number of non-functional Stem Cell Technologies micro and nano particles needed to give Jurkat cells the measured mobility
| Sample | Mean | STDEV | % population > 1 × 10⁻⁵ | Number of Stem Cell technology particles | |
|---|---|---|---|---|---|
| Control | −2.25 e -6 | 4.03 e -6 | 0.98 | ------ | |
| Mico-particles | 0.2 ul/106 cells | −6.77e-6 | 1.55e-5 | 2.59 | ------ |
| 0.4 ul/106 cells | −5.68e-6 | 2.49e-5 | 6.37 | ------ | |
| 1 ul/106 cells | −5.04e-6 | 1.93e-5 | 6.33 | ------ | |
| Nano-particles | 10 ul/106 cells | 1.39e-6 | 2.86e-5 | 6.22 | 140 |
| 25 ul/106 cells | 3.82e-6 | 2.44e-5 | 12.25 | 230 | |
Discussion
Clearly, the data presented above address the questions posed previously. First, PBL. the cell lines, and the oxygenated RBC studied in this work all have a slightly negative, intrinsic magnetization (relative to suspending buffer), and the distribution is such that a threshold value of magnetophoretic mobility (1×10⁻⁵ mm3/T-A-s) can be set above which, it can be assumed that magnetic particles are bound to the cell (either due to specific, or non-specific, interactions). The one exception is metHb, which is reported to have equivalent magnetic properties to deoxygenated RBC’s (Zborowski et al. 2003).
Second, significant, non-specific binding of nanoscale through microscale magnetic particles can be quantified with the CTV instrument. While these results are not unexpected, what is unique to this study is our attempt to quantify the degree to which the non-specific binding occurs. The highest level of induced magnetophoretic mobility (non-specific binding of magnetic particles to cells) occurred with MACS particles, while the lowest was observed with the Stem Cell Technology particles. This can be visually observed comparing the histograms in Figures 6, 7, 8, and 9, and the estimated number of non-specifically bound beads, reported in Tables 4, 5 and 6.
At this stage, we do not know if these magnetic particles are just non-specifically bound to the cell surface, or whether they have been internalized. In a previous publication, we did demonstrate that it is possible to demonstrate with Cell Tracking Velocimetry that the uptake of seven different superparamagnetic iron oxide (SPIO) transfect ion agents can be quantified (Jing et al. 2008); however, those particle are designed for internalization, and specific incubation procedures were used. Recently, Hillaireau and Couvreur (2009) recently wrote a review article attempting to summarize various attributes that contributed to cellular uptake of nanoparticles with a focus on drug delivery. As can be imaged, nanoparticle uptake is a function of type of cell, particle size, particle coating, and extracellular environment. While beyond the focus of this current study, future work will involve attempt to determine if the magnetic particles shown in this study to be non-specifically associated with cells are attached to the cell surface or are internalized.
While there is clearly an increased magnetophoretic mobility due to non-specific binding, one could ask the following questions: Are these calculated numbers of nonspecifically bound nanobeads realistic given the fact that the calculation is based on the field interaction parameter, φp, determined using the same CTV instrument? Is not this just a circular argument?
To address this question, theoretical equations, and independently (relative to the CTV system) measured experimental data allow estimates to be made to determine if the value of the field interaction parameter, φ, for the 1 micron Stem Cell Technologies particles is reasonable.
Independent verification, with respect to CTV, of the value of φp, for the Stem Cell Technology 1 micron particles
The stock solution provided by Stem Cell Technologies of the 1 micron, dextran magnetite particles has a Fe concentration of 8.2 ×10⁻⁶ g Fe/1 × 10−6 Liters (8.2 g Fe/L) as measured using an ICP instrument. Visual counting of the 1 micron particles in this same stock solution using a hemocytometer indicates that the concentration of 1 micron EasySep particles was 2.45 × 10¹⁰ beads/ml. Therefore, an estimate of the amount of Fe per 1 micron bead is:
If we make the further assumption that the iron is in the form of magnetite, and the reported density of magnetite (Fe3O4) is 5.1 × 10⁶ g/m3, the volume of magnetite present in a 1 micron, dextran magnetite particle is:
The ratio of the volume of magnetite to the total volume of the sphere is then:
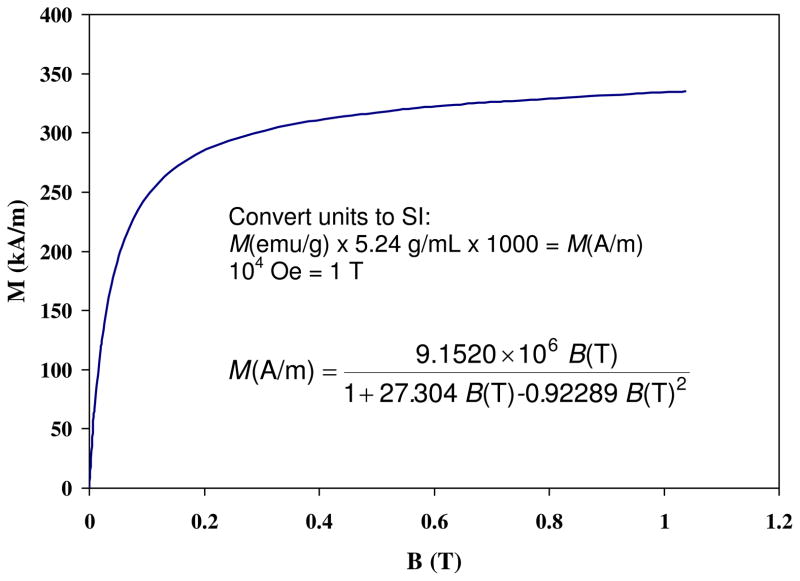
The magnetization of Fe3O4 at 0.11T can be estimated from Figure 9 to be 2.29 × 10⁵ A/m. Assume the major component of the 1 micron bead, dextran, has a zero magnetization, the average magnetization of the whole particle is then
Using Equation 3, the value of the field interaction parameter for the micron beads is 2.37 × 10⁻¹⁹ m3. The difference in field interaction parameter obtained from this theoretically calculated value, and one measured using the CTV instrument and reported above, 2.26 × 10⁻¹⁹ m3, is approximately 5%. This surprisingly close result suggest that the values of φ from CTV measurements are accurate, and correspondingly the estimates of the number of non-specifically bound magnetic particles to cells is reasonable.
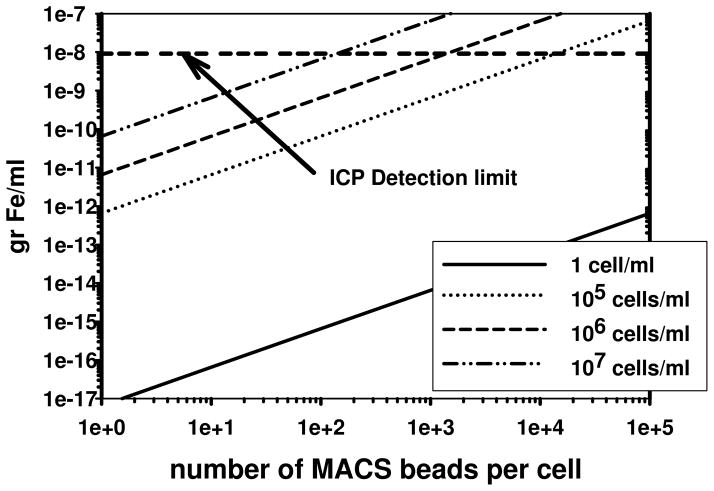
To provide a measure of comparison, the sensitivity of a commonly used, sensitive, commercial elemental analysis instrument, Inductively Coupled Plasma Mass Spectrometer (ICP-MS), has a typical sensitivity limit for Fe of 10−8 g/ml. This concentration corresponds to the dotted horizontal line in Figure 10. As can be observed, given the assumptions made in this analysis, it would take, on average, at least 1,000 MACS beads attached to a cell, and a cell concentration of 106 cells/ml for the ICP-MS to be able to detect the Fe in those beads attached to the cells (assuming no other Fe is present in the cells or buffer). Given that the CTV instrument tracks the movement of individual cells, 700 MACS beads on a single cell corresponds to approximately 4.6 × 10⁻¹⁵ g/ml of Fe. This indicates that the CTV instrument is approximately 7 orders of magnitude more sensitive with respect to the detection of iron in or attached to a single cell.
Figure 10.
Experimentally measured relationship between magnetization (kA/m) as a function of magnetic field intensity (B) for magnetite particles at 300K. (Adapted from Yamaura et al. 2004).
Conclusion
In addition to demonstrating, quantitatively, non-specific binding of magnetic nanoparticles to cells, and the negative effect such binding has on magnetic cell separation, this work also shows the sensitivity of magnetic separation and analysis technology. The fact that as low as a few hundred (perhaps even less) magnetic nanoparticles, either specifically, or non-specifically bound to a cell can be detected on a cell-by-cell basis is surprising given the sensitivity of other analysis technology such as commercial ICP-MS instrument.
On-going studies in our laboratory are focused on screening and developing magnetic reagents which have less non-specific binding to improve the performance of magnetic cell separation systems as well as further pursuing the question of the sensitivity of the CTV system.
Figure 11.
The predicted concentration of Fe, (g/ml) as function of the number of MACS beads per cell for cell concentrations of 1, 105, 106, and 107 cells/ml. The dashed horizontal line corresponds to the sensitivity of the commercial ICP-MS elemental detection technology.
Acknowledgments
Grant support: National Science Foundation (BES-0124897 to J.J.C.) the National Cancer Institute (R01 CA62349 to M.Z., R01 CA97391-01A1 to J.J.C.) and the State of Ohio Third Frontier Program (ODOD 26140000: TECH 07-001
References
- Joan del Castillo. The singly truncated normal distribution: A non-steep exponential family. Annals of the Institute of Statistical Mathematics. 1994;46(1):57–66. [Google Scholar]
- Chalmers JJ, Zhao Y, Nakamura M, Zborowski M. An instrument to determine the magnetophoretic mobility of labeled, biological cells and paramagnetic particles. Journal of Magnetism and Magnetic Materials. 1999a;194:231–241. [Google Scholar]
- Chalmers JJ, Haam S, Zhou Y, McCloskey KE, Moore L, Zborowski M, Williams PS. Quantification of Cellular Properties from External Fields and Resulting Induced Velocity: Cellular Hydrodynamic Diameter. Biotechnology and Bioengineering. 1999b;64:509–518. doi: 10.1002/(sici)1097-0290(19990905)64:5<509::aid-bit1>3.0.co;2-z. [DOI] [PubMed] [Google Scholar]
- Comella K, Melnik K, Chosy J, Zborowski M, Cooper MA, Fehniger TA, Caligiuri MA, Chalmers JJ. The effect of antibody concentration on the separation of human natural killer cells in a commercial immuno-magnetic separation system. Cytometry. 2001;45:285–293. doi: 10.1002/1097-0320(20011201)45:4<285::aid-cyto10018>3.0.co;2-w. [DOI] [PubMed] [Google Scholar]
- Garderet L, Snell V, Przepiorka D, Schenk T, Lu JG, Marini F, Gluckman E, Andreeff M, Champlin RE. Effective depletion of alloreactive lymphocytes from peripheral blood mononuclear cell preparations. Transplantation. 1999;67:124–130. doi: 10.1097/00007890-199901150-00021. [DOI] [PubMed] [Google Scholar]
- Hillaireau H, Couvreur P. Nanocarriers entry into the cell: relevance to drug delivery. Cell Mol Life Sci. 2009;66:2873–2896. doi: 10.1007/s00018-009-0053-z. [DOI] [PMC free article] [PubMed] [Google Scholar]
- Jin X, Zhao Y, Richardson A, Moore L, Williams S, Zborowski M, Chalmers JJ. Differences in magnetically induced motion of diamagnetic, paramagnetic, and superparamagnetic microparticles detected by cell tracking velocimetry. The Analyst. 2008;133:1767–1775. doi: 10.1039/b802113a. [DOI] [PMC free article] [PubMed] [Google Scholar]
- Jing Y, Mal N, Williams PS, Penn Mayorga Maritza, Marc Chalmers JJ. Quantitative Intracellular Magnetic Nanoparticle Uptake Measured by Live Cell Magnetophoresis. FASEB Journal. 2008;22:4239–4247. doi: 10.1096/fj.07-105544. [DOI] [PMC free article] [PubMed] [Google Scholar]
- Koh MB, Prentice HG, Lowdell MW. Selective removal of alloreactive cells from haematopoietic stem cell grafts: graft engineering for GVHD prophylaxis. Bone Marrow Transplantation. 1999;23:1071–1079. doi: 10.1038/sj.bmt.1701749. [DOI] [PubMed] [Google Scholar]
- Lara O, Tong X, Zborowski M, Chalmers JJ. Enrichment of Rare Cancer Cells through Depletion of Normal Cells Using Density and Flow-Through, Immunomagnetic Cell Separation. Experimental Hematology. 2004;32(10):891–904. doi: 10.1016/j.exphem.2004.07.007. [DOI] [PubMed] [Google Scholar]
- Lara O, Tong X, Zborowski M, Farag S, Chalmers JJ. Comparison of two Immmunomagnetic Separation Methodologies to Deplete T-cells from human blood samples. Biotechnology and Bioengineering. 2006;94 (1):66–80. doi: 10.1002/bit.20807. [DOI] [PubMed] [Google Scholar]
- McCloskey K, Chalmers JJ, Zborowski M. 2003. Magnetic Cell Separation: Characterization of Magnetophoretic Mobility. Analytical Chemistry. 2003;75(4):6868–6874. doi: 10.1021/ac034315j. [DOI] [PubMed] [Google Scholar]
- McCloskey K, Comella K, Margel S, Chalmers J, Zborowski M. Mobility measurements of immunomagnetically labeled cells allow quantitation of secondary antibody binding amplification. Biotechnology and Bioengineering. 2001;75:642–655. doi: 10.1002/bit.10040. [DOI] [PubMed] [Google Scholar]
- Melnik K, Sun J, Fleischman A, Roy S, Zborowski M, Chalmers JJ. Quantification of the Magnetic Susceptibility in several strains of Bacillus spores: implications for detection and separation. Biotechnology and Bioengineering. 2007;98:186–192. doi: 10.1002/bit.21400. [DOI] [PubMed] [Google Scholar]
- Moore LR, Sun LP, Zborowski M, Nakamura M, Chalmers JJ, McCloskey K, Gura S, Burdygin I, Margel S. The use of Magnetite-Doped Polymeric Microspheres in Calibrating Cell Tracking Velocimetry. J Biochemical and Biophysical Methods. 2000;44:115–130. doi: 10.1016/s0165-022x(00)00085-3. [DOI] [PubMed] [Google Scholar]
- Nakamura N, Lasky L, Zborowski M, Chalmers JJ. Theoretical and Experimental Analysis of the Accuracy of Cell Tracking Velocimetry. Experiments in Fluids. 2001;30:371–380. [Google Scholar]
- Paladichuk A. Isolating RNA: pure and simple. The Scientist. 1999;13(16):20. [Google Scholar]
- Tong X, Yang L, Lang J, Zborowski M, Chalmers JJ. Application of immunomagnetic cell enrichment in combination with RT-PCR for the detection of rare circulating head and neck tumor cells in human peripheral blood. Cytometry B Clin Cytom. 2007;72(5):310–323. doi: 10.1002/cyto.b.20177. [DOI] [PubMed] [Google Scholar]
- Zborowski M, Ostera GR, Moore LR, Milliron S, Chalmers JJ, Schechter AN. Red Blood Cell Magnetophoresis. Biophysics Journal. 2003;84:2638–2645. doi: 10.1016/S0006-3495(03)75069-3. [DOI] [PMC free article] [PubMed] [Google Scholar]
- Zhang H, Moore LR, Zborowski M, Chalmers JJ. Establishment and implications of a characterization method for magnetic nanoparticle using cell tracking velocimetry and magnetic susceptibility modified solutions. The Analyst. 2005;130:514–527. doi: 10.1039/b412723d. [DOI] [PubMed] [Google Scholar]
- Zhang H, Williams PS, Zborowski M, Chalmers JJ. Binding affinities/avidities of antibody-antigen interactions: quantification and scale-up implications. Biotechnology and Bioengineering. 2006;95:812–829. doi: 10.1002/bit.21024. [DOI] [PubMed] [Google Scholar]
- Yamaura M, Camilo RL, Sampaio LC, Macedo MA, Nakamura M, Toma HE. Preparation of and characterization of (3-aminopropyl) triethoxysilane-coated magnetite nanoparticles. Journal of Magnetism and Magnetic Materials. 2004;279:210–217. [Google Scholar]


