

Abstract
In recent years, the use and number of biotherapeutics has increased significantly. For these largely protein-based therapies, the quantitation of aggregates is of particular concern given their potential effect on efficacy and immunogenicity. This need has renewed interest in size-exclusion chromatography (SEC). In the following review we will outline the history and background of SEC for the analysis of proteins. We will also discuss the instrumentation for these analyses, including the use of different types of detectors. Method development for protein analysis by SEC will also be outlined, including the effect of mobile phase and column parameters (column length, pore size). We will also review some of the applications of this mode of separation that are of particular importance to protein biopharmaceutical development and highlight some considerations in their implementation.
Keywords: biomolecule, chromatography, monoclonal antibody, protein, size-exclusion chromatography (SEC)
INTRODUCTION
Given the complexity of protein and peptide-based parenteral therapies, a broad set of complementary techniques are reqired to monitor the critical quality attributes of intermediate drug substances and drug products.[1,2] As outlined in regulatory agency guidelines, one of these attributes is a quantitative assessment of the aggregation, including dimers and multimers, of the active protein. While numerous techniques have been developed to monitor protein aggregation, size-exclusion chromatography (SEC) has been predominantly favored for routine and validated analyses because of both its speed and reproducibility.[3–6] SEC is also an accurate method if confirmed with an orthogonal method, such as sedimentation velocity analytical ultracentrifguation (SV-AUC).[7–9] The intent of this review is to provide a summary of SEC, including background, theory, and applications with a primary focus on the analysis of peptide and protein aggregates.
Since the early introduction of biologic-based therapeutics, the presence of protein aggregates has been theorized to compromise safety and efficacy.[10] These concerns, which date to the 1980s, have led to routine analysis and quantitation of dimers, trimers, and higher order aggregates for a wide variety of biologic-based therapies, such as insulin,[3–6] recombinant human growth hormone (rGH),[11,12] and monoclonal antibodies.[8,13,14] Aggregate analyses are typically performed throughout the entire product lifecycle of biotherapies.[8] However, each stage of development may have different assay requirements including robustness, sensitivity, ease of use, and high throughput. These desired attributes have led to a wide variety of techniques for the analytical characterization of biotherapies based on the size of the biomolecules.[8] Commonly used techniques include SV-AUC,[15,16] asymmetric flow field flow fractionation (AF4),[16–18] multi-angle light scattering (MALS),[12,19,20] and SEC. While all of these techniques are frequently used, the dominant method continues to be SEC.[9]
HISTORY
The concept of size-based separations by chromatography was first speculated by Synge and Tiselius,[21] based on the observation that small molecules could be excluded from the small pores of zeolites as a function of their molecular size.[22] The term “molecular sieve,” coined by J. W. McBain[23] to describe this property of zeolites, was subsequently used to describe the technique commonly known today as size-exclusion chromatography. Over the years, SEC has been known by a number of other names, such as exclusion chromatography,[24] steric-exclusion chromatography, restricted-diffusion chromatography,[25] liquid-exclusion chromatography,[26] gel-filtration chromatography, and gel-permeation chromatography. The first examples of size-based separations by liquid chromatography were noted by Wheaton and Bauman[27] in their work on ion-exclusion chromatography. They observed that various nonionic species could be separated on ion-exchangers by a size-based mechanism. Similarly, R. T. Clark[28] demonstrated the separation of sugar alcohols on a strong cation exchange resin.
Lindqvist and Storgårds[29] reported the first separation of biomolecules by a size-exclusion process, where they separated peptides from amino acids on a column packed with starch. Subsequently, Lathe and Ruthven[30,31] performed extensive characterizations on columns packed with potato or maize starch, which demonstrate very low adsorption of proteins. Using a column packed with maize starch, they were able to separate a variety of compounds including proteins and peptides by the “molecular sieve” effect (see Figure 1).
Figure 1.
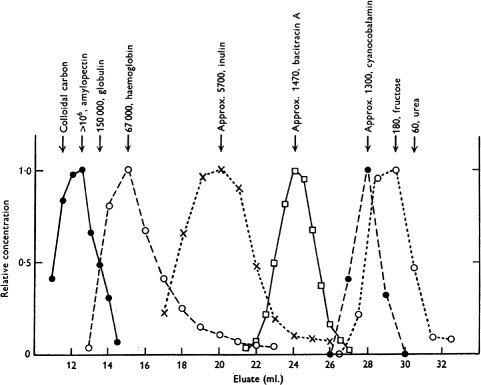
Separation of amylopectin, hemoglobin, inulin, bacitracin A, cyanocobalamin, and fructose on a column containing heat-swollen maize starch. Mobile phase: 25 mM borate, 25 mM potassium chloride, pH 8.5. Column bed dimensions: 16 mm diameter × ∼16 cm. Flow rate: ∼3mL/hr. Reproduced from Reference[31] with permission from Portland Press Ltd.
However, the low mechanical strength of starch limited the speed of separations as it could not withstand high linear velocities before bed collapse. In addition, as a natural product, starch was relatively poorly defined. Shortly thereafter, dextrans crosslinked with epichlorohydrin were developed. These materials proved to be equally proficient at minimally interacting with proteins and additionally provided greater mechanical strength than starch.[32–35] Pharmacia commercialized these materials under the tradename Sephadex, and they became the standard media for size-based separation of proteins for many years. Sephadex was initially prepared as irregular particles and later synthesized as porous spheres.[36] By varying the degree of crosslinking, the inclusion or exclusion of the analytes from the pore network could be altered. The Sephadex gels were weakly acidic, showing some adsorption of basic analytes, with a binding capacity of about 10 μ-equivalent per g of dry gel.[37] By addition of salt to the eluent, ionic interactions could be minimized.
Other polymeric resins, such as agar and agarose,[38–40] polyacrylamide,[41–43] polyvinylethylcarbitol,[42] and polyvinylpyrrolidone[42] gels were also used for size based separations. Polyacrylamide-based gels were commercialized by Bio-Rad under the trade name Bio-Gel.
Early on, it was realized that SEC materials follow the same chromatographic theory as adsorption chromatography. In one of the early papers describing Sephadex, Flodin[34] demonstrated the beneficial effect of reduced particle size on chromatographic performance. There has been a drive to further reduce particle size in order to achieve faster speed and greater chromatographic resolution. However, the soft polymeric resins compress under pressure and flow, which limits the extent that the particle size can be reduced for chromatographic applications.
In the 1970s, derivatized porous silica became the predominant chromatographic stationary phase media due to its superior mechanical strength, non-swelling nature and inertness over a fairly wide range of conditions. The utility of porous silica for SEC was explored, as the greater mechanical strength provided a means to further improve performance by reducing particle size. As a size-exclusion medium for proteins, it suffered from strong ionic interactions due to the acidic surface silanols. To mitigate these interactions, both surface modifications and mobile phase additives were employed. Surface modifiers include glyceropropylsilane[44] and N-acetylaminopropylsilane.[45] However, these functional groups are non-ideal as they exhibit significant hydrophobic interactions with proteins. The most commonly used surface modifier today is a diol[46,47] functional group, which has minimal hydrophobic interactions. However, even with high coverage, a significant concentration of surface silanols still remains.[48] To further diminish interactions with these residual silanols, high ionic strength mobile phases are typically required.
More recently, porous hybrid organic/inorganic particles[49] have been employed as the base particle for size-exclusion chromatography. The bridged ethyl hybrid (BEH) particles, surface modified with diol groups, provide a significant reduction in silanol activity, thus requiring lesser amounts of salt additives to minimize the ionic interactions with proteins.[50] In addition, the high mechanical strength of BEH particles enables a reduction in particle size to 1.7 μm, providing gains in chromatographic efficiency.
While most SEC columns are packed with porous particles, a couple of other types of sorbent configurations should be noted. Most packed beds of porous particles have an interstitial porosity of about 35–41%. In SEC, this interstitial porosity adds time to the analysis without benefitting the separation. Czok and Guiochon[51] utilized bundles of aligned porous fibers for size-exclusion chromatography. They were able to reduce the interstitial porosity to 15–18%, resulting in a significant increase in the intraparticle pore volume. However, the increased pore volume did not translate into improved resolution, as they could not prepare columns with good chromatographic efficiency, presumably because the aligned fibers restricted radial dispersion in the column. Li et al.[52] prepared poly(ethylene glycol methyl ether acrylate-co-polyethylene glycol diacrylate) monoliths for biopolymer separations. These monoliths showed low protein binding in aqueous buffers, and chromatographic efficiency comparable to a packed bed of ca. 8 μm particles. The monolithic columns showed separation of peptides and proteins across a broad MW range of up to 670,000 Da, with most of the resolving power available for MW less than 66,000 Da.
THEORY
Thermodynamics
The free energy change of a chromatographic process can be described by,[53,54]
where ΔG0, ΔH0, and ΔS0 are the standard free energy, enthalpy, and entropy differences, respectivly; R is the gas constant: T is absolute temperature, and k is the partition coefficient. For most chromatographic modes of separation, the enthalpy of adsorption is the dominant contributor to the overall change in free energy. SEC is unique in that partitioning is driven entirely by entropic processes as there ideally is no adsorption, ΔH = 0. Thus the previous equation becomes:
where KD is the thermodynamic retention factor in SEC. Thus, in SEC separations, temperature should have no impact on retention. In practice, temperature can indirectly impact retention to a small degree by altering the conformation of the proteins, as well as by affecting mobile phase viscosity and analyte diffusivity. Figure 2[50] shows an overlay of protein separations run at three different temperatures, demonstrating the minimal effects that temperature can have on retention.
Figure 2.
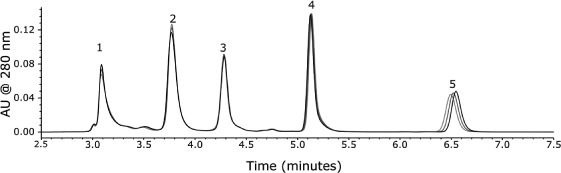
Separation of (1) thyroglobulin, (2) IgG, (3) BSA, (4) Myoglobin, and (5) Uracil on a Waters ACQUITY UPLC BEH200 SEC, 1.7μ, 4.6 × 150 mm. Mobile phase: 100mM sodium phosphate, pH 6.8. Flow rate: 0.3mL/min. Temperature: 30°C (black), 40°C (blue), 50°C (red). Reproduced with permission from Waters Corporation, Milford, MA. (Color figure available online.)
The thermodynamic SEC retention factor is the fraction of intraparticle pore volume that is accessible to the analyte:
where VR, V0, and Vi are the respective retention volumes of the analyte of interest, the interstitial volume, and the intra-particle volume. KD will range from a value of 0 where the analyte is fully excluded from the pores of the stationary phase, to a value of 1 where the analyte fully accesses the intraparticle pores. By rearranging Eq. (3), one obtains:
Ideally the separation of proteins and other compounds by SEC is based on the size (or more specifically the Stokes radii) of the analytes in solution. The size based separation, in principle, allows a calibration curve, derived from a set of known analytes, to be used to estimate the molecular weight of an unknown analyte.[54–58] Typical calibration curves are based on proteins or polymers of known molecular weight. By plotting log M vs. the retention volume, one typically obtains a third order polynomial, with a linear region which provides the highest resolution and molecular weight accuracy. For example, Figure 3 shows a typical calibration curve for various protein analytes. The linear range of the curve shows the molecular weight range that the column is suited for. In this example, the linear range is approximately 10kDa∼500kDa. By normalizing the x-axis to the volume of the column when empty, one can readily determine the interstitial volume fraction, intraparticle volume fraction, and stationary phase volume fraction. In this instance, the respective values are about 38%, 46%, and 16%, respectively.
Figure 3.
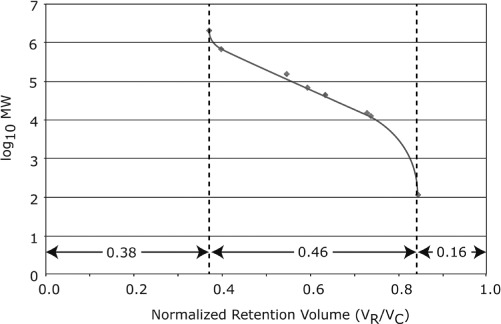
Typical SEC calibration curve. (Color figure available online.)
As has been widely demonstrated and discussed by Yau and Kirkland among others, [57,59,60] the molecular weight range and slope of the calibration curve are highly dependent on the pore size of the packing matrix. Specifically, the pore size and/or geometry restricts access of molecules based on their Stokes radius. The largest proteins, which are excluded from the pores, elute first. Subsequent proteins elute in order of decreasing size.
As proteins vary in shape (e.g., globular, rod-like or flexible chains), their Stokes radii do not correlate exactly with molecular weight. The difficulty in obtaining accurate molecular weight information for proteins based on calibration curves has been well-studied.[58,61,62] Another source of error in the calibration curve is that nonideal adsorption may alter the retention volume.[63–65] However, some studies have successfully demonstrated the effectiveness of using a universal calibrant for proteins, primarily for protein collection. Guo et al.[55] described the use of pullan standards as a universal calibrant for molecular weight determination of heparin. However, mobile phase conditions affected the elution volume of the heparin, thereby affecting molecular weight accuracy. These studies required screening of the mobile phase to ensure minimal nonideal interactions which if not controlled could affect molecular weight determination.
The slope of the line in the linear portion of the calibration curve is a measure of the selectivity of the stationary phase, which can be defined by the relationship:
where m and b are the respective slope and intercept of the line. As the pore size distribution of the particle narrows, the slope becomes shallower, which results in a greater selectivity to discriminate between analytes that are similar in size. Since KD is bound between 0 and 1, this greater selectivity comes with a tradeoff in that it has less ability to separate analytes over a broad dynamic range. The point at which KD = 0.5 is a measure of the particle's mean pore size. Ghrist et al.[66] define the term k” as the mass of solute inside the particle divided by that outside the particle (which is similar, but not identical, to the retention factor k in adsorption chromatography):
Substituting this into Eq. (5), one can see that the selectivity can be enhanced by decreasing V0 or increasing Vi. These parameters can be altered by packing a column more densely, or by using particles with greater pore volume. However, the physical constraints to both of these approaches limit the extent to which selectivity can be altered in practice. The interstitial volume fraction of a randomly packed bed of particles cannot be easily reduced much beyond 35%, notwithstanding novel approaches such as using aligned fibers as noted earlier. Increasing particle pore volume comes at the expense of the skeletal volume, and so the maximum pore volume achievable depends on the mechanical stresses that the particle needs to be able to withstand.
Kinetics
If one uses the Van Deemter Equation to describe plate height H as a function of linear velocity u, diffusion coefficient Dm, and particle size dp, one obtains the following relationship:
Note that in the case of proteins, the “b” term is typically negligible compared to the other two terms due to the low diffusivity of the macromolecules.
Diffusion coefficients can be estimated for globular proteins using the following relationship: [67]
where T is the absolute temperature in Kelvin, η is the mobile phase viscosity in Poise, and M is the molecular weight of the protein. Note that in the case of SEC, the molecular weight and resulting diffusion coefficients can vary considerably between analytes. In addition, with increasing size, analytes become excluded from the pores of the particles, and the intraparticle diffusion decreases, resulting in low c-terms for the highest MW analytes.[68]
As seen in Eq. (7), the plate height is a function of the particle size, with the last term dependent on d2p/Dm Thus it would be expected that if particle size could be reduced, it would provide significant impact on chromatographic efficiency, particularly at high linear velocities. Figure 4 shows a plot of plate height at different linear velocities for two proteins, Ribonuclease A, and a monoclonal antibody (Ab), on columns packed with two different size particles, 1.7 μm and 2.6 μm. The results are generally in agreement with the theory. One sees that plate height increases linearly with flow rate. Also, the smaller particles provide improved efficiency, and the improvement is especially apparent at the high linear velocities.
Figure 4.
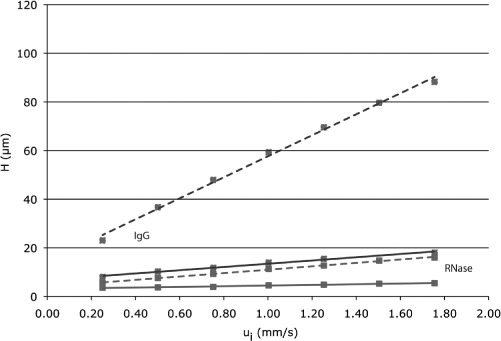
Effect of linear velocity on plate height for (a) ribonuclease A (red) and (b) a monoclonal antibody (blue) on two columns varying in particle size. The 4.6 × 150 mm columns were packed with either 1.7 micron (solid line) or 2.6 micron particles (dashed line). Pore size of stationary phase sorbent: 200 A. Mobile phase consisted of 100 mM sodium phosphate, pH 6.8. Reproduced with permission from Waters Corporation, Milford, MA. (Color figure available online.)
Resolution
In chromatography, resolution between two analytes is typically defined as:
where the subscripts 1 and 2 denote the respective analyte, and ρ is the mean standard deviation of the respective peak widths. The slope m in the linear region of the calibration curve as defined in Eqs (3) and (5) is:
Using Eq. (7) and the relationship:
the Resolution equation can be rewritten as:
 |
This equation shows the dependance resolution has on the pore volume, column length, and linear velocity.
INSTRUMENTATION CONSIDERATIONS
From the first analyses by Lathe and Ruthevin.[30,31] SEC separations of proteins have been performed under native conditions which preserve the biological activity of the macromolecule. Biocompatible chromatographic systems are most often used to minimize any metal-protein adducts or undesired protein interactions. Native conditions most often require physiological pH, high salt content, and 100% aqueous mobile phases, all of which can be problematic. The presence of high salt concentrations increases the potential of particulates in the mobile phases, thereby affecting system and column performance. Highly aqueous mobile phase can cause bacterial contamination within hours, particularly in the absence of bacteriocides or bacteriostats (e.g., sodium azide).[69]
In adsorption chromatography, separation typically occurs in a volume that is significantly greater than the volume of the chromatographic column. But in SEC, separation takes place in less than one column volume. As a peak migrates through a chromatographic column, its peak width increases, and the amount at which it increases depends on the retention factor or retention volume. Thus, in the case of SEC, where an analyte has a retention factor of zero, the amount that the peak broadens can be significantly less than other modes of chromatography. As a result, the impact of band broadening in SEC is of particular importance and has been the subject of a wide number of articles.[54,66,70–72]
Since the early introduction of SEC, instrumentation such as high performance liquid chromatography (HPLC) and fast protein liquid chromatography (FPLC)[73,74] systems have sufficient pressure thresholds to accomodate silica-based SEC columns. However, these systems can have significant system dispersion because of the design and configuration. For example, Ghrist et al.[66] found in “non well-behaved” systems SE-HPLC instrumentation can lead to increased band broadening (up to a 50% increase) as compared to expected values. Even in well-behaved systems, SE-HPLC can lead to significant band broadening. To minimize the impact that the instrument has on dispersion, large diameter SEC columns with inner diameters of greater than 7.5 mm are typically used.
As a result, HP-SEC instrumentation is typically optimized for these separations.[54,75–77] This is accomplished by the utilizing tubing with low inner diameters (0.005” or less) and minimizing the length of tubing. It is important that the chromatographic system contain no additional tubing and that any valves used in the chromatographic system have low volume connections. A number of studies, including Grznárová et al. have examined the effects of varying connector tubing lengths and diameters, injector tubing lengths and varying flow rates for macromolecules.[78] These studies reinforce previous work by Kirkland et al. that demonstrated the negative impact of extra system volume from injectors, guard columns, detectors and connectors on chromatographic resolution and accuracy.[79]
For the combination of SEC and light scattering detectors, which require the use of both a multi-angle light scattering detector as well as a concentration detector, extra column band broadening is of particular concern. A number of studies have looked at the effect of multiple detectors on the band broadening.[20,80] These studies have outlined varying influence of band broadening effects with multiple detectors. Some studies have found band broadening effects with dual detectors can have a significant impact on samples with higher polydispersities, affecting molar mass calculations. However, for non polydisperse samples, the volume shift for multiple detectors in SEC is minimal: molar mass averages are comparable and within 1% of actual values for most proteins, whether or not volume shift correction is applied.[81]
In 2004, the commercialization of reversed-phase LC columns with sub 2 micron particles provided the chromatographer with significantly improved resolving power, provided that the column was used on a low dispersion LC instrument.[82] It has only been recently that SEC columns with sub 2 μm particles have been developed which take advantage of the improved low dispersion instrumentation.[82] These instruments can provide lower system dispersion and improved resolution for SEC protein separations as compared to SEC-HPLC.
DETECTORS
For SEC analyses, UV continues to be the predominant mode of detection.[76,83] Near UV or longer wavelengths give greater response for aromatic amino acids, such as tryptophan, and are commonly used for protein measurement.[84] Higher sensitivity provided by detection using far UV or low wavelengths (214 or 220 nm), where the amide peptide bond has a strong absorbance. Both wavelength ranges can be quantitatively inaccurate due to either scattering from particles at lower wavelengths or the presence of other chromophores absorbing at 280 nm. However, each wavelength range has its advantages: at lower wavelength, improved sensitivity allows for analysis of sample limited or low concentration proteins, while higher wavelengths provide a greater linear dynamic range.
The advantages of the two wavelength ranges can be combined by using dual wavelength detection, which has been proposed for purity profiling in SEC.[20,85] In this approach, the lower wavelength provides the sensitivity for the low abundant species, while the higher wavelength provides a higher linear range for the major species (i.e., the monomer). The wavelength ratio is experimentally determined for the major species. This factor is then used to calculate the percentage of aggregates and other impurities detected at the low wavelength which provides greater sensitivity. This type of approach, which has been demonstrated for monoclonal antibodies by Bond, can allow for lower levels of aggregates to be measured against a monomer et al.[20]
Some assays have also used fluorescence detectors for improved sensitivity and or selectivity.[17,86–88] Diress et al.[86] demonstrated the utility of fluorescence detection for improved sensitivity in cases where excipients may elute near or with the protein of interest. Gunturi et al.[87] also showed the sensitivity of fluorescence detection for recombinant human growth hormone, also in the presence of excipients. These studies confirm the applicability of fluorescence detectors to measure low level of aggregates.
Requirements for molecular weight confirmation have led to coupling of SEC with detectors that provide information on molecular weight. These include multi-light scattering (ALS) detectors which can determine the size and shape of proteins. The coupling of SEC and light scattering detectors has enabled better determination and/or confirmation of molecular weights.[12,19,89–91] SEC-MALS can provide information on the size, shape and concentration of the sample. Due to the dependence of MALS on concentration and the extinction coefficient of the protein, SEC-MALS must also be coupled to a separate detector for concentration determination. The most common detectors used for concentration determination in conjunction with MALS are refractive index (RI) and ultra-violet (UV) detection. Oliva et al.[12] compared the precision and accuracy of both SEC-MALS/UV-Vis and SEC-MALS/RI. The results of these methods were found to have a high degree of correlation, with the expected precision and accuracy for most proteins. SEC-MALS/UV-Vis was found to have slightly greater coefficients of variation (CV); however the values were within expected experimental error. Folta-Stogniew and Williams[19] evaluated the precision and accuracy of SEC-MALS for a range of proteins from 12–480 kDa. While the median standard deviation was 2.3%, larger variation could be attributed to sample characteristics, such as dimer destabilization.[19] Since the response in MALS is proportional to the molecular weight of the protein, accuracy for lower molecular weight species can be influenced by sample load.
SEC-MALS has been shown to provide information not only proteins and their dimers but also high order aggregates. Ahrer evaluated aggregates for human IgG. This study showed that for those samples containing trace amounts of higher order aggregates, SEC-UV may not provide enough sensitivity. The same sample in MALS detector is significantly more sensitive to the high MW aggregates and enables their confirmation and analysis.[90]
Mass spectrometry is another method for obtaining molecular weight information. However, there are challenges to interfacing SEC with MS. As discussed extensively by García,[92] the greatest challenge is the incompatibility of mobile phases containing high concentrations of nonvolatile salts.[92] SEC mobile phases are typically nondenaturing aqueous solutions in the physiological pH range (6.5–8). These mobile phases lead to ion suppression and contamination of the mass spectrometer. The most suitable SEC-MS mobile phases provide non-denaturing conditions (ammonium formate and ammonium acetate) but not physiological conditions.[93]
In order to overcome this difficulty, SEC-MS methods have been developed using denaturing mobile phases containing organic solvents and ion-pairing reagents.[94–97] Lazar et al.[95] applied a similar principal for the analysis of immunoconjugates. In this case, covalently linked immunoconjugates were distinguished from the intact monoclonal antibody under SEC-MS conditions, providing utility that could not be achieved by either offline sample preparation or reversed phase desalting. Liu et al.[94] developed a similar approach for the analysis of reduced and alkylated monoclonal antibodies with acetonitrile and TFA in the mobile phase, thus allowing for rapid desalting (Figures 5b and 5c).[94,97]
Figure 5.
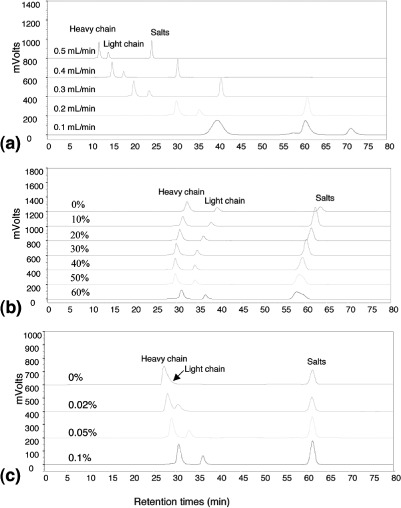
SEC chromatograms of antibody-A analyzed using TSKgel G3000SWxl column; (a) at various flow-rates of 0.5 mL/min, 0.4 mL/min, 0.3 mL/min, 0.2 mL/min, and 0.1 mL/min as labeled in the figure; (b) using mobile phase consisting of 0%, 10%, 20%, 30%, 40%, 50%, or 60% acetonitrile as labeled in the figure with 0.1% TFA, and 0.1% formic acid in Milli-Q water; (c) using mobile phase consisting of 20% acetonitrile with 0.1% formic acid and with 0%, 0.02%, 0.05%, or 0.1% TFA in Milli-Q water as labeled in the figure. Reprinted from Reference[93] with permission from Elsevier. (Color figure available online.)
METHOD OF OPTIMIZATION
Proteins are prone to interact with surface charged sites of chromatographic stationary phases.[9,63–65,98–100] These ionic interactions can result in adsorption of the protein,[74] shifts in retention time,[5] peak tailing or peak asymmetry,[6] or to changes in the three dimensional conformation of the protein.[63,101] As previously mentioned, chromatographic stationary phases and mobile phases have been used to mitigate nonideal interactions.
Other factors can be used to manipulate SEC separations. Chromatographic conditions that can be evaluated include flow rate, column length, mass load, and volume load. Adjustment of these factors can impact resolution, analysis time, and/or sensitivity.[102]
Nonbinding interactions between the solute and the packing material are dominated by two types of chemical interactions: electrostatic interactions and hydrophobic interactions.[64] If the protein and the stationary phase surface are identically charged, “ion-exclusion” can result. In this case, the protein is prevented from entering into the pores of the particle, and thus elute faster than would be predicted. If the protein and the particle are oppositely charged, then adsorption of protein to the stationary phase surface may result from ion-exchange interactions, and results in greater than expected retention. Hydrophobic effects can be produced from interaction of the solute with hydrophobic sites on the packing material and lead to increased retention.
Salt Concentration
A common approach to reducing electrostatic interactions in SEC involves increasing the ionic strength or salt concentration of the mobile phase.[63–65] This can reduce secondary interactions and improve peak symmetry, retention time, and quantitation. This approach has been recently demonstrated by Ricker and Sendoval[100] in which a number of monoclonal antibodies were analyzed at varying ionic strengths. While the results varied among the antibodies, some antibodies showed retention time shift and poor peak shape at low sodium chloride concentrations. Kamberi et al.[103] also examined the effects of electrostatic interactions on the recovery of aggregates of synthetic human parathyroid hormone. In this study, aggregate recovery was evaluated at different sodium chloride and acetonitrile concentrations. The addition of 100 mM sodium chloride was found to minimize electrostatic interactions and increase aggregate recovery.
Increasing the concentration of a counter ion in the mobile phase is a common approach to reducing electrostatic interactions. However, very high concentrations of these same ions can lead to an increase in hydrophobic or ion exclusion effects.[61] This interaction has been well-documented, particularly for peptides, and strongly hydrophobic proteins.[99,104]
Mobile Phase Modifiers
Numerous studies have evaluated the addition of of organic modifiers or other additives, such as arginine[11,105] to mitigate these secondary interactions. These additives are often used to aid in protein recovery. The reduced recovery of aggregates in SEC chromatography is an area of wide concern.[14,105] One strategy often used is the addition of arginine to the mobile phase to reduce secondary interactions.[11,101] Arginine acts as a binder to the analyte in solution, thus preventing it from interacting with the stationary phase. Arakawa analyzed the effect of arginine on protein aggregate quantitation and found an increase in aggregate recovery when arginine was added to the mobile phase.[101] Other studies have also found improvement in peak shape with the use of arginine as a mobile phase additive.[11] Methods using arginine in the mobile phase have been developed for both large biomolecules and small proteins, such as insulin.[4–6]
Mobile Phase pH
Mobile phase pH can also be manipulated to reduce secondary interactions.[63,65] Varying pH of the mobile phase can perturb the three dimensional conformation of the protein, resulting in changes in non-ideal interactions with the stationary phase. These interactions can be predicted based on the relationship between mobile phase pH and the isoelectric point of the protein. Golovchenko et al. demonstrated that at low ionic strengths, ion exchange effects were observed at pH values below the pI of the protein, while ion-exclusion effects were observed at pH values above the isoelectric point of the protein. [65]
Flow Rate
Flow rate is one of the parameters available optimizing resolution.[2,100,106] As in many chromatographic separations of macromolecules, the optimum column efficiency is achieved at low linear velocities. The impact of flow on resolution can be seen from the discussions in the Theory section, and in particular Eq. (12). Engelhardt and Schön[106] demonstrated conditions for optimizing size-exclusion chromatography, including reduced flow rate. A study by Qian et al.[85] analyzed flow rates over a 10 × (0.112–1.2 mL/min) range for the analysis of human serum albumin and interferon. Ricker and Sandoval[100] demonstrated the effect of flow rate on the SEC separation of a protein mixture: resolution improvement was observed for bovine serum albumin and ovalbumin with decreasing flow rate. Liu et al.[94] evaluated the effect of flow rate for the SEC separation of a reduced antibody under denaturing conditions (Figure 5a). For all of the examples, the improvements in resolution are accompanied by longer analysis times, broader peaks and lower sensitivity.
Sample Load
As in other chromatographic techniques, sample load, both volume and mass, affects SEC chromatographic resolution and sensitivity.[82,106,107] Ideally, proteins are separated based on size, limiting the resolution between analytes. In instances of column overloading, resolution between the analytes can deteriorate. Ideal volume loads correspond to sample volumes between 5–10% of the total column volume. If the sample volume increases beyond this range, resolution decreases. Oftentimes these higher volumes cause peak distortion (i.e., tailing). Ricker and Sandoval[100] demonstrated this phenomenon for a set of protein standards: injection volumes were tested over a 100-fold range (2–200 μL). Large injection volumes (>100 μL) led to increased peak widths, resulting in decreased resolution between the bovine serum albumin monomer and ovalbumin (Figure 6).[100]
Figure 6.
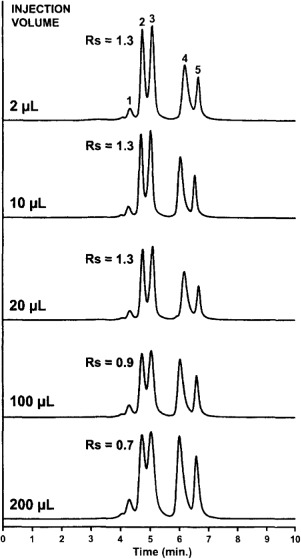
Effect of injection volume on separation efficiency in SEC. A 4-component protein mixture was separated on a Zorbax GF- 250 column (250 × 9.4 mm) using a mobile phase of 200 mM sodium phosphate, pH 7.0. The injection volume was varied from 2 to 200 μL] and ambient temperature was used. Detection, represented on the y-axis, was carried out at 230 nm. The flow rate was 2 ml/min. Resolution (Rs) between BSA and ovalbumin are shown. Peak Identities: 1 = BSA-dimer; 2 = BSA; 3 = ovalbumin; 4 = lysozyme and 5 = sodium azide. Reprinted from Reference[100] with permission from Elsevier.
Loss of recovery of monoclonal antibodies and their aggregates is a concern in SEC chromatography. Thus, for method development, the correlation between mass load and recovery is often analyzed. Gabrielson et al.[14] evaluated this phenomenon for unstressed and acidified monoclonal antibody formulation. In this study, loss of protein mass was observed for the acidified monomer at higher mass injection loads, while the unstressed sample showed no significant loss of protein mass. This loss can be attributed to non-ideal interactions and illustrates the utility of analyzing varying mass loads in method development.
Column Dimensions
A common approach to method development in any chromatographic method also includes the effect of varying column length and inner diameter. Increasing column length provides a means of improving resolution in isocratic separations such as SEC.[100,108] From Eq. (12), one can see that resolution is proportional to L½. While most SEC columns are 30 cm in length to provide optimum resolution, additional column length can be attained by linking multiple columns in series. Ricker and Sandoval[100] demonstrated this effect by linking two 4.6 × 250 mm columns for the analysis of BSA and ovalbumin. In this example improved resolution and higher column efficiencies were achieved, however, these were accompanied by increased time of analysis. Coupling of columns and/or increasing column length results in an increase in run time proportional to the additional column length.
As discussed earlier, increasing the inner diameter of SEC columns can significantly improve peak capacity and resolution by minimizing the system contribution to band broadening.[66,75,106] In cases where system dispersion is significant, 7.5 mm I.D. SEC columns may be required in order to maximize peak capacity.[109] However, with the introduction of newer low dispersion, instrumentation such as UHPLC, smaller ID columns (4.6 mm) can be used to achieve comparable resolution to SE-HPLC.
Particle Size
As discussed earlier, and shown in Eq. (12), efficiency in SEC is affected by the particle size of the chromatographic stationary phase. Evaluation of these smaller particles has shown the advantages in resolution as compared to larger particles.[106,110–112] Liu et al.[94] demonstrated these effects for the analysis of a reduced antibody: improved resolution and higher efficiencies were observed for the light and heavy chain using columns with smaller particle sizes (Table 1).[94]
TABLE 1.
Comparison of Columns: Effect of Particle Size on Efficiency and Resolution for a Reduced Antibody
| Theoretical Plates |
||||||
|---|---|---|---|---|---|---|
| [-17pt] Columns | Dimensions (m i.d. × mm length) | Particle size (μm) | Pore sizes (Å) | HC | LC | Resolution |
| TSKgel G3000SW | 7.5 × 300 | 10 | 250 | 1980 | 3845 | 3 |
| TSKgel G3000SWxl | 7.8 × 300 | 5 | 250 | 5060 | 10674 | 4 |
| Shodex KW-804 | 8.0 × 300 | 7 | 250 | 4952 | 8859 | 2 |
| Protein-Pak 300SW | 7.5 × 300 | 10 | 250 | 2078 | 4271 | 3 |
| BioSuite 250 | 7.8 × 300 | 5 | 250 | 5149 | 9403 | 3 |
Conditions: 20% acetonitrile, 0.1% TFA, 0.1% formic acid at 0.2 mL/min. Reprinted from Reference[94] with permission from Elsevier.
Theoretical analysis of the optimum particle size has shown the benefits of 1–2 μm particle on SEC separations.[67] With the advent of sub-um SEC column packing materials, these resolution improvements can be realized. Diedrich evaluated columns of varying particle size for the analysis of monoclonal antibodies.[109] Improved resolution and higher efficiencies were observed for sub-2 μm SEC columns at higher flow rates resulting in shorter run times (Figure 7).
Figure 7.
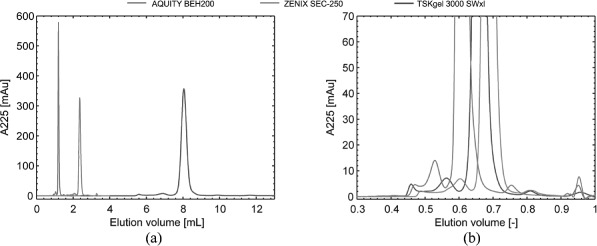
Effect of particle size (dp). (A) Overlay of single injection chromatograms of a mAb sample (1.0 g/L) analyzed on AQCUITY BEH200(1.7 μm). Zenix SEC-250 (3 μm) and TSKgel 3000 SWxl (5 μm). (B) For comparability, elution volumes were normalized to column void volumes. Reprinted from Reference[109] with permission from Elsevier. (Color figure available online.)
APPLICATIONS
There have been numerous applications of SEC reported over the last few decades for a wide range of analytes. However, the scope of this section of the review will be the use of SEC in the field of biotherapeutic protein development and some of the considerations that may be important to addressed when using this separation mode for that purpose. The primary application for SEC in the biopharmaceutical industry is the routine monitoring of protein or modified protein (protein-drug conjugates, pegylated proteins, etc.) aggregation and quaternary structure.[113] Given the sensitivity and reproducibility of the method, SEC may be considered as the standard method for monitoring protein aggregation,[114] and is included in the list of the typically used tests in the European Pharmacopoeia guidance document entitled “Technical Guide for the Elaboration of Monographs on Synthetic Peptides and Recombinant DNA Proteins,” 1st Edition 2006.[115] In these regards, SEC can be used as an integral part of an analytical testing strategy designed to provide assurance of biopharmaceutical product safety and although this information is not included or has been redacted from the FDA Summary Basis for Approval for most products, the method is likely positioned as a registered test in the majority of the Chemistry, Manufacturing & Controls (CMC) sections of current regulatory filings.
SEC is often used as a tool to aid in manufacturing process and formulation development. As part of the manufacturing process development SEC can be used to guide cell-line selection. These data can be invaluable in not only selecting a cell-line that produces the lowest levels of aggregates, it can also discriminate between aggregate forms that may be more or less difficult to remove during downstream purification steps.[116] Another use for SEC during cell-line development is to ensure that the specific activity of the purified protein is not under-reported or in rare cases over-reported as the result of increased aggregation.[117,118]
SEC can also be used extensively to guide the development of the purification process for biopharmaceuticals. There have been vast numbers of biopharmaceutical new chemical entities (NCE) that are antibodies or antibody-like in recent years.[119] The primary purification workhorse for these molecules is Protein A or G affinity purification. Although this purification step can provide high log removal of conditioned media impurities as the first step in the purification process, a significant removal of aggregate impurities is not typically observed and often the elution conditions of the affinity purification step can potentially induce further aggregate formation.[120] As a result, further polishing steps including gel-filtration, ion-exchange, hydrophobic interaction, or hydroxyapatite chromatography are often required to control the levels of aggregate of the purified protein.[121–123] The use of SEC derived data to assist in the optimization of these methods is ideal due to the short run times and amenability of the method to most buffer systems. One disadvantage, however, is that since on-column analyte concentration is not possible the sample concentrations must be adequate to provide meaningfully results. To address this limitation alternative UV absorbance wavelengths or fluorescence can be used.[19,87]
Changes in the extent and forms of protein aggregation are primary concerns during product formulation development. The short run times and quantitative reproducibility make SEC an appropriate method for stability monitoring. Stability protocols with multiple formulations, manufacturing batches, storage conditions, and time-points can generate large numbers of samples and the 15–20min run-times achieved by HPLC columns and systems can provide good sample throughput. Recently, the availability of sub-2 μm particle size SEC columns and low dispersion UPLC systems have reduced these run-time by approximately two times or more, and through the use of sample interlacing routine analyses of under 2 min per sample have been reported.[109] A complication to the SEC analysis of a protein drug product can also be the coeleution of excipients such as the non-ionic surfactant polysorbate 80.[124] To address this issue, alternative UV absorbance wavelengths or the intrinsic fluorescence of the protein may be used to advantage.[86,87]
The limitations of SEC have been well documented.[15,16,125,126] During the development and application of an SEC method for the analysis of a biotherapeutic protein orthogonal techniques such as sedimentation velocity analytical ultracentrifugation (SV-AUC), asymmetrical flow field flow fractionation (AF4), and dynamic light scattering (DLS) may be needed to confirm that the SEC method is providing an accurate representation of the forms and level of aggregates in the protein sample.
In addition to providing assurance that an SEC method is providing an accurate assessment of the aggregate levels and forms present, the biochemical and biophysical characterization of the aggregate forms is also a valuable part of a thorough protein characterization study. During the initial phases of protein development, the characterization of the aggregate fraction may, for example, include host-cell protein analysis, bioactivity, posttranslational modifications, and mass analysis (MALLS or MS). Additionally, as the product moves through to commercialization this characterization may need to be repeated or enhanced depending on the extent of any changes in the manufacturing process as part of a comparability assessment to provide assurance that the nature of the aggregate forms present in the products produced by the two manufacturing processes are comparable.
Currently, with patent protections running their course, there has been a surge of interest in the area of biosimilars.[127–129] While no clear guidance with respect to SEC fraction characterization has been documented for biosimilars, a complete comparability package would likely contain a comparison of an appropriate combination of orthogonal analyses and aggregate peak characterization data for both the innovator and the biosimilar products.
CONCLUDING REMARKS
Since the introduction of the first recombinant insulin in 1982, nearly three decades after the first reported uses of SEC for protein analysis, SEC has become the most widely applied method for the routine analysis of aggregation for biotherapeutic peptides and proteins. Additionally, SEC has been used extensively to guide manufacturing process and formulation development for these classes of biotherapeutics. The broad adoption of this method for these analyses can be attributed to its simplicity, reproducibility, sensitivity, and speed. More recently, dramatic improvements in resolution, sensitivity, and throughput provided by the use of smaller particle columns (≤2 μm) on low dispersion UHPLC instrumentation have further enhanced the capabilities of SEC.[109]
A thorough understanding of the principles and practices of SEC is vital to developing robust, accurate, and precise methods. While SEC separations, in theory, are based solely on the size of the protein or peptide in solution, non-ideal interactions between these large molecules and the column packing materials are often encountered in routine practice. These interactions can deleteriously affect the retention time, peak shape, and recovery of the protein and should be minimized through method optimization. In addition, SEC method development should also include an appropriate evaluation of the chromatographic recovery of both the drug product and any aggregate forms present in the sample.
The analysis of protein and peptide aggregation as a critical quality attribute, will continue to be of importance into the future as a result of the steady introduction of novel protein and peptide based biotherapeutics into the clinic, at a rate of approximately 40 per year since 2007.[119] SEC, a nearly 50-year-old technique, has continued to evolve in order to meet the ever greater demands in terms of accuracy and sample throughput, is currently the primary means of routinely measuring protein aggregate levels. However, the use of SEC in this capacity should always be demonstrated to be appropriate for a specific biopharmaceutical sample.
LIST OF SYMBOLS
- a, b, c
Constants in van Deemter Equation
- Dm
Diffusion coefficient
- dp
Particle size
- H
Plate height
- k
Partition coefficient, retention factor
- k″
Alternative retention factor (Equation 3.6)
- KD
Partition coefficient for SEC
- m, b
Slope and intercept of SEC calibration curve in linear region
- L
Column length
- M
Molecular weight
- N
Plate number
- R
Gas constant
- Rs
Resolution
- T
Absolute Temperature
- u
Linear velocity
- Vi
Intraparticle volume
- V0
Interstitial volume
- VR
Retention volume
- ΔG0
Standard Gibbs free energy change
- ΔH0
Standard enthalpy change
- ΔS0
Standard entropy change
- η
Viscosity
- ρ
Standard deviation of peak width
REFERENCES
- 1.Boschetti E., Jungbauer A. Separation of Antibodies by Liquid Chromatography, chapter 15. Vol. 2. San Diego, CA, USA: Academic Press; 2000. pp. 535–630. [Google Scholar]
- 2.Driver J. L., Raynie D. E. Method Development for Biomolecules. In: Ahuja S., Rasmussen H., editors. HPLC Method Development of Pharmaceuticals, Chapter 15. New York: Elsevier; 2007. pp. 425–439. [Google Scholar]
- 3.Brange J., Langkjaer L., Havelund S., Vølund A. Chemical Stability of Insulin. 1. Hydrolytic Degradation During Storage of Pharmaceutical Preparations. Pharm. Res. 1992;9(6):715–726. doi: 10.1023/a:1015835017916. [DOI] [PubMed] [Google Scholar]
- 4.Oliva A., Fariña J., Llabrés M. Development of Two High-Performance Liquid Chromatographic Methods for the Analysis and Characterization of Insulin and Its Degradation Products in Pharmaceutical Preparations. Journal of Chromatography B: Biomedical Sciences and Applications. 2000;749(1):25–34. doi: 10.1016/s0378-4347(00)00374-1. [DOI] [PubMed] [Google Scholar]
- 5.Tantipolphan R., Romeijn S., Engelsman J., Torosantucci R., Rasmussen T., Jiskoot W. Elution Behavior of Insulin on High-Performance Size Exclusion Chromatography at Neutral pH. Journal of Pharmaceutical and Biomedical Analysis. 2010;52(2):195–202. doi: 10.1016/j.jpba.2010.01.014. [DOI] [PubMed] [Google Scholar]
- 6.Yu C.-M., Mun S., Wang N.-H.L. Phenomena of Insulin Peak Fronting in Size Exclusion Chromatography and Strategies to Reduce Fronting. Journal of Chromatography A. 2008;1192(1):121–129. doi: 10.1016/j.chroma.2008.03.055. [DOI] [PubMed] [Google Scholar]
- 7.Luo Y., Matejic T., Ng C.-K., Nunnally B., Porter T., Raso S., Rouse J., Shang T., Steckert J. Characterization and Analysis of Biopharmaceutical Proteins. In: Satinder A., Stephen S., editors. Separation Science and Technology. Vol. 10. San Diego, CA, USA: Academic Press; 2011. pp. 283–359. chapter 8. [Google Scholar]
- 8.Engelsman J., Garidel P., Smulders R., Koll H., Smith B., Bassarab S., Seidl A., Hainzl O., Jiskoot W. Strategies for the Assessment of Protein Aggregates in Pharmaceutical Biotech Product Development. Pharmaceutical Research. 2010:1–14. doi: 10.1007/s11095-010-0297-1. [DOI] [PMC free article] [PubMed] [Google Scholar]
- 9.John S. Philo Is Any Measurement Method Optimal for all Aggregate Sizes and Types? AAPS J. 2006;8(3):E564–71. doi: 10.1208/aapsj080365. [DOI] [PMC free article] [PubMed] [Google Scholar]
- 10.Rosenberg A. S. Effects of Protein Aggregates: An Immunologic Perspective. AAPS J. 2006;8(3):E501–E507. doi: 10.1208/aapsj080359. [DOI] [PMC free article] [PubMed] [Google Scholar]
- 11.Ejima D., Yumioka R., Arakawa T., Tsumoto K. Arginine as an Effective Additive in Gel Permeation Chromatography. J Chromatogr A. 2005;1094(1–2):49–55. doi: 10.1016/j.chroma.2005.07.086. [DOI] [PubMed] [Google Scholar]
- 12.Oliva A., Llabrés M., Fariña J. B. Comparative Study of Protein Molecular Weights by Size-Exclusion Chromatography and Laser-Light Scattering. J Pharm Biomed Anal. 2001;25(5–6):833–841. doi: 10.1016/s0731-7085(01)00359-4. [DOI] [PubMed] [Google Scholar]
- 13.Kueltzo L. A., Wang W., Randolph T. W., Carpenter J. F. Effects of Solution Conditions, Processing Parameters, and Container Materials on Aggregation of a Monoclonal Antibody During Freeze-Thawing. Journal of Pharmaceutical Sciences. 2008;97(5):1801–1812. doi: 10.1002/jps.21110. [DOI] [PubMed] [Google Scholar]
- 14.Gabrielson J. P., Brader M. L., Pekar A. H., Mathis K. B., Winter G., Carpenter J. F., Randolph T. W. Quantitation of Aggregate Levels in a Recombinant Humanized Monoclonal Antibody Formulation by Size-Exclusion Chromatography, Asymmetrical Flow Field Flow Fractionation, and Sedimentation Velocity. J. Pharm. Sci. 2007;96(2):268–279. doi: 10.1002/jps.20760. [DOI] [PubMed] [Google Scholar]
- 15.Arakawa T., Philo J. S., Ejima D., Tsumoto K., Arisaka F. Aggregation Analysis of Therapeutic Proteins, Part 2. Analytical ultracentrifugation and dynamic light scattering. BioProcess International. 2007;5(4):36–47. [Google Scholar]
- 16.Liu J., Andya J. D., Shire S. J. A. Critical Review of Analytical Ultracentrifugation and Field Flow Fractionation Methods for Measuring Protein Aggregation. AAPS J. 2006;8(3):E580–E589. doi: 10.1208/aapsj080367. [DOI] [PMC free article] [PubMed] [Google Scholar]
- 17.Demeule B., Lawrence M. J., Drake A. F., Gurny R., Arvinte T. Characterization of Protein Aggregation: The Case of a Therapeutic Immunoglobulin. Biochimica et Biophysica Acta (BBA) - Proteins & Proteomics. 2007;1774(1):146–153. doi: 10.1016/j.bbapap.2006.10.010. [DOI] [PubMed] [Google Scholar]
- 18.Williams S. K. R., Lee D. Field-Flow Fractionation of Proteins, Polysaccharides, Synthetic Polymers, and Supramolecular Assemblies. Journal of Separation Science. 2006;29(12):1720–1732. doi: 10.1002/jssc.200600151. [DOI] [PubMed] [Google Scholar]
- 19.Folta-Stogniew E., Williams K. R. Determination of Molecular Masses of Proteins in Solution: Implementation of an HPLC Size Exclusion Chromatography and Laser Light Scattering Service in a Core Laboratory. J. Biomol. Techniques. 1999;10(2):51–63. [PMC free article] [PubMed] [Google Scholar]
- 20.Bond M. D., Panek M. E., Zhang Z., Wang D., Mehndiratta P., Zhao H., Gunton K., Ni A., Nedved M. L., Burman S., Volkin Evaluation of a Dual-Wavelength Size Exclusion HPLC Method with Improved Sensitivity to Detect Protein Aggregates and Its Use to Better Characterize Degradation Pathways of an IgG1 Monoclonal Antibody. J Pharm Sci. 2010;99(6):2582–97. doi: 10.1002/jps.22034. [DOI] [PubMed] [Google Scholar]
- 21.Synge R. L. M., Tiselius A. Fractionation of Hydrolysis Products of Amylose by Electrokinetic Ultrafiltration in an Agar-Agar Jelly. Biochemical Journal. 1950;46:xli. [PubMed] [Google Scholar]
- 22.Barrer R. M. General and Physical Chemistry. III. Zeolites as adsorbents and molecular sieves. Annu. Rep. Prog. Chem. 1944;41:31–46. [Google Scholar]
- 23.Huo Q. Synthetic Chemistry of the Inorganic Ordered Porous Materials. Elsevier: Amsterdam; 2011. pp. 339–373. chapter 16. [Google Scholar]
- 24.Pedersen K. O. Exclusion Chromatography. Arch Biochem Biophys. 1962(Suppl 1):157–168. [PubMed] [Google Scholar]
- 25.Steere R. L., Ackers G. K. Restricted-Diffusion Chromatography through Calibrated Columns of Granulated Agar Gel; A Simple Method for Particle-Size Determination. Nature. 1962;196(4853):475–476. [Google Scholar]
- 26.Dubin P. L., Koontz S., Wright K. L. Substrate-polymer Interactions in Liquid Exclusion Chromatography (GPC) in N,N-dimethylformamide. Journal of Polymer Science: Polymer Chemistry Edition. 1977;15(9):2047–2057. [Google Scholar]
- 27.Wheaton R. M., Bauman W. C. Non-Ionic Separations with Ion Exchange Resins. Annals of the New York Academy of Sciences. 1953;57(3):159–176. doi: 10.1111/j.1749-6632.1953.tb36394.x. [DOI] [PubMed] [Google Scholar]
- 28.Clark R. T. Separation of Glycerol from Polyhydric Alcohol Mixture by Nonionic Exclusion. Analytical Chemistry. 1958;30(10):1676–1678. [Google Scholar]
- 29.Lindqvist B., Storgårds T. Molecular-Sieving Properties of Starch. Nature. 1955;175:511–512. [Google Scholar]
- 30.Lathe G. H., Ruthven C. R. J. The Separation of Substances on the Basis of Their Molecular Weights, Using Columns of Starch and Water. Biochemical Journal. 1955;60(4):xxxvi. [PubMed] [Google Scholar]
- 31.Lathe G. H., Ruthven C. R. J. The Separation of Substances and Estimation of Their Relative Molecular Sizes by the Use of Columns of Starch in Water. Biochemical Journal. 1956;62(4):665–674. doi: 10.1042/bj0620665. [DOI] [PMC free article] [PubMed] [Google Scholar]
- 32.Porath J., Flodin P. Gel Filtration: A Method for Desalting and Group Separation. Nature. 1959;183:1657–1659. doi: 10.1038/1831657a0. [DOI] [PubMed] [Google Scholar]
- 33.Porath J. Gel Filtration of Proteins, Peptides and Amino Acids. Biochimica et Biophysica Acta. 1960;39(2):193–207. doi: 10.1016/0006-3002(60)90153-0. [DOI] [PubMed] [Google Scholar]
- 34.Flodin P. Methodological Aspects of Gel Filtration with Special Reference to Desalting Operations. Journal of Chromatography A. 1961;5:103–115. [Google Scholar]
- 35.Flodin P. G. M., Porath J. O. US Patent 3,002,823. Process of separating materials having different molecular weights and dimensions, 1961.
- 36.Flodin P. G. M. US Patent 3,208,994. Process for preparing hydrophilic copolymerization and product obtained thereby, 1965.
- 37.Gelotte B. Studies on gel filtration: Sorption Properties of the Bed Material Sephadex. Journal of Chromatography A. 1960;3:330–342. [Google Scholar]
- 38.Polson A. Fractionation of Protein Mixtures on Columns of Granulated Agar. Biochimica et Biophysica Acta. 1961;50(3):565–567. doi: 10.1016/0006-3002(61)90016-6. [DOI] [PubMed] [Google Scholar]
- 39.Hjertén S. The Preparation of Agarose Spheres for Chromatography of Molecules and Particles. Biochimica et Biophysica Acta (BBA) - Specialized Section on Biophysical Subjects. 1964;79(2):393–398. [PubMed] [Google Scholar]
- 40.Hjertén S. HPLC of Biopolymers on Columns of Agarose. Acta Chemica Scandinavica B. 1982;36:203–209. [Google Scholar]
- 41.Hjertén S., Mosbach R. “Molecular-Sieve” Chromatography of Proteins on Columns of Cross-Linked Polyacrylamide. Analytical Biochemistry. 1962;3(2):109–118. doi: 10.1016/0003-2697(62)90100-8. [DOI] [PubMed] [Google Scholar]
- 42.Lea D. J., Sehon A. H. Preparation of Synthetic Gels for Chromatography of Macromolecules. Canadian Journal of Chemistry. 1962;40(1):159–160. [Google Scholar]
- 43.Sun K., Sehon A. H. The Use of Polyacrylamide Gels for Chromatography of Proteins. Canadian Journal of Chemistry. 1965;43(4):969–976. [Google Scholar]
- 44.Regnier F. E., Noel R. Glycerolpropylsilane Bonded Phases in the Steric Exclusion Chromatography of Biological Macromolecules. Journal of Chromatographic Science. 1976;14:316–320. doi: 10.1093/chromsci/14.7.316. [DOI] [PubMed] [Google Scholar]
- 45.Engelhardt H., Mathes D. High-performance Liquid Chromatography of Proteins Using Chemically-Modified Silica Supports. Chromatographia. 1981;14:325–332. [Google Scholar]
- 46.Porsch B. Epoxy- and diol-modified Silica: Optimization of Surface Bonding Reaction. Journal of Chromatography A. 1993;653(1):1–7. [Google Scholar]
- 47.Roumeliotis P., Unger K. K. Assessment and Optimization of System Parameters in Size Exclusion Separation of Proteins on Diol-Modified Silica Columns. Journal of Chromatography A. 1981;218:535–546. [Google Scholar]
- 48.Roumeliotis P., Unger K. K. Structure and Properties Ofn-Alkyldimethylsilyl Bonded Silica Reversed-Phase Packings. Journal of Chromatography A. 1978;149:211–224. [Google Scholar]
- 49.Wyndham K. D., O'Gara J. E., Walter T. H., Glose K. H., Lawrence N. L., Alden B. A., Izzo G. S., Hudalla C. J., Iraneta P. C. Characterization and evaluation of C18 HPLC Stationary Phases Based on Ethyl-Bridged Hybrid Organic/Inorganic Particles. Analytical Chemistry. 2003;75(24):6781–6788. doi: 10.1021/ac034767w. [DOI] [PubMed] [Google Scholar]
- 50.Bouvier E. S. P., Serpa S., Brady N., Wyndham K. D., Lawrence N. L., Hong P., Neue U. D., Walter T. H. Biomolecule Separations by UPLC-SEC. Presented at HPLC 2010, Boston, MA. Poster P-314-T, 2010.
- 51.Czok M., Guiochon G. Aligned Fiber Columns for Size-Exclusion Chromatography. Journal of Chromatography A. 1990;506:303–317. [Google Scholar]
- 52.Li Y., Tolley H. D., Lee M. L. Preparation of Polymer Monoliths that Exhibit Size Exclusion Properties for Proteins and Peptides. Analytical Chemistry. 2009;81(11):4406–4413. doi: 10.1021/ac900364d. [DOI] [PubMed] [Google Scholar]
- 53.Horváth C., Melander W. R., Heftmann E. Journal of Chromatography Library. Vol. 22. New York: Elsevier; 1983. Theory of Chromatography; pp. A27–A135. chapter 3. [Google Scholar]
- 54.Striegel A. M., Yau W. W., Kirkland J. J., Bly D. D. Modern Size-Exclusion Liquid Chromatography: Practice of Gel Permeation and Gel Filtration Chromatography. 2nd Edition. New Jersey: John Wiley & Sons; 2009. [Google Scholar]
- 55.Guo X., Condra M., Kimura K., Berth G., Dautzenberg H., Dubin P. L. Determination of Molecular Weight of Heparin by Size Exclusion Chromatography with Universal Calibration. Anal Biochem. Jan 2003;312(1):33–39. doi: 10.1016/s0003-2697(02)00428-1. [DOI] [PubMed] [Google Scholar]
- 56.Vander Heyden Y., Popovici S. T., Schoenmakers P. J. Evaluation of Size-Exclusion Chromatography and Size-Exclusion Electrochromatography Calibration Curves. Journal of Chromatography A. 2002;957(2):127–137. doi: 10.1016/s0021-9673(02)00311-4. [DOI] [PubMed] [Google Scholar]
- 57.Kostanski L. K., Keller D. M., Hamielec A. E. Size-Exclusion Chromatography—A Review of Calibration Methodologies. Journal of Biochemical and Biophysical Methods. 2004;58(2):159–186. doi: 10.1016/j.jbbm.2003.10.001. [DOI] [PubMed] [Google Scholar]
- 58.Kunji E. R. S., Harding M., Butler P. J. G., Akamine P. Determination of the Molecular Mass and Dimensions of Membrane Proteins by Size Exclusion Chromatography. Methods. 2008;46(2):62–72. doi: 10.1016/j.ymeth.2008.10.020. [DOI] [PubMed] [Google Scholar]
- 59.Yau W. W., Ginnard C. R., Kirkland J. J. Broad-Range Linear Calibration in High-Performance Size-Exclusion Chromatography Using Column Packings with Bimodal Pores. Journal of Chromatography A. 1978;149:465–487. [Google Scholar]
- 60.Yau W. W., Kirkland J. J., Bly D. D., Stoklosa H. J. Effect of Column Performance on the Accuracy of Molecular Weights Obtained from Size Exclusion Chromatography (Gel Permeation Chromatography) Journal of Chromatography A. 1976;125(1):219–230. [Google Scholar]
- 61.Štulk K., Pacáková V., Tichá M. Some Potentialities and Drawbacks of Contemporary Size-Exclusion Chromatography. Journal of Biochemical and Biophysical Methods. 2003;56(1–3):1–13. doi: 10.1016/s0165-022x(03)00053-8. [DOI] [PubMed] [Google Scholar]
- 62.Erdner J. M., Barth H. G., Foley J. P., Payne W. G. Size-Exclusion Chromatography Using Deuterated Mobile Phases. Journal of Chromatography A. 2006;1129(1):41–46. doi: 10.1016/j.chroma.2006.06.073. [DOI] [PubMed] [Google Scholar]
- 63.Kopaciewicz W., Regnier F. E. Nonideal Size-Exclusion Chromatography of Proteins: Effects of pH at Low Ionic Strength. Analytical Biochemistry. 1982;126(1):8–16. doi: 10.1016/0003-2697(82)90102-6. [DOI] [PubMed] [Google Scholar]
- 64.Arakawa T., Ejima D., Li T., Philo J. S. The Critical Role of Mobile Phase Composition in Size Exclusion Chromatography of Protein Pharmaceuticals. J Pharm Sci. Apr. 2010;99(4):1674–1692. doi: 10.1002/jps.21974. [DOI] [PubMed] [Google Scholar]
- 65.Golovchenko N. P., Kataeva I. A., Akimenko V. K. Analysis of pH-Dependent Protein Interactions with Gel Filtration Medium. Journal of Chromatography A. 1992;591(1–2):121–128. doi: 10.1016/0021-9673(92)80229-n. [DOI] [PubMed] [Google Scholar]
- 66.Ghrist B. F. D., Stadalius M. A., Snyder L. R. Predicting Bandwidth in the High-Performance Liquid Chromatographic Separation of Large Biomolecules: I. Size-Exclusion Studies and the Role of Solute Stokes Diameter Versus Particle Pore Diameter. Journal of Chromatography A. 1987;387:1–19. doi: 10.1016/s0021-9673(01)94510-8. [DOI] [PubMed] [Google Scholar]
- 67.Guiochon G., Martin M. Theoretical Investigation of the Optimum Particle Size for the Resolution of Proteins by Size-Exclusion Chromatography. Journal of Chromatography A. 1985;326:3–32. [Google Scholar]
- 68.Groh R., Halász I. Measurement of Band Broadening in Size Exclusion Chromatography. Analytical Chemistry. 1981;53(9):1325–1335. [Google Scholar]
- 69.Link G. W., Jr., Keller P. L., Stout R. W., Banes A. J. Effects of Solutions Used for Storage of Size-Exclusion Columns on Subsequent Chromatography of Peptides and Proteins. Journal of Chromatography A. 1985;331(0):253–264. doi: 10.1016/0021-9673(85)80031-5. [DOI] [PubMed] [Google Scholar]
- 70.Giddings J. C., Mallik K. L. Theory of Gel Filtration (Permeation) Chromatography. Analytical Chemistry. 1966;38(8):997–1000. [Google Scholar]
- 71.Dawkins J. V., Yeadon G. Macromolecular Separations by Liquid Exclusion Chromatography. Faraday Symposia of the Chemical Society. 1980;15:127–138. [Google Scholar]
- 72.Yossen M. M., Vega J. R., Meira G. R. Estimation of Band Broadening in Size-Exclusion Chromatography. I. A Method Based on Analyzing Narrow Standards with a Molar Mass-Sensitive Detector. Journal of Chromatography A. 2006;1128(1–2):171–180. doi: 10.1016/j.chroma.2006.06.062. [DOI] [PubMed] [Google Scholar]
- 73.Bowsher R. R., Santa P. F. Application of Size-Exclusion Chromatography in the Investigation of the in Vitro Stability of Proinsulin and its Cleaved Metabolites in Human Serum and Plasma. Journal of Chromatography B. 2009;877(8–9):689–696. doi: 10.1016/j.jchromb.2009.01.035. [DOI] [PubMed] [Google Scholar]
- 74.O'Callaghan D. M., Donnelly W. J., Slattery H. M., Mulvihill D. M. Non-Size Exclusion Effects During Gel Permeation Chromatography of Milk Protein Hydrolysates on an Fplc Superose 12 Column. Journal of Liquid Chromatography. 1995;18(8):1543–1562. [Google Scholar]
- 75.Popovici S.-T., Kok W. T., Schoenmakers P. J. Band Broadening in Size-Exclusion Chromatography of Polydisperse Samples. Journal of Chromatography A. 2004;1060(1–2):237–252. doi: 10.1016/j.chroma.2004.05.099. [DOI] [PubMed] [Google Scholar]
- 76.Ziegler A., Zaia J. Size-Exclusion Chromatography of Heparin Oligosaccharides at High and Low Pressure. Journal of Chromatography B. 2006;837(1–2):76–86. doi: 10.1016/j.jchromb.2006.04.013. [DOI] [PubMed] [Google Scholar]
- 77.Gritti F., Farkas T., Heng J., Guiochon G. On the Relationship between band Broadening and the Particle-Size Distribution of the Packing Material in Liquid Chromatography: Theory and Practice. Journal of Chromatography A. 2011;1218(45):8209–8221. doi: 10.1016/j.chroma.2011.09.034. [DOI] [PubMed] [Google Scholar]
- 78.Grznárorá G., Polakovič M., Ačai P., Görner T. Extra-Column Dispersion of Macromolecular Solutes in Aqueous Phase Size-Exclusion Chromatography. Journal of Chromatography A. 2004;1040(1):33–43. doi: 10.1016/j.chroma.2004.03.066. [DOI] [PubMed] [Google Scholar]
- 79.Kirkland J. J., Yau W. W., Stoklosa H. J., Dilks C. H., Jr. Sampling and Extra-Column Effects in High-Performance Liquid Chromatography; Influence of Peak Skew on Plate Count Calculations. J Chromatogr Sci. Aug. 1977;15(8):303–16. doi: 10.1093/chromsci/15.8.303. [DOI] [PubMed] [Google Scholar]
- 80.Egeberg P. K. An Iterative Method for Solving Inverse Problems Arising from Dispersion in High Pressure Size Exclusion Chromatography. Analytica Chimica Acta. 1999;392(2–3):183–189. [Google Scholar]
- 81.Christian J. Evaluation of the “Effective Volume Shift” Method for Axial Dispersion Corrections in Multi-Detector Size Exclusion Chromatography. Polymer. 1999;40(13):3735–3742. [Google Scholar]
- 82.Fountain K. J., Neue U. D., Grumbach E. S., Diehl D. M. Effects of Extra-Column Band Spreading, Liquid Chromatography System Operating Pressure, and Column Temperature on the Performance of Sub-2-µm Porous Particles. Journal of Chromatography A. 2009;1216(32):5979–5988. doi: 10.1016/j.chroma.2009.06.044. [DOI] [PubMed] [Google Scholar]
- 83.Qian J., Tang Q., Cronin B., Markovich R., Rustum A. Development of a High Performance Size Exclusion Chromatography Method to Determine the Stability of Human Serum Albumin in a Lyophilized Formulation of Interferon alfa-2b. J Chromatogr A. 2008;1194(1):48–56. doi: 10.1016/j.chroma.2008.01.040. [DOI] [PubMed] [Google Scholar]
- 84.Aitken A., Learmonth M. Protein Determination by uv Absorption. In: Walker John M., editor. The Protein Protocols Handbook; Totowa, NJ, USA: Humana Press; 1996. pp. 3–6. [Google Scholar]
- 85.Wolf P. A. Critical Reappraisal of Waddell's Technique for Ultraviolet Spectrophotometric Protein Estimation. Analytical Biochemistry. 1983;129(1):145–155. doi: 10.1016/0003-2697(83)90062-3. [DOI] [PubMed] [Google Scholar]
- 86.Diress A., Lorbetskie B., Larocque L., Li X., Alteen M., Isbrucker R., Girard M. Study of Aggregation, Denaturation and Reduction of Interferon Alpha-2 Products by Size-Exclusion High-Performance Liquid Chromatography with Fluorescence Detection and Biological Assays. Journal of Chromatography A. 2010;1217(19):3297–3306. doi: 10.1016/j.chroma.2009.10.081. [DOI] [PubMed] [Google Scholar]
- 87.Gunturi S. R., Ghobrial I., Sharma B. Development of a Sensitive Size Exclusion HPLC Method with Fluorescence Detection for the Quantitation of Recombinant Human Erythropoietin (r-HuEPO) Aggregates. J Pharm Biomed Anal. 2007;43(1):213–221. doi: 10.1016/j.jpba.2006.06.006. [DOI] [PubMed] [Google Scholar]
- 88.Ovalles J. F., Brunetto Mdel R., Gallignani M. A New Method for the Analysis of Amikacin Using 6-Aminoquinolyl-N-Hydroxysuccinimidyl Carbamate (AQC) Derivatization and High-Performance Liquid Chromatography with uv-Detection. J Pharm Biomed Anal. 2005;39(1–2):294–8. doi: 10.1016/j.jpba.2005.02.030. [DOI] [PubMed] [Google Scholar]
- 89.Wang T., Lucey J. A. Use of Multi-Angle Laser Light Scattering and Size-Exclusion Chromatography to Characterize the Molecular Weight and Types of Aggregates Present in Commnercial Whey Protein Products. J. Dairy Sci. 2003;86:3090–3101. doi: 10.3168/jds.S0022-0302(03)73909-5. [DOI] [PubMed] [Google Scholar]
- 90.Ahrer K., Buchacher A., Iberer G., Josic D., Jungbauer A. Analysis of Aggregates of Human Immunoglobulin G Using Size-Exclusion Chromatography, Static and Dynamic Light Scattering. Journal of Chromatography A 1009. 2003(1–2):89–96. doi: 10.1016/s0021-9673(03)00433-3. [DOI] [PubMed] [Google Scholar]
- 91.Ritter A., Schmid M., Affolter S. Determination of Molecular Weights by Size Exclusion Chromatography (SEC) - Results of Round Robin Tests. Polymer Testing. 2010;29(8):945–952. [Google Scholar]
- 92.García M. C. The Effect of the Mobile Phase Additives on Sensitivity in the Analysis of Peptides and Proteins by High-Performance Liquid Chromatography-Electrospray Mass Spectrometry. Journal of Chromatography B. 2005;825(2):111–123. doi: 10.1016/j.jchromb.2005.03.041. [DOI] [PubMed] [Google Scholar]
- 93.Gadgil H. S., Ren D., Rainville P., Mazzeo J. R., Russell R. J., II A Novel SEC-MS Method for the Study of Proteins and Their Interactions. Presented ASMS, Monteal Canada. 2003 June 8–12.
- 94.Liu H., Bulseco G., Chumsae C. Analysis of Reduced Monoclonal Antibodies Using Size Exclusion Chromatography Coupled with Mass Spectrometry. Journal of the American Society for Mass Spectrometry. 2009;20(12):2258–2264. doi: 10.1016/j.jasms.2009.08.015. [DOI] [PubMed] [Google Scholar]
- 95.Lazar A. C., Wang L., Blättler W. A., Amphlett G., Lambert J. M., Zhang W. Analysis of the Composition of Immunoconjugates Using Size-Exclusion Chromatography Coupled to Mass Spectrometry. Rapid Communications in Mass Spectrometry. 2005;19(13):1806–1814. doi: 10.1002/rcm.1987. [DOI] [PubMed] [Google Scholar]
- 96.Cavanagh J., Benson L. M., Thompson R., Naylor S. In-Line Desalting Mass Spectrometry for the Study of Noncovalent Biological Complexes. Analytical Chemistry. 2003;75(14):3281–3286. doi: 10.1021/ac030182q. [DOI] [PubMed] [Google Scholar]
- 97.Chakraborty A., Chen W., Mazzeo J. A Generic On-Line UPLC-SEC/UV/MS Method for the Analysis of Reduced Monoclonal Antibodies. Waters Corporation, Application Note. 2011. 720004018EN.
- 98.Dubin P. L., Edwards S. L., Mehta M. S., Tomalia D. Quantitation of Non-Ideal Behavior in Protein Size-Exclusion Chromatography. Journal of Chromatography A. 1993;635(1):51–60. [Google Scholar]
- 99.Mant C. T., Parker J. M. R., Hodges R. S. Size-Exclusion High-Performance Liquid Chromatography of Peptides: Requirement for Peptide Standards to Monitor Column Performance and Non-Ideal Behaviour. Journal of Chromatography A. 1987;397:99–112. doi: 10.1016/s0021-9673(01)84993-1. [DOI] [PubMed] [Google Scholar]
- 100.Ricker R. D., Sandoval L. A. Fast, Reproducible Size-Exclusion Chromatography of Biological Macromolecules. Journal of Chromatography A. 1996;743(1):43–50. doi: 10.1016/0021-9673(96)00283-x. [DOI] [PubMed] [Google Scholar]
- 101.Arakawa T., Philo J. S., Ejima D., Tsumoto D. K., Arisaka F. Aggregation Analysis of Therapeutic Proteins, Part 1. BioProcess International. 2006;4(10):32–42. [Google Scholar]
- 102.Hong P., Bouvier E. S. P., Fountain K. J. Evaluation of Size-Exclusion Chromatography Packing Materials for the Analysis of Proteins and Higher Order Aggregates. Presented HPLC 2011, Budapest, Hungary. Poster P1-S-383-MO. 2011.
- 103.Kamberi M., Chung P., DeVas R., Li L., Li Z., Ma X., Fields S., Riley C. M. Analysis of Non-Covalent Aggregation of Synthetic hPTH (1–34) by Size-Exclusion Chromatography and the Importance of Suppression of Non-Specific Interactions for a Precise Quantitation. Journal of Chromatography B. 2004;810(1):151–155. doi: 10.1016/j.jchromb.2004.07.026. [DOI] [PubMed] [Google Scholar]
- 104.Irvine G. B. High-Performance Size-Exclusion Chromatography of Polypeptides on a TSK G2000SW Column in Acidic Mobile Phases. Journal of Chromatography A. 1987;404:215–222. doi: 10.1016/s0021-9673(01)86851-5. [DOI] [PubMed] [Google Scholar]
- 105.Yumioka R., Sato H., Tomizawa H., Yamasaki Y., Ejima D. Mobile Phase Containing Arginine Provides More Reliable SEC Condition for Aggregation Analysis. J Pharm Sci. 2010;99(2):618–620. doi: 10.1002/jps.21857. [DOI] [PubMed] [Google Scholar]
- 106.Engelhardt H., Schön U. Optimal Conditions for Size Exclusion Chromatography of Proteins. Chromatographia. 1986;22:388–390. [Google Scholar]
- 107.Hasegawa M., Kitano H. The Effect of Pore-Size Distribution on the Binding of Proteins to Porous Resin Beads. Biotechnology and Bioengineering. 1991;37(7):608–613. doi: 10.1002/bit.260370703. [DOI] [PubMed] [Google Scholar]
- 108.Popovici S. T., Schoenmakers P. J. Fast Size-Exclusion Chromatography-Theoretical and Practical Considerations. Journal of Chromatography A. 2005;1099(1–2):92–102. doi: 10.1016/j.chroma.2005.08.071. [DOI] [PubMed] [Google Scholar]
- 109.Diederich P., Hansen S. K., Oelmeier S. A., Stolzenberger B., Hubbuch J. A Sub-Two Minutes Method for Monoclonal Antibody-Aggregate Quantification Using Parallel Interlaced Size Exclusion High Performance Liquid Chromatography. Journal of Chromatography A. 2011;1218(50):9010–9018. doi: 10.1016/j.chroma.2011.09.086. [DOI] [PubMed] [Google Scholar]
- 110.Anspach B., Gierlich H. U., Unger K. K. Comparative Study of Zorbax Bio Series GF 250 and GF 450 and TSK-Gel 3000 SW and SWXL Columns in Size-Exclusion Chromatography of Proteins. Journal of Chromatography A. 1988;443:45–54. doi: 10.1016/s0021-9673(00)94781-2. [DOI] [PubMed] [Google Scholar]
- 111.Engelhardtm H., Ahr G. Optimization of Efficiency in Size-Exclusion Chromatography. Journal of Chromatography A. 1983;282:385–397. [Google Scholar]
- 112.Hagel L., Lundström H., Andersson T., Lindblom H. Properties, in Theory and Practice, of Novel Gel Filtration Media for Standard Liquid Chromatography. Journal of Chromatography A. 1989;476:329–344. doi: 10.1016/s0021-9673(01)93880-4. [DOI] [PubMed] [Google Scholar]
- 113.Cordoba-Rodriguez R. Aggregates in Mabs and Recombinant Therapeutic Proteins: A Regulatory Perspective. Biopharm International. 2008;21(11):44–53. [Google Scholar]
- 114.Staub A., Guillarme D., Schappler J., Veuthey J.-L., Rudaz S. Intact Protein Analysis in the Biopharmaceutical Field. J Pharm Biomed Anal. 2011;55(4):810–822. doi: 10.1016/j.jpba.2011.01.031. [DOI] [PubMed] [Google Scholar]
- 115.Technical Guide for the Elaboration of Monographs on Synthetic Peptides and Recombinant DNA Proteins. 1st Edition 2006. France: Council of Europe, Strasbourg Cedex; [Google Scholar]
- 116.Jing Y., Borys M., Nayak S., Egan S., Qian Y., Pan S.-H., Li Z. J. Identification of Cell Culture Conditions to Control Protein Aggregation of IGG Fusion Proteins Expressed in Chinese Hamster Ovary Cells. Process Biochemistry. 2012;47(1):69–75. [Google Scholar]
- 117.Robbins D. C., Hirshman M., Wardzala L. J., Horton E. S. High-Molecular-Weight Aggregates of Therapeutic Insulin. In vitro Measurements of Receptor Binding and Bioactivity. Diabetes. 1988;37(1):56–59. doi: 10.2337/diab.37.1.56. [DOI] [PubMed] [Google Scholar]
- 118.López-Serrano P., Cao L., van Rantwijk F., Sheldon R. A. Cross-Linked Enzyme Aggregates with Enhanced Activity: Application to Lipases. Biotechnology Letters. 2002;24(16):1379–1383. [Google Scholar]
- 119.Reichert J. M. Antibody-Based Therapeutics to Watch in 2011. MAbs. 2011;3(1):76–99. doi: 10.4161/mabs.3.1.13895. [DOI] [PMC free article] [PubMed] [Google Scholar]
- 120.Cromwell M. E. M., Hilario E., Jacobson F. Protein Aggregation and Bioprocessing. AAPS J. 2006;8(3):E572–E579. doi: 10.1208/aapsj080366. [DOI] [PMC free article] [PubMed] [Google Scholar]
- 121.Chen J., Tetrault J., Ley A. Comparison of Standard and New Generation Hydrophobic Interaction Chromatography Resins in the Monoclonal Antibody Purification Process. J Chromatogr A Jan. 2008;1177(2):272–281. doi: 10.1016/j.chroma.2007.07.083. [DOI] [PubMed] [Google Scholar]
- 122.Suda E. J., Thomas K. E., Pabst T. M., Mensah P., Ramasubramanyan N., Gustafson M. E., Hunter A. K. Comparison of Agarose and Dextran-Grafted Agarose Strong on Exchangers for the Separation of Protein Aggregates. Journal of Chromatography A. 2009;1216(27):5256–5264. doi: 10.1016/j.chroma.2009.05.021. [DOI] [PubMed] [Google Scholar]
- 123.McCue J. T., Engel P., Thömmes J. Effect of Phenyl Sepharose Ligand Density on Protein Monomer/Aggregate Purification and Separation Using Hydrophobic Interaction Chromatography. Journal of Chromatography A. 2009;1216(6):902–909. doi: 10.1016/j.chroma.2008.12.002. [DOI] [PubMed] [Google Scholar]
- 124.Villalobos A. P., Gunturi S. R., Heavner G. A. Interaction of Polysorbate 80 with Erythropoietin: A Case Study in Protein-Surfactant Interactions. Pharm Res. 2005;22(7):1186–94. doi: 10.1007/s11095-005-5356-7. [DOI] [PubMed] [Google Scholar]
- 125.Berkowitz S. A. Role of Analytical Ultracentrifugation in Assessing the Aggregation of Protein Biopharmaceuticals. AAPS J. 2006;8(3):E590–605. doi: 10.1208/aapsj080368. [DOI] [PMC free article] [PubMed] [Google Scholar]
- 126.Hughes H., Morgan C., Brunyak E., Barranco K., Cohen E., Edmunds T., Lee K. A Multi-Tiered Analytical Approach for the Analysis and Quantitation of High-Molecular-Weight Aggregates in a Recombinant Therapeutic Glycoprotein. AAPS J. 2009;11(2):35–341. doi: 10.1208/s12248-009-9108-1. [DOI] [PMC free article] [PubMed] [Google Scholar]
- 127.Cai X. Y., Gouty D., Baughman S., Ramakrishnan M. S., Cullen C. Recommendations and Requirements for the Design of Bioanalytical Testing Used in Comparability Studies for Biosimilar Drug Development. Bioanalysis. 2011;3(5):535–540. doi: 10.4155/bio.11.24. [DOI] [PubMed] [Google Scholar]
- 128.Falconer R. J., Jackson-Matthews D., Mahler S. M. Analytical Strategies for Assessing Comparability of Biosimilars. Journal of Chemical Technology & Biotechnology. 2011;86(7):915–922. [Google Scholar]
- 129.Schiestl M. A Biosimilar Industry View on the Implementation of the Who Guidelines on Evaluating Similar Biotherapeutic Products. Biologicals. 2011;39(5):297–299. doi: 10.1016/j.biologicals.2011.06.014. [DOI] [PubMed] [Google Scholar]