

Abstract
To evaluate evidence for de novo etiologies in schizophrenia, we sequenced at high coverage the exomes of families recruited from two populations with distinct demographic structure and history. We sequenced a total of 795 exomes from 231 parent-proband trios enriched for sporadic schizophrenia cases, as well as 34 unaffected trios. We observed in cases an excess of non-synonymous single nucleotide variants as well as a higher prevalence of gene-disruptive de novo mutations. We found four genes (LAMA2, DPYD, TRRAP and VPS39) affected by recurrent de novo events within or across the two populations, a finding unlikely to have occurred by chance. We show that de novo mutations affect genes with diverse functions and developmental profiles but we also find a substantial contribution of mutations in genes with higher expression in early fetal life. Our results help define the pattern of genomic and neural architecture of schizophrenia.
Schizophrenia is a severe psychiatric disorder with strong genetic component1. While the contribution of rare de novo copy number variants (CNVs) to schizophrenia risk is well established2-5, the contribution of de novo nucleotide variants has not yet been probed extensively 6,7. We completed exome sequencing of 146 Afrikaner family trios of subjects with a diagnosis of schizophrenia or schizoaffective disorder (SCZAFF)3,8, as well as 34 unaffected control trios (53 and 22 trios, respectively, have been described previously7). We also sequenced the exomes of 85 US trios of subjects with schizophrenia or SCZAFF (see Methods and Supplementary Table 1). We excluded carriers of rare de novo CNVs (≥ 30kb), based on prior CNV scans of these cohorts3,4. We used an analytical pipeline previously described7 and a series of filters, including final validation by Sanger sequencing of all family members (see Methods and Supplementary Fig. 1). More than 90% of single nucleotide variants (SNVs) and 20% of insertions/deletions (indels) were validated (Supplementary Table 2).
In our control cohort, we identified 16 exonic de novo SNVs and 1 protein truncating indel in 34 subjects (0.50 event/sample) (Table 1). The point mutation rate in the captured coding sequence is 1.28 × 10⁻⁸ per base per generation. Among the 16 de novo SNVs, 11 are predicted to be non-synonymous (non-syn) missense and 5 synonymous (syn) changes. The non-syn/syn ratio of 2.20 is consistent with neutral expectation (2.23)9,10 and with those reported for control (unaffected siblings) samples from the Simons Simplex Collection (SSC) (non-syn/syn = 2.23, n = 200, Ref.11; 2.11, n = 31, Ref.12; 2.99, n = 343, Ref.13; average 2.65, n = 574, combined SSC control group).
Table 1.
Distribution of de novo events in family cohorts
| Variant Type | Total number of de novo events (number of events/subject)
|
|||
|---|---|---|---|---|
| Afrikaner cases n = 146 |
US cases n = 85 |
Total cases n = 231 |
Afrikaner controls n = 34 |
|
| SNVs | 93 (0.64) | 53 (0.62) | 146 (0.63) | 16 (0.47) |
| -Non-syn | 80 (0.55) | 41 (0.48) | 121 (0.52) | 11 (0.32) |
| -Syn | 13 (0.09) | 12 (0.14) | 25 (0.11) | 5 (0.15) |
| Non-syn/syn ratio | 6.15 | 3.42 | 4.84 | 2.20 |
| -nonsense | 2 (0.01) | 4 (0.05) | 6 (0.03) | 0 (0.00) |
| -canonical splice site | 3 (0.02) | 2 (0.02) | 5 (0.02) | 0 (0.00) |
| -splice consensus | 7 (0.05) | 4 (0.05) | 11 (0.05) | 1 (0.03) |
| All de novo indels | 9 (0.06) | 4 (0.05) | 13 (0.06) | 1 (0.03) |
| -no frameshift | 3 (0.02) | 1 (0.01) | 4 (0.02) | 0 (0.00) |
| -frameshift | 6 (0.04) | 3 (0.04) | 9 (0.04) | 1 (0.03) |
| All LOFs | 11 (0.08) | 9 (0.11) | 20 (0.09) | 1 (0.03) |
| All likely functional | 99 (0.68) | 51 (0.6) | 150 (0.65) | 13 (0.38) |
| Functional/syn ratio | 7.62 | 4.25 | 6 | 2.6 |
In the 146 Afrikaner probands, we observed 93 confirmed de novo exonic point mutations (92 SNVs and 1 dinucleotide substitution) and 9 confirmed de novo indel events (Table 1). Six of the indels result in protein truncations and 3 in single aminoacid deletions. Additional query of de novo SNVs located within the flanking intronic regions identified 3 that altered a canonical splice site (Table 1) and 7 that altered the consensus sequence flanking canonical splice sites (Methods). Overall, 73 of 146 patients (50%) carry at least one likely functional de novo event (non-syn, indel, splice site mutations). The point mutation rate in the captured coding sequence is 1.73 × 10⁻⁸ per base per generation, not significantly different than the one observed in our control sample. Moreover, we found no differences in the distribution or frequency of multiple de novo point mutations within individuals in cases versus controls (Supplementary Fig. 2). The 93 identified de novo point mutations included 80 non-syn changes and 13 syn changes. The non-syn/syn ratio of 6.15 is higher than neutral expectation (2.23) 9,10 (P = 1.92 × 10⁻⁴, two-sided exact binomial test). To further assess the statistical significance of the observed enrichment of non-syn variants in cases, we performed permutation testing by randomly permuting the case/control labels of the trios in our dataset (Supplementary Note). Based on 100,000 such permuted datasets we obtain a permutation one-sided P = 0.033. By contrast, analysis of the enrichment of non-syn point mutations among private inherited variants (i.e. variants present only in one family and serving as proxy for evolutionarily young mutation events) did not reveal any significant differences in cases versus controls (Supplementary Table 3). Indeed, de novo variants are ~3.7 times more likely than rare inherited variants to harbor non-syn changes in cases (P < 0.0001, chi-square test) but not in controls (P < 0.77). In addition to non-syn events, we observed a 2.6-fold enrichment when comparing the rate of de novo events that almost certainly lead to loss-of-function (LOF; nonsense, frameshift indels and canonical splice site mutations) in cases (11/146; 7.5%) versus controls (1/34; 2.9%). Overall, using permutation testing we found a significant enrichment of likely functional de novo variants over syn ones in Afrikaner cases versus controls (permutation one-sided P = 0.017) (Table 1 and Supplementary Note).
Analysis of the US cohort revealed a point mutation rate of 1.73 × 10⁻⁸ per base per generation, similar to the Afrikaner cases (Table 1). The non-syn/syn ratio of 3.42 (Table 1) is higher than neutral expectation (2.23) 9,10 but the difference is not statistically significant. In addition to the smaller size, this is likely due to higher uncertainty in family history status in the US cohort, which may not be entirely depleted of familial cases, consistent with a lower de novo CNV rate4 as compared to the Afrikaner cohort3. By contrast, when comparing the rate of LOF de novo events per patient (8/85; 9.4%) we observed a 3.2-fold enrichment, similar to the one observed in the Afrikaner sample.
In the combined sample of 231 affected families the non-syn/syn ratio (4.84, Table 1) remained higher compared to neutral expectation9 (P = 2.1 × 10⁻⁴, two-sided exact binomial test). There was a differential enrichment of non-syn events between de novo and rare private inherited events (P < 0.0001). Notably, as in both individual cohorts, the LOF events per affected trio (20/231; 8.7%) was 2.8 times higher than in control trios (1/34, 2.9%) strongly supporting a role for gene-disrupting mutations (Tables 1, 2). Permutation testing revealed a significant enrichment of likely functional de novo variants over syn ones (permutation one-sided P = 0.026, Supplementary Note). We estimate that 46% of all likely functional de novo mutations identified represent genuine risk variants (Supplementary Note).
Table 2.
LOF mutations in schizophrenia probands
| ID | Schizophrenia Cohort | Mutation Type | Gene Symbol | LOF mutations in SA/SSC controls |
|---|---|---|---|---|
| trio_090 | US | frameshift | XPR1 | no |
| trio_107 | US | frameshift | CCDC39 | yes a |
| trio_121 | US | frameshift | KDM5C | yes a |
| trio_005 | SA | frameshift | KIAA0467 | no |
| trio_020 | SA | frameshift | HIST1H1E | no |
| trio_026 | SA | frameshift | RB1CC1 | no |
| trio_042 | SA | frameshift | ESAM | no |
| trio_092 | SA | frameshift | LAMA2 | no |
| trio_027 | SA | frameshift | DDHD2 | no |
| trio_101 | US | nonsense | SSBP3 | no |
| trio_118 | US | nonsense | NUP54 | no |
| trio_124 | US | nonsense | DPYD | no |
| trio_128 | US | nonsense | STAP2 | no |
| trio_053 | SA | nonsense | URB2 | no |
| trio_085 | SA | nonsense | RARG | no |
| trio_018 | SA | splice site b | SYNGAP1 | no |
| trio_072 | SA | splice site b | BRPF1 | no |
| trio_111 | US | splice site b | PRDX6 | no |
| trio_103 | US | splice site b | NLRC5 | no |
| trio_016 | SA | splice site b | CUGBP2 | no |
Considering phenotypic correlates, we observed a correlation between paternal age at proband’s birth and number of de novo events per offspring (Supplementary Fig. 3) but did not find any other significant differences (Supplementary Note and Supplementary Tables 4, 5).
Genes affected by de novo variants in our study were not significantly over-represented in two previously established comprehensive lists of synaptic genes (Supplementary Note). In addition, pathway analyses using the DAVID Annotation Tool did not find any significantly enriched functional clusters. Evaluation of protein-protein interactions (PPI) revealed a significantly greater connectivity among mutational targets than would be expected by chance (P < 0.05). Multigene PPI clusters included one centered on MTOR and one centered on CANX that includes extracellular matrix and cell adhesion proteins (Supplementary Fig. 4) suggesting that diverse schizophrenia risk genes may converge on a shorter list of functional modules.
We then examined to what extent the enrichment in functional de novo events is determined by the developmental pattern of brain expression of the mutated genes 14,15 (Supplementary Note and Supplementary Table 6). In both hippocampus (HPC) (Figure 1a and Supplementary Fig. 5) and dorsolateral prefrontal cortex (DLPFC) (Supplementary Fig. 6), two brain areas implicated in schizophrenia16, the highest effect size was observed for genes showing highest expression during the prenatal period (Figure 1a and Supplementary Fig. 6). Importantly, there is a functional correlation between prenatal expression bias of target genes and neurodevelopmental impact of the corresponding mutations. Specifically, among patients carrying de novo mutations, those with mutations in prenatally-biased genes are more likely to have had multiple (≥ 3) behavioral abnormalities in childhood (before the age of 10)17 as well as worse functional outcome following disease onset (Figure 1b and Supplementary Note). In addition, comparison of all genes with functional de novo events identified in our schizophrenia families (n = 145) with those identified in autism spectrum disorder (ASD) families (n = 675)10-13 revealed 15 shared genes (Figure 1c), an overlap within random expectation (P = 0.29, Supplementary Note). However, 11 of the 15 shared genes (73%) are included in the list of our prenatally-biased targets (Supplementary Table 7). The probability that this overlap arises by chance is very low (P = 0.004).
Figure 1. Enrichment of non-syn or functional de novo variants according to temporal expression profiles of targets genes.
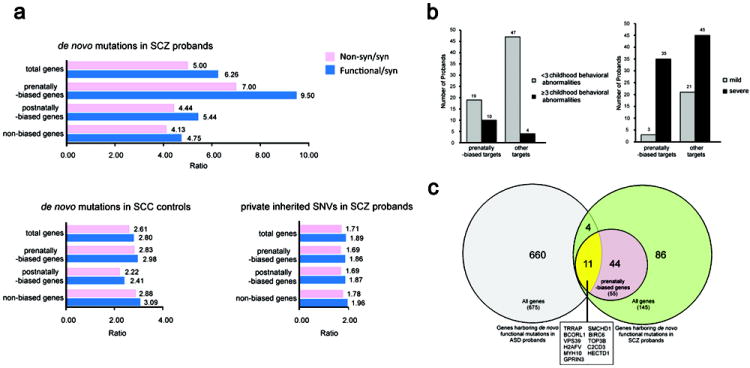
a. We grouped our target genes from the combined schizophrenia cohorts into three classes [prenatal brain expression biased (“prenatally-biased”), postnatal brain expression biased (“postnatally-biased”) and “non-biased”] according to their temporal trajectory in reference to a previously described global expression switch occurring before birth and determined the relative enrichment of non-syn or, more generally, functional de novo variants over syn ones. The relative enrichment in differentially regulated target genes is shown for de novo mutations in the Afrikaner and US probands (top) and the combined SSC control group (middle), as well as for private transmitted variants in Afrikaner and US probands (bottom). The non-syn/syn ratio for prenatally-biased genes was significantly higher than neutral expectation (2.23) (7, P = 0.004). In comparison, the corresponding values for postnatally-biased genes were 4.4 (P = 0.06), whereas for non-biased genes were 4.13 (P = 0.12). Similar analysis of de novo variants in the SSC control group or of private transmitted variants in Afrikaner and US probands showed no differential in the distribution of effect sizes in any of the temporal trajectories tested. ‘Non-syn’ refers to non-synonymous mutations (missense and nonsense SNVs); “functional” refers to non-syn, indel and splice site mutations. Indel data was not available for transmitted variants.
b. Left: An elevated frequency of patients who had multiple (≥ 3) childhood behavioral abnormalities (Supplementary Note) was found among carriers of de novo functional mutations in prenatally-biased genes (10 out of 29 compared to 4 out of 51 patients carrying mutations in genes with no fetal brain bias, 4.4-fold enrichment, P = 0.0047, Fisher’s exact test). Right: An elevated frequency of patients with severe disease functional outcome (Supplementary Note) was found among carriers of de novo functional mutations in prenatally-biased genes (35 out of 38 compared to 45 out of 66 patients carrying mutations in genes with no fetal brain bias, 1.35-fold enrichment, P = 0.007, Fisher’s exact test).
c. Venn diagrams depicting the overlap between either all target genes or only prenatally-biased genes harboring functional de novo mutations identified in the Afrikaner and US probands (n = 145) and those identified in ASD exome scans10-13 (n = 675).
The majority of prenatally-biased targets is highly expressed during the first and second trimester of pregnancy (Supplementary Fig. 7) and show an overrepresentation of nuclear genes involved in chromatin remodeling, nuclear transport and transcriptional control, as well as in protein translation and degradation (Supplementary Tables 6, 8). They also include genes involved in cell-cell and cell-matrix interactions, a subset of which interacts with two key adhesive proteins, THBS118 and ITGA619, involved in synaptogenesis, axonal growth and cortical layering (Supplementary Fig. 4). We confirmed that genes with prenatal expression bias are highly enriched in microRNA targets 15 (Supplementary Note) and also found a nominally significant enrichment of hsa-mir-367 and hsa-mir-1244 targets (Supplementary Tables 9, 10). By comparison, the risk conferred by postnatally-biased targets is related to their involvement in intracellular signaling processes (GTPase-, DAG-, or calcium-modulated signaling, Supplementary Table 8), which regulate diverse aspects of neuronal connectivity.
We next set out to evaluate which of the individual genes are more likely to confer disease risk. We found 4 genes altered by two de novo events each in unrelated probands (3 of these genes were affected in patients across the two different populations tested) (Table 3 and Supplementary Note). These genes were struck twice by a combination of a nonsense and a missense de novo SNV (DPYD), or a combination of a splice site mutation (Supplementary Tables 11, 12) with either a de novo missense SNV (TRRAP and VPS39) or indel (LAMA2). None of these genes were affected in the Afrikaner or the SSC control group and no such mutational combinations were reported for any gene among 488 de novo events in the SSC control group. Given the number of de novo mutations in our dataset, observation of four such recurrent events has a P-value of 0.002 (Supplementary Note) with one of the 4 combinations (in LAMA2) being individually statistically significant (P = 0.017).
Table 3.
Genes hit by recurrent de novo events
| Sample ID | Gene Symbol | Chr Locus | Mutation Type | DNA change | RNA/Amino acid change | Cohort | Gene Name |
|---|---|---|---|---|---|---|---|
| Genes hit by recurrent de novo SNVs/indels | |||||||
| trio_124 | DPYD | 1p21.3 | Nonsense | c.1863G>A | p.Trp621* | US | dihydropyrimidine dehydrogenase |
| trio_016 | DPYD | Missense | c.1615G>A | p.Gly539Arg | SA | ||
| trio_092 | LAMA2 | 6q22.13 | Frameshift | c.9139_9146del7 | p.Ser3050ThrfsX27 | SA | laminin, alpha 2 |
| trio_049 | LAMA2 | splice sitea | c.4718-3 | r.(spl?) | SA | ||
| trio_033 | TRRAP | 7q22.1 | Missense | c.883A>T | p.Ile295Phe | SA | transformation/transcription domain-associated protein |
| trio_099 | TRRAP | splice sitea | c.7223.+6 | r.(spl?) | US | ||
| trio_120 | VPS39 | 15q15.1 | Missense | c.2368C>T | p.Arg790Cys | SA | vacuolar protein sorting 39 homolog (S. cerevisiae) |
| trio_125 | VPS39 | splice sitea | c.441+8 | r.(spl?) | US | ||
| Genes hit by both de novo SNVs and de novo CNVs | |||||||
| trio_091 | DGCR2 | 22q11.2 | Missense | c.1163C>G | p.Pro388Arg | SA | DiGeorge syndrome critical region gene 2 |
| DGCR2 | CNV(del)b | SA | |||||
| trio_064 | TOP3B | 22q11.2 | Missense | c.1415G>A | p.Arg472Gln | SA | topoisomerase (DNA) III beta |
| TOP3B | CNV (del) | SA | |||||
| trio_121 | CIT | 12q24.23 | Missense | c.238T>C | p.Tyr80His | US | citron (rho-interacting, serine/threonine kinase 21) |
| CIT | CNV (dupc)b | SA | |||||
| trio_111 | STAG1 | 3q22.3 | Missense | c.667A>T | p.Thr223Ser | US | stromal antigen 1 |
| STAG1 | CNV (del)b | SA | |||||
| trio_078 | SMAP2 | 1p34.2 | Missense | c.896G>A | p.Ser299Asn | SA | small ArfGAP2 |
| SMAP2 | CNV (dup)b | SA | |||||
Consensus splice site mutation. Mutations in LAMA2 and TRRAP are predicted to be damaging (Supplementary Tables 11, 12).
Ref 3
Intragenic duplication
SA = Afrikaner
LAMA2 encodes the laminin alpha 2 chain, which constitutes one of the subunits of laminin 2 and 4 and binds to ITGA6, a prenatally-biased target (Supplementary Fig. 4). The indel in LAMA2 disrupts a critical C-terminal domain, while the splice mutation affects a highly conserved nucleotide at -1 position adjacent to the canonical splice acceptor AG motif and is expected to disrupt splicing (Supplementary Table 12). Homozygous mutations in LAMA2 lead with variable penetrance to congenital muscular dystrophy characterized by CNS involvement, including white matter abnormalities, cognitive impairment, seizures and neuronal migration defects20. In addition, a de novo mutation in the isoform LAMA1 was described in another schizophrenia cohort6.
DPYD (Dihydropyrimidine dehydrogenase) is the initial and rate-limiting factor in the pathway of pyrimidine catabolism21 and also modulates production of beta-alanine, a neuromodulator of inhibitory transmission in the brain22. We identified one missense and one nonsense SNV in the Afrikaner and US cohort, respectively. Abnormal urinary excretion of thymine and uracil confirmed DPYD deficiency in the missense mutation carrier (Supplementary Fig. 8). Heterozygous deletions either encompassing or within DPYD, as well as altered expression23 have been described in ASD24 and intellectual disability (ID)25. Neither autistic features nor ID were present in our DPYD mutation carriers suggesting variable expressivity. A GWAS mega-analysis in schizophrenia identified the strongest association (P = 1.6 × 10⁻¹¹) at rs1625579, a variant located at 1p21.3, in the intron of MIR13726 and within a haplotypic block (D’ > 0.9) that extends to the 5’ of DPYD (Supplementary Fig. 9). We did not find mutations in MIR137 and therefore association with rs1625579 may reflect contribution of DPYD variants.
The splice mutation in TRAPP2 affects position +6 to the splice junction site and is predicted to disrupt splicing and binding of SRP55 splicing factor within a splicing enhancer. Notably, TRRAP and VPS39 are also mutated in ASD cases12.
We also compared the identified functional de novo mutations to the de novo CNVs identified previously in our two cohorts (22 CNVs affecting 156 genes)3,4. Five genes (DGCR2, TOP3B, CIT, STAG1 and SMAP2) were altered by both de novo SNVs and CNVs (Table 3), two of them in patients across the two different populations tested. Two of these genes are within the 22q11.2 schizophrenia susceptibility locus.
Our findings implicate a contribution from a diverse set of de novo mutations of relatively high but incomplete penetrance to the genomic architecture of schizophrenia in the context of a mutation-selection balance model and highlight the importance of using family samples where disease history has been thoroughly ascertained to illuminate their role. In that respect, focusing on our comprehensively ascertained Afrikaner cohort we estimate that at least 17.6% of sporadic cases carry a de novo pathogenic exonic mutation (Supplementary Note) and at least 9.9% carry a de novo CNV3. Thus, such mutations account for ~ 1/4 to 1/3 of all sporadic cases. Given that results from scans of non-exonic regions are still forthcoming, this is likely an underestimate. Equally important is the contribution of our findings toward understanding the neural architecture of schizophrenia risk. Given that we estimate the number of schizophrenia-risk loci to more than 850 (Supplementary Note), our findings unveil an exquisite sensitivity of the neural circuits underlying susceptibility to schizophrenia to precise levels or activity of many diverse proteins and signaling modules and suggest that focusing on circuits may be more commensurate with the heterogeneity of schizophrenia than other proposed mechanisms that concentrate on specific neurotransmitters or cell-types27. In addition, we show that in determining disease risk not only the function of the target gene but also the timing of the genetic insult is of critical importance. Specifically, although de novo mutations affect genes with diverse functions and developmental profiles, we describe a substantial contribution of mutations in developmentally regulated genes with higher expression during early- and mid-fetal life and show that such mutations are enriched among adult patients with prominent early, pre-psychotic, deviant behaviors. Our findings provide a mechanistic context to interpret epidemiological correlations among various prenatal environmental insults during the first and second trimester of pregnancy and risk for schizophrenia28. Moreover, the fact that expression of many prenatally-biased genes is under strict microRNA control may explain emerging links between microRNA dysregulation and psychiatric disorders29. The challenge remains to identify the affected biological processes and neural circuits and determine how they are affected. Unbiased network-based approaches as well as animal and cellular models of recurrent mutations will be invaluable toward this goal30.
METHODS
Cohorts
The samples analyzed here comprise of trios collected from two distinct populations, the Afrikaner population from South Africa (European, mostly Dutch descent) (146 schizophrenia trios) and the U.S. population (Northern European descent) (85 schizophrenia trios). Of the 146 Afrikaner probands, 122 (83.6%) had a diagnosis of schizophrenia and 24 (16.4%) were diagnosed with SCZAFF disorder. Of the 85 U.S. probands, 46 (54.1%) had a diagnosis of schizophrenia, and 39 (45.9%) were diagnosed with SCZAFF disorder. The control cohort consisted of 34 trios with established Afrikaner heritage. Control families included unaffected subjects screened against presence and history of treatment for any psychiatric condition, as well as history of mental illness in 1st- or 2nd-degree relatives. Both affected and control trios were recruited and characterized in the context of our ongoing, large-scale genetic studies of schizophrenia and have been described previously3,7,8. Because de novo mutations are more likely to account for sporadic forms of the disease, we took great care to determine reliably and in-depth the family history status and generate cohorts enriched in sporadic cases (Supplementary Note). However, negative or positive family history was not a screening criterion.
In the Afrikaner cohort it was possible to determine absence of disease in 1st- or 2nd-degree relatives due to the cohesive family structure, the large catchment area and long-term care provided by the local recruiting hospital that affords detailed hospital records over several generations3,8. In the geographically fragmented and ethnically diverse U.S. cohort we were able to determine absence of disease in 1st-degree relatives only (Supplementary Note). For additional cohort characteristics, see Supplementary Note. Informed consent was obtained from all participants and the Institutional Review Committees of Columbia University and University of Pretoria approved all procedures. Paternity and maternity were confirmed prior to sequencing via the Affymetrix Genome-Wide Human SNP Array 5.0 as well as via a panel of microsatellite markers. DNA for all study subjects was extracted from whole blood and analysis was performed blind to affected status while maintaining knowledge of the parent-child relations.
Exome library construction
Exome capture and sequencing was performed using the following methods: Genomic DNA (~3 μg) was sheared to 200–300 bp using a Covaris Acoustic Adaptor. Fragments were end-repaired, dA-tailed, and sequencing adaptor oligonucleotides ligated using reagents from New England BioLabs. Libraries were barcoded using the Illumina index read strategy, which uses six-base sequences within the adapter that are sequenced separately from the genomic DNA insert. Ligated products were size-selected during purification steps. The DNA library was subsequently enriched for sequences with 5’ and 3’ adapters by PCR amplification using primers complementary to the adapter sequences (ligation-mediated PCR, LM-PCR). Exonic DNA was captured using two hybridization systems: Aligent SureSelect v2 (n = 85 trios) and NimbleGen SeqCap EZ v2 (n = 180 trios). Following capture, another round of LM-PCR was performed to generate the final library. Each library was quantitated by fluorescent methods (PicoGreen) and fragment sizes measured with the Agilent Bioanalyzer. Finally, the molar concentration of each library was measured using the size information from the Agilent Bioanalyzer and DNA quantitation information from a real-time PCR assay (Kapa Biosystems per manufacturer’s protocol). Each library was normalized to 10 nM and sequenced using an IlluminaHiSeq2000.
Exome data analysis for de novo SNVs and indels
The exome data analysis pipeline has been described previously7. Briefly, raw sequencing data were mapped to the human reference genome (build hg19) using the Burrows-Wheeler Aligner (BWA v0.5.81536). The Genome Analysis Toolkit (GATK, version 5091) was used to remove duplicates, perform local realignment and map quality score recalibration to produce a “cleaned” BAM file and then make genotype calls for all trios jointly. The resulting Variant Call Format (VCF, version 4.0) files were annotated using the GenomicAnnotator module in GATK to identify and label the called variants that are within the targeted coding regions and overlap with known and likely benign SNPs reported in dbSNP v132 (see URLs). The filtered genotype calls were further validated using the mpileup module in the SAMtools (see URLs) as described previously7. Indel calls were made by the Dindel software using one “cleaned” BAM file per run. The resulting VCF files were further revalidated using the same SAMtools procedure described above for point mutations. To determine potential mutations at splice-donor or acceptor sites, GATK variant calls were made in a batch fashion (90 samples per batch) that covered each target coding region and 50 bp flanking segments in each direction. The variants in the resulting VCF files were annotated according to refGene-big-table-hg19.txt (see URLs). A variant was annotated as a “canonical splice site mutation” if it disrupted the largely invariable core canonical 2-base-pair acceptor (AG) or donor (GU) sites. De novo variants within 10 bp surrounding the exon-intron boundary, included in the consensus sequence flanking core canonical splice sites and therefore likely to modulate splicing efficiency, were annotated as “consensus splice site mutations”. Candidate de novo variants were tested using standard Sanger sequencing on an ABI 3730xl DNA Analyzer to validate presence of each mutation in the subject and absence in the parental genomes, by designing custom primers (Primer3) based on ~500 bp of sequence flanking each variant. The total number of de novo SNVs found and validated in a given cohort was divided by the total bases analyzed to calculate a per-base rate of point mutations in the captured coding sequence.
Variant detection pipeline and QC
Because the whole capture and sequencing procedure was conducted blindly to the affected status for all three cohorts, we expected no bias among cohorts. To further demonstrate that variant detection and QC are consistent across all samples and all experimental conditions, we compared percentage of average reads at 1X, 8X, 20X and 30X for these conditions. The comparison is shown in Supplementary Fig. 1. There were no differences for any of these parameters.
Statistics
The two-sided exact binomial test was conducted using R. Fisher’s exact test or chi-square test with Yates’ correction was used for the analysis of contingency tables, depending on the sample sizes, using R.
Annotation of the functional impact of the de novo mutations
The functional impact of the de novo mutations was annotated from several different resources. The PolyPhen-231 (see URLs) online batch query server was used with the full annotation settings to determine the non-syn or syn nature of the mutations and predict their functional impact by further classifying them as non-tolerated (damaging) or benign at a given site. The Grantham score for each coding variant was determined by the Grantham matrix table32. The phyloP score for each coding variant was extracted from the “phyloP46wayAll” table in the UCSC Table Browser (see URLs). Regarding splice site variants, we consider mutations directly disrupting canonical splice sites as severe disruptive events without further analysis. For mutations in consensus splice sites, we used a mutation analysis module in Human Splice Finder program (HSF, Version 2.4.1, see URLs)33, to predict their functional impact. Briefly, 100 nucleotides sequence surrounding the exon-intron boundary was extracted from the UCSC browser and the wild-type and mutated sequences were imported into HSF mutation analysis module to detect potential disruption of splicing signals. Supplementary Tables 11, 12 show the HSF-derived results for the identified consensus splice site mutations.
Gene set enrichment analysis and protein-protein interaction network analyses
The DAVID Functional Annotation Chart34 (see URLs) was used to assess whether a given gene set with de novo mutations was enriched in particular GO terms or functional keywords defined in Swiss-Prot (SP) and Protein Information Resource (PIR). Target genes were mapped in the database and functional annotation chart analysis was conducted with the default settings. We used the Disease Association Protein–protein Link Evaluator (DAPPLE)35 to determine if there was excess protein–protein interaction among the genes hit by likely functional de novo variants. A list of all target genes with likely functional altered mutations was submitted to the DAPPLE server (see URLs) with default settings.
Temporal expression profile analysis of the genes carrying de novo mutations
To investigate developmental expression of target genes we took advantage of the Human Brain Transcriptome (HBT) database (see URLs), a compendium of exon-level expression profiles across developmental stages from embryonic to late adulthood14. Genes harboring de novo events were grouped into three classes (prenatal brain-biased, postnatal brain-biased and non-biased) according to their temporal trajectory in reference to a global expression turning point occurring between mid–late and late fetal stage14. For each class, the ratio of non-syn or likely functional variants to neutral ones was calculated.
Supplementary Material
Acknowledgments
We are enormously grateful to all the families who participated in this research. We thank H. Pretorius and nursing sisters R. van Wyk, C. Botha and H. van den Berg for their assistance with subject recruitment, family history assessments and diagnostic evaluations. We thank S. Laura Lundy for valuable assistance with clinical database maintenance and Laura Rodriguez-Murillo for help with Supplementary Fig. 9. We also wish to thank Brooks Plummer and Melanie Robinson and the HudsonAlpha Genomics Services Laboratory for experimental support. Finally, we thank Prof. Mienie for the thymine loading test. This work was partially supported by National Institute of Mental Health (NIMH) grants MH061399 (to M.K.) and MH077235 (to J.A.G.) and the Lieber Center for Schizophrenia Research at Columbia University. BX was partially supported by a NARSAD Young Investigator Award.
Footnotes
AUTHOR CONTRIBUTIONS
BX, JAG and MK designed the study, interpreted the data and prepared the manuscript; BX developed the analysis pipeline and had the primary role in analysis and validation of sequence data; II-L performed statistical analysis of the sequence data; JLR contributed to sample collection and clinical characterization; SW and YS contributed to sample preparation and de novo mutation validation; BB performed exome library construction, capture, sequencing and initial analysis of SNV genotyping and indel variant calls; SL supervised the sequencing project at HudsonAlpha Institute.
COMPETING FINANCIAL INTERESTS
The authors declare no competing financial interests.
URLs
dbSNP132, ftp://ftp.ncbi.nlm.nih.gov/snp/organisms/human_9606/VCF/v4.0/00-All.vcf.gz;
SAMtools, http://samtools.sourceforge.net/;
refGene-big-table-hg19.txt, ftp://gatk-ftp:PH5UH7Pa@ftp.broadinstitute.org/refGene/refGene-big-table-hg19.txt.gz;
PolyPhen-2, http://genetics.bwh.harvard.edu/pph2/;
UCSC Table Browser, http://genome.ucsc.edu/cgi-bin/hgTables;
HSF, Version 2.4.1, http://www.umd.be/HSF;
DAVID Functional Annotation Server, http://david.abcc.ncifcrf.gov/;
DAPPLE, http://www.broadinstitute.org/mpg/dapple/;
HBT, http://hbatlas.org/
Data Access
Data is available upon request.
References
- 1.Rodriguez-Murillo L, Gogos JA, Karayiorgou M. The genetic architecture of schizophrenia: new mutations and emerging paradigms. Annu Rev Med. 2012;63:63–80. doi: 10.1146/annurev-med-072010-091100. [DOI] [PubMed] [Google Scholar]
- 2.Karayiorgou M, et al. Schizophrenia susceptibility associated with interstitial deletions of chromosome 22q11. Proc Natl Acad Sci U S A. 1995;92:7612–6. doi: 10.1073/pnas.92.17.7612. [DOI] [PMC free article] [PubMed] [Google Scholar]
- 3.Xu B, et al. Strong association of de novo copy number mutations with sporadic schizophrenia. Nat Genet. 2008;40:880–5. doi: 10.1038/ng.162. [DOI] [PubMed] [Google Scholar]
- 4.Malhotra D, et al. High frequencies of de novo CNVs in bipolar disorder and schizophrenia. Neuron. 2011;72:951–63. doi: 10.1016/j.neuron.2011.11.007. [DOI] [PMC free article] [PubMed] [Google Scholar]
- 5.Kirov G, et al. De novo CNV analysis implicates specific abnormalities of postsynaptic signalling complexes in the pathogenesis of schizophrenia. Mol Psychiatry. 2012;17:142–53. doi: 10.1038/mp.2011.154. [DOI] [PMC free article] [PubMed] [Google Scholar]
- 6.Girard SL, et al. Increased exonic de novo mutation rate in individuals with schizophrenia. Nat Genet. 2011;43:860–3. doi: 10.1038/ng.886. [DOI] [PubMed] [Google Scholar]
- 7.Xu B, et al. Exome sequencing supports a de novo mutational paradigm for schizophrenia. Nat Genet. 2011;43:864–8. doi: 10.1038/ng.902. [DOI] [PMC free article] [PubMed] [Google Scholar]
- 8.Xu B, et al. Elucidating the genetic architecture of familial schizophrenia using rare copy number variant and linkage scans. Proc Natl Acad Sci U S A. 2009;106:16746–51. doi: 10.1073/pnas.0908584106. [DOI] [PMC free article] [PubMed] [Google Scholar]
- 9.Kryukov GV, Pennacchio LA, Sunyaev SR. Most rare missense alleles are deleterious in humans: implications for complex disease and association studies. Am J Hum Genet. 2007;80:727–39. doi: 10.1086/513473. [DOI] [PMC free article] [PubMed] [Google Scholar]
- 10.Neale BM, et al. Patterns and rates of exonic de novo mutations in autism spectrum disorders. Nature. 2012;485:242–5. doi: 10.1038/nature11011. [DOI] [PMC free article] [PubMed] [Google Scholar]
- 11.Sanders SJ, et al. De novo mutations revealed by whole-exome sequencing are strongly associated with autism. Nature. 2012;485:237–41. doi: 10.1038/nature10945. [DOI] [PMC free article] [PubMed] [Google Scholar]
- 12.O’Roak BJ, et al. Sporadic autism exomes reveal a highly interconnected protein network of de novo mutations. Nature. 2012;485:246–50. doi: 10.1038/nature10989. [DOI] [PMC free article] [PubMed] [Google Scholar]
- 13.Iossifov I, et al. De novo gene disruptions in children on the autistic spectrum. Neuron. 2012;74:285–99. doi: 10.1016/j.neuron.2012.04.009. [DOI] [PMC free article] [PubMed] [Google Scholar]
- 14.Kang HJ, et al. Spatio-temporal transcriptome of the human brain. Nature. 2011;478:483–9. doi: 10.1038/nature10523. [DOI] [PMC free article] [PubMed] [Google Scholar]
- 15.Colantuoni C, et al. Temporal dynamics and genetic control of transcription in the human prefrontal cortex. Nature. 2011;478:519–23. doi: 10.1038/nature10524. [DOI] [PMC free article] [PubMed] [Google Scholar]
- 16.Barch DM, Ceaser A. Cognition in schizophrenia: core psychological and neural mechanisms. Trends Cogn Sci. 2012;16:27–34. doi: 10.1016/j.tics.2011.11.015. [DOI] [PMC free article] [PubMed] [Google Scholar]
- 17.Sobin C, Roos JL, Pretorius H, Lundy LS, Karayiorgou M. A comparison study of early non-psychotic deviant behavior in Afrikaner and US patients with schizophrenia or schizoaffective disorder. Psychiatry Res. 2003;117:113–25. doi: 10.1016/s0165-1781(02)00321-9. [DOI] [PMC free article] [PubMed] [Google Scholar]
- 18.Christopherson KS, et al. Thrombospondins are astrocyte-secreted proteins that promote CNS synaptogenesis. Cell. 2005;120:421–33. doi: 10.1016/j.cell.2004.12.020. [DOI] [PubMed] [Google Scholar]
- 19.Georges-Labouesse E, Mark M, Messaddeq N, Gansmuller A. Essential role of alpha 6 integrins in cortical and retinal lamination. Curr Biol. 1998;8:983–6. doi: 10.1016/s0960-9822(98)70402-6. [DOI] [PubMed] [Google Scholar]
- 20.Jones KJ, et al. The expanding phenotype of laminin alpha2 chain (merosin) abnormalities: case series and review. J Med Genet. 2001;38:649–57. doi: 10.1136/jmg.38.10.649. [DOI] [PMC free article] [PubMed] [Google Scholar]
- 21.Van Kuilenburg AB, et al. Genotype and phenotype in patients with dihydropyrimidine dehydrogenase deficiency. Hum Genet. 1999;104:1–9. doi: 10.1007/pl00008711. [DOI] [PubMed] [Google Scholar]
- 22.Tiedje KE, Stevens K, Barnes S, Weaver DF. Beta-alanine as a small molecule neurotransmitter. Neurochem Int. 2010;57:177–88. doi: 10.1016/j.neuint.2010.06.001. [DOI] [PubMed] [Google Scholar]
- 23.Ben-David E, et al. Identification of a functional rare variant in autism using genome-wide screen for monoallelic expression. Hum Mol Genet. 2011;20:3632–41. doi: 10.1093/hmg/ddr283. [DOI] [PubMed] [Google Scholar]
- 24.Carter MT, et al. Hemizygous deletions on chromosome 1p21.3 involving the DPYD gene in individuals with autism spectrum disorder. Clin Genet. 2011;80:435–43. doi: 10.1111/j.1399-0004.2010.01578.x. [DOI] [PubMed] [Google Scholar]
- 25.Willemsen MH, et al. Chromosome 1p21.3 microdeletions comprising DPYD and MIR137 are associated with intellectual disability. J Med Genet. 2011;48:810–8. doi: 10.1136/jmedgenet-2011-100294. [DOI] [PubMed] [Google Scholar]
- 26.Ripke S, et al. Genome-wide association study identifies five new schizophrenia loci. Nat Genet. 2011;43:969–76. doi: 10.1038/ng.940. [DOI] [PMC free article] [PubMed] [Google Scholar]
- 27.Arguello PA, Gogos JA. Genetic and cognitive windows into circuit mechanisms of psychiatric disease. Trends Neurosci. 2012;35:3–13. doi: 10.1016/j.tins.2011.11.007. [DOI] [PubMed] [Google Scholar]
- 28.McGrath JJ, Susser ES. New directions in the epidemiology of schizophrenia. Med J Aust. 2009;190:S7–9. doi: 10.5694/j.1326-5377.2009.tb02366.x. [DOI] [PubMed] [Google Scholar]
- 29.Stark KL, et al. Altered brain microRNA biogenesis contributes to phenotypic deficits in a 22q11-deletion mouse model. Nat Genet. 2008;40:751–60. doi: 10.1038/ng.138. [DOI] [PubMed] [Google Scholar]
- 30.Karayiorgou M, Flint J, Gogos JA, Malenka RC. The best of times, the worst of times for psychiatric disease. Nat Neurosci. 2012;15:811–2. doi: 10.1038/nn.3115. [DOI] [PMC free article] [PubMed] [Google Scholar]
- 31.Adzhubei IA, et al. A method and server for predicting damaging missense mutations. Nat Methods. 2010;7:248–9. doi: 10.1038/nmeth0410-248. [DOI] [PMC free article] [PubMed] [Google Scholar]
- 32.Grantham R. Amino acid difference formula to help explain protein evolution. Science. 1974;185:862–4. doi: 10.1126/science.185.4154.862. [DOI] [PubMed] [Google Scholar]
- 33.Desmet FO, et al. Human Splicing Finder: an online bioinformatics tool to predict splicing signals. Nucleic Acids Res. 2009;37:e67. doi: 10.1093/nar/gkp215. [DOI] [PMC free article] [PubMed] [Google Scholar]
- 34.Huang da W, Sherman BT, Lempicki RA. Systematic and integrative analysis of large gene lists using DAVID bioinformatics resources. Nat Protoc. 2009;4:44–57. doi: 10.1038/nprot.2008.211. [DOI] [PubMed] [Google Scholar]
- 35.Rossin EJ, et al. Proteins encoded in genomic regions associated with immune-mediated disease physically interact and suggest underlying biology. PLoS Genet. 2011;7:e1001273. doi: 10.1371/journal.pgen.1001273. [DOI] [PMC free article] [PubMed] [Google Scholar]
Associated Data
This section collects any data citations, data availability statements, or supplementary materials included in this article.