

Using a protoplast-based promoter-activation system, this work identifies a MYB-like factor termed EOBI that is important in floral scent production. Direct interactions of EOBI with EOBII and of both proteins with ODO1 and structural phenylpropanoid scent-related genes allow tight regulation of scent throughout flower development.
Abstract
Flower scent is a highly dynamic trait, under developmental, spatial, and diurnal regulation. The mechanism governing scent production is only beginning to be unraveled. In petunia (Petunia hybrida), EMISSION OF BENZENOIDS II (EOBII) controls transcription of both the shikimate pathway-regulating MYB factor ODORANT1 (ODO1) and phenylpropanoid scent-related structural genes. A promoter-activation screen identified an R2R3-MYB–like regulatory factor of phenylpropanoid volatile biosynthesis acting downstream of EOBII, designated EOBI. EOBI silencing led to downregulation of ODO1 and numerous structural scent-related genes from both the shikimate and phenylpropanoid pathways. The ability of EOBI to directly activate ODO1, as revealed by electrophoretic mobility shift assay and yeast one-hybrid analysis, place EOBI upstream of ODO1 in regulating substrate availability for volatile biosynthesis. Interestingly, ODO1-silenced transgenic petunia flowers accumulated higher EOBI transcript levels than controls, suggesting a complex feedback loop between these regulatory factors. The accumulation pattern of EOBI transcript relative to EOBII and ODO1, and the effect of up/downregulation of EOBII on transcript levels of EOBI and ODO1, further support these factors' hierarchical relationships. The dependence of scent production on EOBI expression and its direct interaction with both regulatory and structural genes provide evidence for EOBI’s wide-ranging involvement in the production of floral volatiles.
INTRODUCTION
Floral scent is a complex trait determined by a combination of low molecular weight compounds (Knudsen et al., 2006; Colquhoun and Clark, 2011). These molecules serve as an airborne signal mediating plant–plant and plant–insect interactions, thereby impacting plant reproduction and fitness (Hoballah et al., 2005; Horiuchi et al., 2007; Goodrich and Raguso, 2009; Klahre et al., 2011; Pichersky and Lewinsohn, 2011). Plant volatiles are biosynthesized mainly through the terpenoid, fatty acid, and phenylpropanoid pathways (Croteau and Karp, 1991; Dudareva et al., 2004). Phe, the precursor of phenylpropanoid compounds, is biosynthesized via the shikimate pathway, which was recently shown to operate mainly through the arogenate route in planta (Maeda et al., 2010, 2011; Vogt, 2010; Dal Cin et al., 2011). Phe is converted through the action of l-Phe ammonia lyase (PAL) and subsequent enzymatic reaction into a vast array of volatile compounds (Dudareva et al., 2004; Guterman et al., 2006; Dexter et al., 2007; Koeduka et al., 2008; Hippauf et al., 2010; Vogt, 2010). Volatile phenylpropanoids include, among others, eugenol, isoeugenol, and vanillin, as well as C6-C1 benzenoids, such as benzaldehyde, benzyl alcohol, and methylbenzoate (Boatright et al., 2004; Long et al., 2009; Van Moerkercke et al., 2009). Another group of volatile phenylpropanoids derive from Phe via the action of phenylacetaldehyde synthase, resulting in phenylacetaldehyde and downstream volatiles (Kaminaga et al., 2006; Tieman et al., 2006; Farhi et al., 2010).
The role of transcriptional regulation in reprogramming metabolic processes during plant development and in response to biotic and abiotic cues has been recognized in several plant systems. Nevertheless, our limited knowledge of regulatory networks governing secondary metabolism, including that of scent production, comes mainly from studies on flavonoid biosynthesis (Koes et al., 2005; Schwinn et al., 2006; Schwachtje and Baldwin, 2008; Aharoni and Galili, 2011; Feller et al., 2011). In addition, involvement of transcriptional regulators in the biosynthesis of alkaloids, mainly in response to jasmonate (van der Fits and Memelink, 2000) and glucosinolates (Malitsky et al., 2008; Burow et al., 2010; Sønderby et al., 2010), was recently revealed. Despite the long concerted effort into studying carotenoid biosynthesis, one of the most important classes of plant metabolites, only one direct transcriptional regulator of the pathway has been revealed to date (Toledo-Ortiz et al., 2010).
The first regulator of scent production, ODORANT1 (ODO1), was identified using a genomic/transcriptomic approach. ODO1 was shown to regulate transcript levels of genes encoding shikimate pathway enzymes that, in turn, affected metabolic flow toward phenylpropanoid production (Verdonk et al., 2005). The importance of regulating flux toward phenylpropanoids was also demonstrated in petunia (Petunia hybrida) flowers overexpressing the Arabidopsis thaliana MYB factor PRODUCTION OF ANTHOCYANIN PIGMENT1 (PAP1) (Ben Zvi et al., 2008). Recently, MYB factor Ph MYB4, which suppresses production of p-coumaric acid–derived volatiles, such as eugenol and isoeugenol, through downregulation of genes encoding upstream cinnamate 4-hydroxylase, was identified (Colquhoun et al., 2011a). EMISSION OF BENZENOIDS II (EOBII), similar to PAP1 and in contrast with ODO1, has been shown to regulate the transcription of both shikimate pathway genes and genes directly involved in the biosynthesis of phenylpropanoid volatiles (Verdonk et al., 2005; Dare et al., 2008; Ben Zvi et al., 2008; Spitzer-Rimon et al., 2010; Zvi et al., 2012). While it has been recently suggested that EOBII may also have activities outside the scope of floral scent production (Colquhoun et al., 2011b), the epistatic relations between EOBII and ODO1 have been confirmed: EOBII binds directly to ODO1’s upstream regulatory sequence and transcriptionally activates its expression (Van Moerkercke et al., 2011).
In this article, using EOBII as the hound in a promoter-activation screen, we identified a downstream partner, designated EOBI, which regulates floral scent by directly modulating the expression of both ODO1 and phenylpropanoid structural scent-related genes. A model describing regulation of floral scent production based on the hierarchical interrelationship between petunia regulatory factors and their downstream targets is presented.
RESULTS
Identification of Scent-Related Factor EOBI by Promoter-Activation Screen in EOBII-Expressing Protoplasts
We tested the relevance to floral scent production of a collection of putative regulatory factors isolated from petunia flowers using the virus-induced gene silencing system. In addition to the previously characterized EOBII, several candidates that affected floral scent emission were identified. Whereas suppression of EOBI led to decreased floral scent production, downregulation of EOBIII and EOBV led to increases in the levels of emitted volatiles (see Supplemental Figure 1 online). To identify putative scent-related regulatory factors affected by EOBII, we employed a protoplast-based system: We coinfected protoplasts expressing EOBII with promoter sequences of candidate scent-related factors fused to autofluorescent reporter genes. Discosoma sp fluorescent protein (DsRed) signal, indicative of promoter activation by EOBII, was generated in protoplasts cotransformed with the promoter region of the sequence termed EOBI fused to DsRed (EOBIpro:DsRed) and EOBII under the control of the 35S promoter (35Spro:EOBII) (Figures 1Aa to 1Ac). Control protoplasts cotransformed with unrelated MYB factor MYBYS driven by the 35S promoter (35Spro:MYBYS; Leitner-Dagan et al., 2006) or cyan fluorescent protein (CFP; 35Spro:CFP) instead of 35Spro:EOBII and EOBIpro:DsRed did not yield DsRed fluorescent signal (Figures 1Ag to 1Al). The ability of EOBI to activate the EOBII promoter was also tested: No DsRed fluorescence was detected in protoplasts cotransformed with EOBI driven by the 35S promoter (35Spro:EOBI) and the DsRed gene driven by the EOBII promoter (EOBIIpro:DsRed) (Figures 1Ad to 1Af). Overexpression of EOBII in flowers infiltrated with Agrobacterium tumefaciens carrying 35Spro:EOBII also led to increased levels of EOBI transcript (see Supplemental Figure 2 online), further establishing the capacity of EOBII to activate EOBI expression.
EOBI promoter contains a potential consensus MYB binding sequence (CTAACT; Sablowski et al., 1994) 1193 nucleotides upstream of the transcriptional start point. To assay the interaction between EOBII and EOBI promoter, an electrophoretic mobility shift assay (EMSA) was employed using the candidate MYB binding sequence as the probe. To analyze formation of protein-DNA complex, EOBII recombinant protein (fused to maltose binding protein [MBP]) was incubated with a labeled EOBI promoter fragment with or without competitor DNA. Gel shift assays (Figure 1B) showed that EOBII recombinant protein can interact with the EOBI promoter. The unlabeled EOBI promoter fragment was able to compete with the labeled EOBI fragment for EOBII binding, and the mobility shift was not seen in control reactions lacking EOBII, indicating a specific interaction between EOBII and EOBI promoter.
Figure 1.

EOBII Interacts with the EOBI Promoter.
(A) Petunia protoplasts were cotransformed with 35S-driven EOBII (35Spro:EOBII) and DsRed driven by the petunia EOBI promoter (EOBIpro:DsRed) ([a] to [c]) or with 35S-driven EOBI (35Spro:EOBI) and DsRed driven by the petunia EOBII promoter (EOBIIpro:DsRed) ([d] to [f]). As controls, protoplasts were cotransformed with EOBIpro:DsRed and cucumber (Cucumis sativus) MYBYS driven by the 35S promoter (35Spro:MYBYS) ([g] to [i]) or 35Spro:CFP ([j] to [l]). CFP, DsRed, and bright-field images are shown in the top ([a], [d], [g], and [j]), middle ([b], [e], [h], and [k]), and bottom ([c], [f], [i], and [l]) panels, respectively. Bar = 50 μm.
(B) EMSA of EOBI promoter fragment in the presence of EOBII. Biotinylated EOBI promoter fragment containing the putative MYB binding domain (CTAACT; Sablowski et al., 1994) was used as the probe. MBP was used as a control protein. Black arrow indicates protein-DNA complexes. White arrow shows the position of the free probe (bottom left). In the lane with competitor DNA, + indicates 1000× molar excess of nonlabeled probe.
To further establish the interplay between EOBI and EOBII, petunia (W115) transgenic lines with RNA interference (RNAi)–suppressed EOBII were generated and the effect of EOBII suppression on the expression levels of EOBI and other floral scent-related genes was examined. EOBII transcript levels were reduced by 70 to 80% in flowers of independent EOBII-RNAi transgenic lines 74 and 77 compared with that in control 35Spro:GUS (for β-glucuronidase) transgenic lines (Figure 2A). As expected based on the results generated using virus-induced gene silencing–suppressed EOBII flowers (Spitzer-Rimon et al., 2010), transcript levels of ISOEUGENOL SYNTHASE (IGS) and ODO1 were significantly downregulated in these EOBII-RNAi lines (Figures 2B and 2C). EOBI transcript also accumulated to lower levels in flowers of these EOBII-RNAi transgenic lines compared with control flowers (Figure 2D).
Figure 2.

EOBII Silencing Results in EOBI Downregulation.
Quantitative real-time PCR analysis of EOBII, IGS, ODO1, and EOBI transcript levels in two independent lines (74 and 77) of EOBII-RNAi–silenced petunia corollas 1 d after anthesis compared with control 35Spro:GUS transgenic corollas (c). Presented data (three biological replicates, each consisting of three technical repeats) were normalized to those from control corollas with se indicated by vertical lines. Significance of differences (P ≤ 0.05) between treatments and control (asterisks) were calculated using Dunnett’s method following analysis of variance (ANOVA) based on the raw transcript levels’ data normalized to Actin.
EOBI Is a Nuclear-Localized Flower-Specific R2R3-MYB Factor
EOBI expression was analyzed in various organs of petunia, in flowers at different stages of development, and at various time points during the day and night by real-time RT-PCR (Figure 3). EOBI expression was detected exclusively in flower organs, with the highest levels in flower limbs. The transcript was also detected in the pistil and flower tube and to a very low extent in the stamens. Expression of EOBI was not detected in the sepals or in any vegetative tissue (e.g., roots, stems, or leaves) (Figure 3A). The level of EOBI transcript in the limbs increased with flower development, reaching maximal levels at anthesis (Figure 3B). The diurnal expression pattern of EOBI in the limbs, monitored for three consecutive days following anthesis, was found to be rhythmic, with transcript reaching its highest levels during the day (Figure 3C).
Figure 3.

Spatial, Developmental, and Temporal Regulation of EOBI Transcript Levels.
Petunia line P720 RNA was extracted from different organs (A), corollas at different developmental stages (B), and corollas at different time points during the day/night (C) for three consecutive days (starting at anthesis at 06:00). EOBI transcript levels were determined by quantitative real-time PCR analysis using Actin as the reference. Graphs represent the average of three to five biological replicates (each consisting of three technical repeats) with se indicated by vertical lines. Black part of horizontal bar in (C) indicates nighttime hours. fl, flower limb; ft, flower tube.
To establish the pattern of EOBI promoter activity, we coinfiltrated petunia leaves and flowers (buds and mature flowers) with Agrobacterium harboring EOBIpro:DsRed and 35Spro:YFP (for yellow fluorescent protein; used as a reference) binary constructs (Figure 4A). Transient expression of EOBI-driven DsRed was detected in petals of both buds and mature flowers (Figures 4Aa to 4Ac and 4Ag to 4Ai) but not in leaves (Figures 4Am to 4Ao). YFP expression driven by 35S was detected, as expected, in all examined tissues (Figures 4Ab, 4Ah, and 4An). The pattern of EOBI promoter activity was compared with that of the scent biosynthetic gene IGS, whose promoter sequence has been published (Spitzer-Rimon et al., 2010) and, similar to EOBI, is affected by EOBII. The spatial pattern of IGS promoter activity was identical to that of EOBI promoter, as revealed by infiltration of petunia leaves (Figures 4Ap to 4Ar) and flowers (Figures 4Ad to 4Af and 4Aj to 4Al) with Agrobacterium harboring IGSpro:DsRed.
Figure 4.

EOBI Promoter Activity and Intracellular Localization.
(A) EOBI and IGS promoter activity in petunia buds ([a] to [f]), flowers 2 d after anthesis ([g] to [l]), and leaves ([m] to [r]) 36 h after infiltration with agrobacteria carrying EOBIpro:DsRed or IGSpro:DsRed; in both cases, infiltration was performed together with agrobacteria carrying 35Spro:YFP as a control. Fluorescence images were analyzed using DsRed filter ([a], [d], [g], [j], [m], and [p]), YFP filter ([b], [e], [h], [k], [n], and [q]), or bright field (c, f, i, l, o, and r). Bars = 2 mm.
(B) Nuclear localization of EOBI. (a) Localization of the EOBI:GFP fusion protein in N. benthamiana leaf epidermis; (b) nucleus stained with 4′,6-diamidino-2-phenylindole; (c) bright field; (d) and (e) fluorescence of nonfused GFP used as a control and bright field of leaf epidermis, respectively. Bars = 20 μm.
[See online article for color version of this figure.]
EOBI cDNA contains an open reading frame (ORF) with a conserved R2R3 binding domain (important for interaction with promoter elements; Kranz et al., 1998; Dubos et al., 2010) near its N terminus and a W/Y-MDDIW motif (of major importance for transactivation; Li et al., 2006) at its C terminus (Figure 5A). Based on the motifs outside the DNA binding R2R3, EOBI is clustered into subgroup 19 of the R2R3-MYB transcription factors (Figure 5B; Dubos et al., 2010). It shares homology with other subgroup 19 members, such as Arabidopsis MYB21, MYB24, pea (Pisum sativum) MYB26, petunia EOBII, Nicotiana langsdorffii × Nicotiana sanderae MYB305, and snapdragon (Antirrhinum majus) MYB305, showing highest phylogenetic similarity to the latter (Figure 5B). Members of this subgroup have been shown to be predominantly expressed in their respective flowers and involved in regulation of the phenylpropanoid pathway (Sablowski et al., 1994; Moyano et al., 1996; Uimari and Strommer, 1997; Shin et al., 2002; Li et al., 2006). Members of subgroup 20, which is relatively close to subgroup 19, such as Arabidopsis MYB108, MYB62, and MYB2, are involved in regulating hormonal homeostasis and flower development (Devaiah et al., 2009; Mandaokar and Browse, 2009; Guo and Gan, 2011). Petunia ODO1, distant from EOBI, clusters with Arabidopsis MYB42 and MYB85, factors that are involved in the regulation of secondary wall biosynthesis. Negative regulators of floral scent production, such as petunia EOBIII (also termed Ph MYB4; Colquhoun et al., 2011a) and EOBV, cluster to subgroup 4 together with MYB4 and MYB32 from Arabidopsis and MYB308 and MYB330 from snapdragon, previously characterized as negative regulators of the phenylpropanoid pathway (Tamagnone et al., 1998; Jin et al., 2000; Preston et al., 2004; Feller et al., 2011).
Figure 5.

Structure and Phylogenetic Analyses of EOBI.
(A) Protein sequence of petunia line P720 EOBI. The two MYB repeats (R2 and R3) are indicated by arrows, and the critical Trp residues are indicated by asterisks. The W/Y-MDDIW motif region is underlined (+ indicates conserved amino acids). Numbers in parentheses indicate amino acid positions.
(B) Phylogenetic tree displaying the similarity of EOBI to other R2R3-MYB proteins. Bootstrap values are indicated at branch nodes, and scale bar indicates the number of amino acid substitutions per site. Names of proteins are given in uppercase letters and their origin is indicated by a two-letter prefix: Am, A. majus; Ph, P. hybrida; NlxNs, N. langsdorffii × N. sanderae; Ps, P. sativum; At, Arabidopsis; Sl, S. lycopersicum; Zm, Zea mays. AN2, ANTHOCYANIN2; ANT1, ANTHOCYANIN1; C1, COLORLESS1; GL1, GLABRA1; TT2, TRANSPARENT TESTA2; WER, WEREWOLF. GenBank accession numbers are given in Supplemental Table 2 online. The alignment used to generate this tree is available as Supplemental Data Set 1 online.
Based on the PSORT II prediction algorithm (Nakai and Horton, 1999), EOBI is located in the cell nucleus. To experimentally establish EOBI’s intracellular localization, we transiently expressed an EOBI:GFP (for green fluorescent protein) fusion protein in Nicotiana benthamiana leaves and followed its compartmentalization within the cell. Microscopy analysis localized GFP fluorescence to the nucleus (Figures 4Ba to 4Bc), whereas control GFP (not fused to EOBI) accumulated in the cytosol, as expected (Figures 4Bd and 4Be).
EOBI Is Required for the Expression of Structural and Regulatory Genes Involved in Floral Phenylpropanoid Scent Production
To study EOBI’s function in more detail, transgenic petunia (W115) plants with suppressed EOBI expression were generated. An ∼60 to 80% reduction in EOBI transcript levels was observed in the three independent transgenic EOBI-RNAi lines compared with the transgenic GUS-expressing control line (Figure 6A; see Supplemental Figure 3 online). Plant development and flower shape and size were similar in EOBI-RNAi and transgenic control lines. The levels of a number of phenylpropanoid volatiles emitted from EOBI-RNAi–suppressed flowers (e.g., benzyl alcohol, benzylbenzoate, methylbenzoate, methylsalicylate, eugenol, isoeugenol, etc.) were reduced relative to control flowers (Figure 6B). The levels of some other volatiles were not affected by EOBI suppression (e.g., benzaldehyde, phenylethyl alcohol, and phenylethyl acetate). The level of the monoterpene limonene, as expected, was similar in RNAi-suppressed and control flowers.
Figure 6.

Suppression of EOBI Expression Reduces Levels of Volatile Phenylpropanoids in Petunia Flowers.
(A) Quantitative real-time PCR analysis of EOBI transcript levels in EOBI-RNAi corollas (transgenic lines 36, 41, and 44) compared with control 35Spro:GUS transgenic (c) corollas. Samples were collected from corollas at anthesis. Presented data (three biological replicates, each consisting of three technical repeats) were normalized to those from controls with se indicated by vertical lines. Significance of differences (P ≤ 0.05) between treatments and control (asterisks) was calculated based on the raw transcript level data normalized to Actin using Dunnett’s method following ANOVA.
(B) Dynamic headspace analyses, followed by gas chromatography–mass spectrometry, were performed for 24 h (10:00 to 10:00) with flowers collected from EOBI-RNAi (lines 36, 41, and 44) and control 35Spro:GUS transgenic (c) petunia plants. Graphs represent the average of five independent replicates of major and minor volatiles (left and right graphs, respectively), with se indicated by vertical lines. Significance of differences (P ≤ 0.05) between treatments and control (asterisks) was calculated using Dunnett’s method following ANOVA.
To further detail the effect of EOBI silencing on scent production, we analyzed the expression levels of genes involved in floral scent production in EOBI-RNAi–suppressed flowers. Suppression of EOBI led to significant downregulation of transcripts from the shikimate pathway, as evidenced by significantly lower transcript levels of genes encoding 5-enol-pyruvylshikimate-3-phosphate synthase (EPSPS), 3-deoxy-d-arabinoheptulosonate-7-phosphate synthase (DAHPS), chorismate synthase (CS), chorismate mutase 1 (CM1), prephenate aminotransferase (PPA-AT), and arogenate dehydratase 1 (ADT1) in EOBI-RNAi–suppressed petunia flowers compared with control flowers (Figures 7A to 7F). Transcript levels of both PAL1 and PAL2, representing core phenylpropanoid pathway genes, were also significantly downregulated in EOBI-silenced corollas compared with transgenic controls (Figures 7G and 7H). Levels of transcripts coding for enzymes that direct the production of specific phenylpropanoid scent volatiles (e.g., S-adenosyl-l-methionine:benzoic acid/salicylic acid carboxyl methyltransferase 1 and 2 [BSMT1,2], IGS and eugenol synthase [EGS]) were also downregulated in EOBI-RNAi versus control flowers (Figures 7J, 7K, 7M, and 7N); transcript levels of benzoyl CoA:benzyl alcohol/phenylethanol benzoyltransferase (BPBT) and coniferyl alcohol acyltransferase were not affected in EOBI-silenced flowers (Figures 7I and 7L).
Figure 7.

EOBI Silencing Leads to Downregulation of the Expression of Genes in the Shikimate and Phenylpropanoid Pathways.
Quantitative real-time PCR analysis of EPSPS, DAHPS, CS, CM1, PPA-AT, ADT1, PAL1, PAL2, BPBT, BSMT1, BSMT2, coniferyl alcohol acyltransferase, IGS, and EGS transcript levels, respectively, in EOBI-RNAi corollas (transgenic lines 36, 41, and 44) compared with control 35Spro:GUS transgenic (c) corollas. Samples were collected from corollas 1 d after anthesis. Presented data (three biological replicates, each consisting of three technical repeats) were normalized to those from control corollas with se indicated by error bars. Significance of differences (P ≤ 0.05) between treatments and control (asterisks) was calculated using Dunnett’s method following ANOVA based on the raw transcript level data normalized to Actin.
Transcript levels of ODO1 and EOBII in EOBI-RNAi versus control flowers were also analyzed to evaluate the interrelationships among regulatory factors affecting various branches leading to phenylpropanoid scent production (Figure 8). Silencing of EOBI did not affect EOBII transcript levels; on the other hand, transcript levels of ODO1 were significantly downregulated in flowers of the EOBI-RNAi lines compared with control flowers (Figures 8A and 8B). Interestingly, analysis of petunia flowers with RNAi-suppressed ODO1 (Figure 8C; Verdonk et al., 2005) revealed significantly upregulated EOBI transcript levels (Figure 8D), suggesting a negative feedback loop between EOBI and ODO1.
Figure 8.

Interrelationship between EOBI and ODO1 Regulatory Factors.
(A) and (B) Quantitative real-time PCR analysis of EOBII and ODO1 transcript levels, respectively, in EOBI-RNAi corollas at anthesis (transgenic lines 36, 41, and 44) compared with control 35Spro:GUS transgenic (c) corollas.
(C) and (D) Quantitative real-time PCR analysis of ODO1 and EOBI transcript levels, respectively, in ODO1-RNAi petunia corollas compared with control 35Spro:GUS transgenic corollas. Samples were collected from corollas 1 d after anthesis. Presented data were normalized to those from control corollas with se indicated by vertical lines. Significance of differences (P ≤ 0.05; three to four biological replicates, each consisting of three technical repeats) between treatments and control (asterisks) was calculated using Dunnett’s method following ANOVA based on the raw transcript level data normalized to Actin.
EOBI Activates Genes Involved in Phenylpropanoid Scent Production
To evaluate the ability of EOBI to transcriptionally activate scent-related genes, protoplasts cotransformed with 35Spro:EOBI and PALpro:DsRed or with 35Spro:EOBI and IGSpro:DsRed constructs were employed (Figures 9Aa to 9Af). An unrelated MYB regulatory factor (MYBYS) under the control of the 35S promoter (35Spro:MYBYS) or 35Spro:CFP were used as controls for promoter-activation analyses. Only protoplasts cotransformed with 35Spro:EOBI and IGSpro:DsRed or with 35Spro:EOBI and PALpro:DsRed expressed DsRed (Figures 9Ab and 9Ae). Control protoplasts cotransformed with 35Spro:MYBYS or 35Spro:CFP instead of 35Spro:EOBI did not yield DsRed fluorescent signal when either PALpro:DsRed or IGSpro:DsRed was used as the reporter (Figures 9Ah, 9Ak, 9An, and 9Aq). Overexpression of EOBI in petunia leaves infiltrated with Agrobacterium carrying 35Spro:EOBI also led to activation of endogenous IGS in the inoculated tissues (see Supplemental Figure 4 online), further establishing the capacity of EOBI to activate IGS expression.
To evaluate the ability of EOBI to interact with PAL and IGS promoters, a yeast one-hybrid (Y1H) assay was performed using EOBI (pD22-EOBI) and LacZ driven by PAL or IGS promoter fragments (PALpro:GLacZi and IGSpro:GLacZi, respectively) as targets. LacZ activity was detected in yeast harboring pD22-EOBI together with PALpro:GLacZi or IGSpro:GLacZi, but not in control yeast harboring PALpro:GLacZi or IGSpro:GLacZi together with pD22 lacking EOBI (Figure 9B).
Figure 9.

EOBI Interacts with and Activates IGS and PAL Promoters.
(A) Arabidopsis protoplasts transformed with 35S-driven EOBI (35Spro:EOBI) together with DsRed driven by the petunia IGS promoter (IGSpro:DsRed) ([a] to [c]) or with 35Spro:EOBI together with DsRed driven by the PAL promoter (PALpro:DsRed) ([d] to [f]). As controls, protoplasts were transformed with IGSpro:DsRed or PALpro:DsRed together with cucumber MYBYS driven by the 35S promoter (35Spro:MYBYS) ([g] to [i] and [j] to [l], respectively) or with 35Spro:CFP ([m] to [o] and [p] to [r], respectively). CFP, DsRed, and bright-field images are shown in top, middle and bottom panels, respectively. Bars = 50 μm.
(B) Interaction of EOBI with IGS and PAL promoters as revealed by Y1H analysis. The interaction of EOBI protein, fused to GAL4 activation domain (pD22-EOBI), with LacZ driven by IGS (IGSpro:GLacZi) or PAL (PALpro:GLacZi) promoter is shown in the top and bottom left panels, respectively. Yeast transformed with IGSpro:GLacZi or PALpro:GLacZi together with empty, EOBI-lacking pD22 (top and bottom right panels, respectively) were used as controls.
[See online article for color version of this figure.]
Interaction of EOBI with the ODO1 Promoter
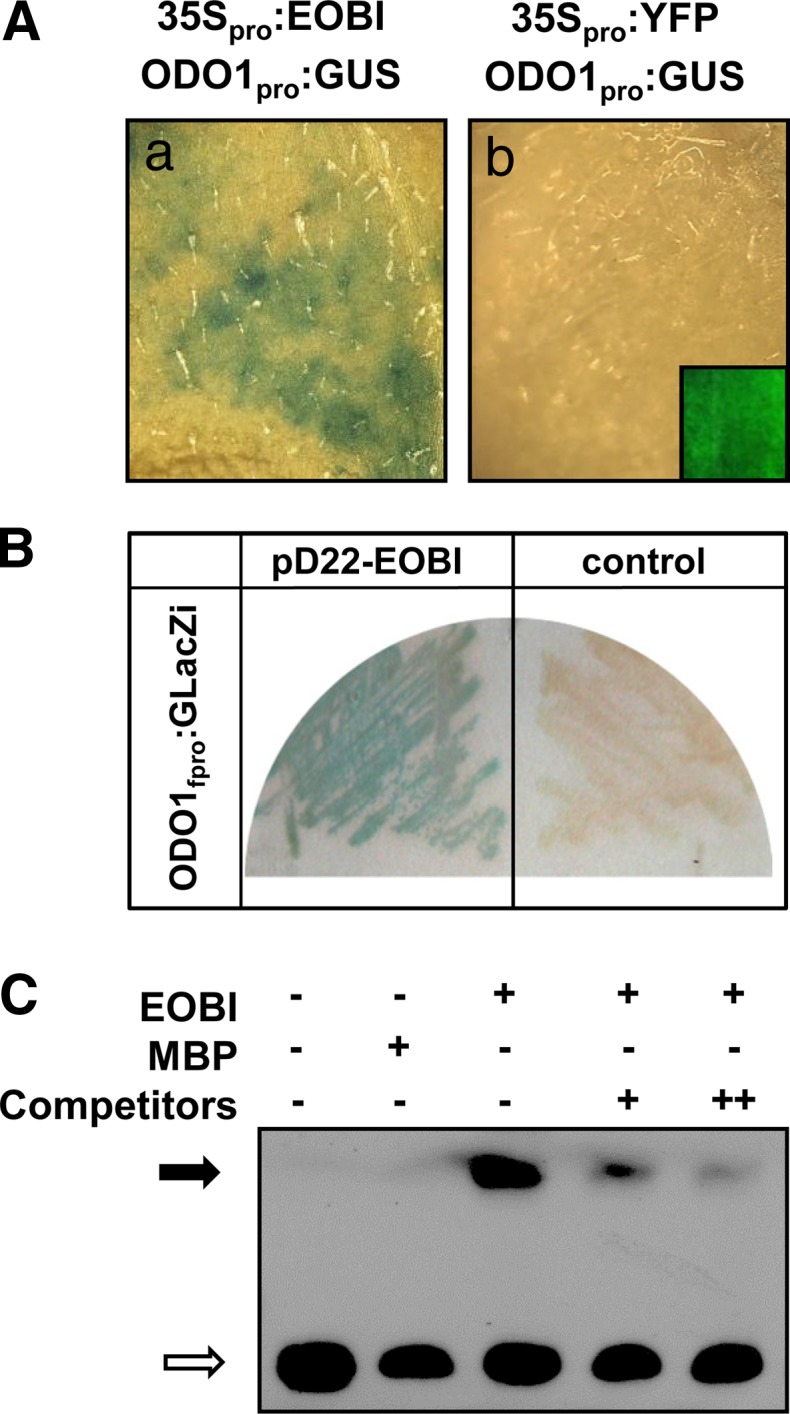
To characterize the ability of EOBI to activate ODO1, petunia leaves were coinfiltrated with Agrobacterium harboring the 35Spro:EOBI construct together with a GUS reporter gene driven by the ODO1 promoter (ODO1pro:GUS; Van Moerkercke et al., 2011). Activation of ODO1pro:GUS by EOBI was revealed in these coinoculated leaves; no GUS activity was detected in control tissues coinoculated with 35Spro:YFP (instead of EOBI) and ODO1pro:GUS (Figure 10A). To further assay the interaction between EOBI and the ODO1 promoter, two complementary approaches, Y1H and EMSA, were employed. The Y1H assay was performed using pD22-EOBI and LacZ driven by the ODO1 promoter fragment (ODO1fpro:GLacZi) containing two MYB binding sites (Van Moerkercke et al., 2011). LacZ activity was detected in yeast harboring pD22-EOBI together with ODO1fpro:GLacZi and not in control yeast harboring ODO1fpro:GLacZi together with pD22 lacking EOBI (Figure 10B). To analyze protein-DNA complex formation using EMSA, EOBI recombinant protein (fused to MBP) was incubated with labeled ODO1fpro, with or without competitor DNA. Gel-shift assays (Figure 10C) showed that EOBI recombinant protein can interact with the ODO1 promoter. Unlabeled ODO1fpro was able to compete with the labeled ODO1fpro for EOBI binding in a dose-dependent manner, and the mobility shift was not seen in control reactions lacking EOBI, indicating a specific interaction between EOBI and the ODO1 promoter.
Figure 10.
EOBI Binds to and Activates the ODO1 Promoter.
(A) ODO1 promoter activity in petunia leaves 48 h after coinfiltration with agrobacteria carrying GUS driven by the ODO1 promoter (ODO1pro:GUS; Van Moerkercke et al., 2011) together with 35S promoter–driven EOBI (35Spro:EOBI) (a) or YFP driven by the 35S promoter (35Spro:YFP) as a control (b). Inset in (b) shows YFP control image.
(B) Interaction of EOBI with ODO1 promoter as revealed by Y1H analysis. Interaction of EOBI protein, fused to GAL4 activation domain (pD22-EOBI), with LacZ driven by the ODO1 promoter fragment (ODO1fpro:GLacZi) is shown in left panel. Yeast transformed with ODO1fpro:GLacZi together with empty EOBI-lacking pD22 (right panel) were used as a control.
(C) EMSA of an ODO1 promoter fragment by EOBI. A biotinylated ODO1 promoter fragment was used as the probe. MBP was used as a control protein. Black arrow indicates protein-DNA complexes. White arrow shows the positions of the free probe (bottom left). In lanes with competitor DNA, + and ++ indicate 200× and 1000× molar excess of nonlabeled probe, respectively.
[See online article for color version of this figure.]
DISCUSSION
The importance of floral scent in the plant’s life cycle on the one hand, and the high energy cost invested in metabolism of these volatiles on the other, probably explain the need for tight control of this trait. To allow plasticity of the multistep metabolic pathways leading to floral scent, simultaneous regulation of elements at different junctions is likely to be required. The effect of EOBI on floral scent was demonstrated in both stably and transiently transformed plants. For example, EOBI silencing via transgenesis led to downregulation of numerous genes from the shikimate pathway and downstream scent-related genes from the phenylpropanoid pathway (i.e., EPSPS, DAHPS, CS, CM1, ADT1, and PPA-AT, and PAL, IGS, and BSMT, respectively). In some of the lines, the effect of EOBI silencing on a number of the target genes, such as DAHPS, CS, and BSMT2, was not significant, probably due to specific environment–genotype interactions or intragenotype variation of the highly complex trait that is scent. Indeed, variation in the expression levels of scent-related genes within populations of transgenic lines has been documented in ADT1- and ODO1-silenced petunia flowers; a similar lack of uniformity among individual plants was also apparent in studies of volatiles emitted by cinnamate:CoA ligase– and 3-ketoacyl-CoA thiolase–silenced petunia lines (Verdonk et al., 2005; Van Moerkercke et al., 2009; Maeda et al., 2010; Klempien et al., 2012). EOBI silencing led to reduced levels of numerous floral volatiles (e.g., methylbenzoate, isoeugenol, benzylbenzoate, benzyl alcohol, phenylethylbenzoate, and others). In the case of benzylbenzoate, a reduction in emission levels despite a lack of effect on BPBT transcript levels might be ascribed to insufficient flow of substrates to this metabolic branch. A similar trend has been seen in flowers with suppressed ODO1 (i.e., whereas BSMT transcript was not downregulated, the level of emitted methylbenzoate was reduced) (Verdonk et al., 2005). By contrast, while reduced in EOBII-suppressed flowers (Spitzer-Rimon et al., 2010), benzaldehyde levels were not affected in EOBI-silenced flowers. Since the biosynthetic steps leading to benzaldehyde production have not yet been deciphered (Klempien et al., 2012), we cannot exclude the possibility that the relevant enzymes are affected by suppression of EOBII but not EOBI; alternatively, metabolic flow toward benzaldehyde may be in excess relative to the downstream steps; in transgenic flowers in which these downstream steps are strongly downregulated, benzaldehyde levels would be less affected (Boatright et al., 2004).
Complex interactions between transcription factors, including MYBs, have been demonstrated in numerous plant systems for an array of processes (Jin and Martin, 1999; Aharoni et al., 2001; Koes et al., 2005; Schwinn et al., 2006; Kaufmann et al., 2010; Sønderby et al., 2010). Several lines of evidence presented here support EOBII’s involvement in transcriptional activation of EOBI expression as well. These include the negative and positive effects of EOBII silencing and overexpression on EOBI transcript levels, respectively, and EOBII’s ability to bind the EOBI promoter in vitro and to activate it in leaf protoplasts. The spatial, developmental, and temporal accumulation patterns of EOBI transcript relative to EOBII further support the relationship between these factors (Figures 3 and 11; Spitzer-Rimon et al., 2010). Expression of both genes was flower specific, with maximum transcript levels in the limbs. This tissue specificity is probably transcriptionally regulated, since a similar expression pattern was revealed when a reporter gene driven by the EOBI promoter was expressed in different petunia tissues (Figure 4A). With respect to developmental expression pattern, EOBII transcript accumulation precedes that of EOBI, yet expression of both genes peaks at anthesis (Figure 3B; Spitzer-Rimon et al., 2010). Similarly, analyses of diurnal accumulation of EOBI transcript showed that it follows that of EOBII: EOBII transcript starts to accumulate from 15:00 onward, whereas accumulation of EOBI transcript becomes apparent after midnight. As might be expected for a scent regulator, the expression pattern of EOBI is rhythmic, with a phase preceding that of biosynthetic floral scent-related genes and that of scent production: Maximal levels of the transcript were detected from the early morning hours until noon, preceding, for example, peak CM, DAHPS, PPA-AT, and IGS transcript accumulation (Colquhoun et al., 2010; Maeda et al., 2011) by 5 to 6 h. A similar lag was observed in EOBI versus ODO1 expression, with activity of the ODO1 promoter being highest at 15:00 (Van Moerkercke et al., 2011). Transcriptional activation by EOBI of ODO1 and the structural biosynthetic genes IGS and PAL is in agreement with the hierarchical and sequential activation of the pathway toward scent production in flowers.
Figure 11.

Regulation of Scent in Petunia Flowers: Schematic Diagram.
Solid arrows represent a one-step enzymatic reaction, and dashed arrows represent several enzymatic reactions or as yet undescribed steps. Genes downregulated following suppression of EOBI, ODO1, or EOBII are in boldface or marked by a superscript one or two, respectively. IGS and PAL, shown to interact with EOBI and EOBII, are underlined. BPBT, benzoyl-CoA:benzyl alcohol/2-phenylethanol benzoyltransferase; BSMT, S-adenosyl-l-Met:benzoic acid/salicylic acid carboxyl methyltransferase; C4H, cinnamate-4-hydroxylase; CFAT, coniferyl alcohol acetyltransferase; CS, chorismate synthase; DAHP, 3-deoxy-d-arabino-heptulosonic acid 7-phosphate; E4P, d-erythrose-4-phosphate; EGS, eugenol synthase; EPSP, 5-enolpyruvate-shikimate-3-phosphate; IGS, isoeugenol synthase; PAAS, phenylacetaldehyde synthase; PEP, phosphoenolpyruvate.
[See online article for color version of this figure.]
EOBI’s effect on ODO1 expression, its interaction with ODO1 promoter, and its developmental pattern of expression support its role as a key factor, in addition to EOBII, for correct expression of ODO1. Interestingly, while EOBI activates ODO1 expression, the latter negatively affects EOBI levels as revealed by analyses of EOBI transcript levels in flowers of ODO1-RNAi transgenic petunia. This could explain the increased transcript levels of BSMT in ODO1-RNAi lines (Verdonk et al., 2005), since the BSMT transcript level is positively affected by EOBI. The negative feedback loop between ODO1 and EOBI may represent fine-level control in the scent regulation web. For example, such a feedback loop might allow continual correction of ODO1 levels according to EOBI levels and vice versa, leading to the coordination of flux into the pathway with that of the final enzymatic steps of the scent molecule’s production; in this way, tight control of resources expended by plants for activation of primary and specialized branches (i.e., production of volatile phenylpropanoids) can be achieved. A similar regulatory genetic loop was recently described in the pathway leading to aliphatic glucosinolate production (Sønderby et al., 2010).
Complex transcriptional control of metabolic networks has been described in several plant systems. For example, in petunia, flavonoid biosynthesis and vacuolar acidification are regulated by a complex network of interactions between MYB–basic helix-loop-helix (bHLH)–WD40 proteins. While binding of bHLH–ANTOCYANIN1 to PH4 activates vacuolar acidification, its interaction with AN2 regulates anthocyanin synthesis (Spelt et al., 2000; Koes et al., 2005; Quattrocchio et al., 2006). The transcriptional regulation network of ripening-related metabolism has been demonstrated in tomato (Solanum lycopersicum) fruits through interactions of NON-RIPENING, RIPENING-INHIBITOR, and COLORLESS NON-RIPENING factors with APETALA2a, which not only governs chromoplast differentiation and ethylene production, but also regulates cell wall biosynthesis, amino acid production, and secondary metabolism (Karlova et al., 2011). EOBI was also found to regulate the transcription of genes involved in both primary and secondary metabolism (i.e., aromatic amino acid synthesis and scent production). Interestingly, EOBII, which directly regulates both EOBI and ODO1, has been suggested to play a more complex role in flower development, particularly during the stages preceding flower opening (Colquhoun et al., 2011b). These interrelationships reinforce the tight link between primary metabolism, secondary metabolism, and flower development.
The interplay between machineries controlling primary and specialized metabolic branches is not surprising, especially based on the progressive evolution of pathways (for example, recruitment of enzymes from primary metabolism to the phenylpropanoid pathway) in land plants (Stafford, 1991; Ferrer et al., 2008). The R2R3-MYB family of transcription factors that, in complex with other factors (e.g., bHLH and WD40 factors), regulates most of the enzymatic steps in the phenylpropanoid pathway, underwent dramatic expansion around the time of land colonization by plants (Dubos et al., 2010; Feller et al., 2011). According to Arabidopsis classification, R2R3-MYB transcription factors are commonly divided, based on C-terminal domains, into ∼22 subgroups (Kranz et al., 1998; Dubos et al., 2010). The variations in the numbers and sizes of the subgroups between species attests to gene specialization after divergence from the last common ancestor (Zhang et al., 2000; Dias et al., 2003; Wilkins et al., 2009; Feller et al., 2011). The growth and specialization of the R2R3-MYB family members can be exemplified by many processes involved in the adaptation of land plants, for example, secondary wall biosynthesis, UV protection, showy flower traits, pollinator attraction, etc. (Dubos et al., 2010; Feller et al., 2011). EOBI falls into subgroup 19, together with MYB305 from snapdragon and ornamental tobacco, EOBII from petunia, and other phenylpropanoid-associated MYB factors (Sablowski et al., 1994; Moyano et al., 1996; Uimari and Strommer, 1997; Shin et al., 2002; Li et al., 2006). EOBI shows higher sequence similarity to MYB305 from snapdragon than to petunia EOBII (Figure 5; see Supplemental Figure 5 online); the latter shares highest sequence similarity with MYB305 from ornamental tobacco, suggesting that EOBI and EOBII diverged relatively early in evolution. Interestingly, although snapdragon flowers emit phenylpropanoid volatiles during the day, whereas petunia flowers emit them during the night, similar molecular mechanisms have been suggested for the control of methylbenzoate emission in these plant systems (Kolosova et al., 2001); it is tempting to speculate that the interplay between the EOBI and II homologs in Antirrhinum, MYB305 and MYB340, respectively, is involved in the regulation of scent production in snapdragon, possibly via regulation of PAL expression.
Promoters of at least two genes encoding phenylpropanoid scent-related enzymes, IGS and PAL, interact with and are transactivated by both EOBI and EOBII. Partial redundancy within subgroup 19 MYB factors has been previously demonstrated. In snapdragon, for example, both MYB305 and MYB340 can activate the promoter region of phenylpropanoid genes PAL2, chalcone isomerase (CHI), and flavonone 3-hydroxylase (Moyano et al., 1996). Transcriptional activation of the target CHI promoter by MYB340 is stronger than that of MYB305, but the DNA binding activity of MYB305 is stronger than that of MYB340. These multiple interactions have been suggested to enable fine-tuning of the target genes’ transcriptional activation (Moyano et al., 1996).
Transactivation of one R2R3-MYB by another one belonging to the same or a different subgroup may represent an additional general feature of R2R3-MYB factors that enables further amplification and diversification of the outcome signal (Kang et al., 2009; Sønderby et al., 2010, Zhong et al., 2010). Such a feed-forward mechanism has been shown for members of subgroups 15 and 12: Members of the latter group, MYB28 and MYB76, positively regulate MYB29, while WERWOLF feeds forward on MYB23 (Kang et al., 2009; Sønderby et al., 2010). Similarly, EOBII transcriptionally activates EOBI, and both EOBI and EOBII activate the expression of the distantly related ODO1, which in turn negatively affects EOBI transcription (Figure 11). Hence, the genetic relationships between EOBI, EOBII, and ODO1 may also serve as a dynamic regulatory tool to adjust metabolic flow. This is likely to be particularly important when dealing with processes that carry a high metabolic cost.
METHODS
Plant Material
Rooted petunia plantlets (Petunia hybrida lines P720 and W115 [cv Mitchell]) were obtained from Danziger-“Dan” Flower Farm (Mishmar Hashiva, Israel). Transgenic cv Mitchell (W115) with RNAi-suppressed ODO1 (Verdonk et al., 2005) was kindly provided by Robert C. Schuurink, University of Amsterdam, The Netherlands. All plants were grown in the greenhouse under 25°C/20°C day/night temperatures and natural photoperiod.
Cloning of EOBI and Construction of Vectors
MYB-like DNA fragments termed R2R3-EOBI, R2R3-EOBIII, and R2R3-EOBV were isolated by RT-PCR as described previously (Spitzer-Rimon et al., 2010). To clone the 3′ region of EOBI, a SMART RACE cDNA amplification kit (Clontech) was used. PCR was performed on petunia flowers’ cDNA using a forward primer based on the sequence of R2R3-EOBI (see Supplemental Table 1 online, forward primer of set 1) and the kit’s reverse primer. To clone the 5′ region of EOBI, PCR was performed on a petunia cDNA library using primers based on the sequence of the 3′-EOBI (see Supplemental Table 1 online, reverse primer of set 1). The full-length EOBI was cloned from petunia lines P720 and W115 using primers to the 5′ and 3′ ends of the partial EOBI sequences (see Supplemental Figure 6 online). To generate Tobacco rattle virus (TRV2) containing the 3′ untranslated region of EOBI (TRV2-EOBI), 85 bp of line P720 EOBI were PCR amplified using primer set 2. To generate pTRV2 containing the 5′ region of EOBIII (TRV2-EOBIII), 79 bp of line P720 EOBIII were PCR amplified using primer set 3. To generate pTRV2 containing the 3′ region of EOBV (TRV2-EOBV), 206 bp of line P720 EOBV were PCR amplified using primer set 4. To construct pTRV2 with EOBI fused upstream of GFP (pTRV2-EOBI:GFP), the 606-bp ORF of line P720 EOBI was PCR amplified using primer set 5 (containing additional Gly-Gly amino acids at the 5′ end of the reverse primer), and ligated (in-frame with GFP) into pTRV2-GFP (Spitzer et al., 2007), which was restricted with HpaI at the 3′ end of GFP. The pTRV2 derivatives described above and pTRV1 were then transfected into Agrobacterium tumefaciens (strain AGLO) and used for plant inoculation as described by Spitzer et al. (2007). To generate a binary vector containing EOBI under the control of the cauliflower mosaic virus 35S promoter (35Spro:EOBI), the full-length EOBI of line P720 was PCR amplified using primer set 6. The PCR product was cloned into a pCd shuttle vector between the cauliflower mosaic virus 35S promoter and octopine synthase terminator; the resultant plasmid was then digested with KpnI-XbaI and the generated restriction fragment was inserted into binary vector pCGN1559 containing the neomycin phosphotransferase II gene (Ben Zvi et al., 2008). To generate transgenic EOBI- and EOBII-RNAi petunia plants, 157- and 197-bp fragments from the 3′ ends of EOBI and EOBII, respectively, were obtained by PCR, using primer set 7 for EOBI and primer set 8 for EOBII. The PCR fragments were cloned into pRNA69 in sense and antisense orientations, separated by an intron, as described by Leitner-Dagan et al. (2006). The constructs were then cloned into the NotI site of the binary vector pART27 and transformed into Agrobacterium strain AGLO.
Plant Transformation and Regeneration
Petunia variety W115 (cv Mitchell) was used to generate transgenic plants by modified leaf-disk transformation as described by Guterman et al. (2006). Petioles were incubated in bacterial suspension for 10 min and then transferred to cocultivation medium (4.4 g/L Murashige and Skoog [MS] basal medium [Sigma-Aldrich] supplemented with 30 g/L Suc and 7 g/L oxoid agar [Sigma-Aldrich], 0.5 mg/L benzyladenine, and 0.01 mg/L 1-naphthalene acetic acid [NAA]) for 2 d in the dark. Regeneration and selection of shoots were conducted on MS with 1.5 mg/L benzyladenine, 0.1 mg/L NAA, 0.1 g/L gibberellin, 300 mg/L carbenicillin, and 80 mg/L kanamycin. Fully developed shoots were transferred to elongation medium (MS with 0.5 mg/L zeatin, 100 mg/L carbenicillin, 200 mg/L cefataxime, and 80 mg/L kanamycin). Plants were rooted on MS with 0.1 mg/L NAA, 100 mg/L carbenicillin, 200 mg/L cefataxime, and 50 mg/L kanamycin.
Agroinoculation of TRV Vectors
Agrobacterium (strain AGLO) transformed with pTRV1 and pTRV2 derivatives was prepared as described previously (Liu et al., 2002). The Agrobacterium culture was grown overnight at 28°C in Luria-Bertani medium with 50 mg/L kanamycin and 200 µM acetosyringone. The cells were harvested and resuspended in inoculation buffer containing 10 mM MES, pH 5.5, 200 µM acetosyringone, and 10 mM MgCl2 to an OD550 of 10. Following an additional 3 h of incubation at 28°C, the bacteria containing pTRV1 were mixed with those containing the pTRV2 derivatives in a 1:1 ratio; 200 to 400 μL of this mixture was applied to the cut surface, after removing the apical meristem, of petunia line P720 plantlets. For subcellular localization of EOBI, 3-week-old seedlings of N. benthamiana were agroinfected with pTRV2-EOBI:GFP and pTRV2-GFP by leaf infiltration using a syringe (Spitzer-Rimon et al., 2010). Transient expression of GFP in the tobacco (Nicotiana benthamiana) epidermis was evaluated 36 h after infection using an epifluorescence inverted microscope (Olympus-IX8 Cell-R) with a 12-bit Orca-AG charge-coupled device camera (Hamamatsu).
Protoplast Transformation
To clone the EOBI and EOBII promoter regions from petunia line W115, the Genome-Walker kit (Clontech) was used according to the manufacturer’s instructions and as described by Spitzer-Rimon et al. (2010). EOBI (1302 bp) and EOBII (1343 bp) promoter regions were cloned upstream of DsRed (EOBIpro:DsRed and EOBIIpro:DsRed) into KpnI and BamHI sites (forward primer 5′-GGTACCGTATGTTGAAAGGGCAGCCT-3′ and reverse primer 5′-GGATCCGATATAGGATTTTGACGAGGAACTAAT-3′) of pSAT6A-DsRed2-N1 vector (Spitzer-Rimon et al., 2010). Protoplasts were isolated from Arabidopsis thaliana and petunia line P720 leaf mesophyll and employed for transient expression, using the polyethylene glycol transformation method (Locatelli et al., 2003), of 35Spro:EOBI and IGSpro:DsRed (Spitzer-Rimon et al., 2010), 35Spro:EOBI and PALpro:DsRed (Spitzer-Rimon et al., 2010), 35Spro:EOBII and EOBIpro:DsRed, or 35Spro:EOBI and EOBIIpro:DsRed. Protoplasts transformed with IGSpro:DsRed and pSAT6-ECFP-C1 (35Spro:CFP; Tzfira et al., 2005), IGSpro:DsRed and 35Spro:MYBYS (Leitner-Dagan et al., 2006), PALpro:DsRed and 35Spro:CFP, PALpro:DsRed and 35Spro:MYBYS, EOBIpro:DsRed and 35Spro:CFP, or EOBIpro:DsRed and 35Spro:MYBYS were used as controls. Imaging was performed by epifluorescence inverted microscope 14 h after transformation, with the charge-coupled device camera.
Transient Overexpression in Petunia
Transient overexpression in petunia line W115 leaves and flowers was performed according to Long et al. (2009). Petunia buds 3 d before anthesis were vacuum infiltrated with Agrobacterium containing 35Spro:EOBII or 35Spro:GUS. RNA was extracted from infiltrated corollas 48 h after inoculation, and the transcript levels of selected genes were analyzed by real-time RT-PCR. For promoter analyses, EOBIpro:DsRed and IGSpro:DsRed were cloned into the pCGN1559 binary vector to create pCGN1559-EOBIpro:DsRed and pCGN1559-IGSpro:DsRed, respectively. Flowers (3-cm buds and flowers at anthesis) and leaves were coinfiltrated, as described above, with Agrobacterium AGLO carrying pCGN1559-EOBIpro:DsRed or pCGN1559-IGSpro:DsRed together with strain AGLO carrying pART27-35Spro:YFP (kindly provided by Yuval Eshed, Weizmann Institute, Rehovot, Israel). After 36 h, the leaves and flowers were examined using a fluorescence binocular microscope (FLOUIII; Leica) under white and UV light with DsRed and YFP filters. Agrobacterium AGLO carrying pCGN1559-IGSpro:DsRed or pBIN-M19pro:GUS (ODO1pro:GUS; Van Moerkercke et al., 2011) and pCGN1559-35Spro:EOBI was used for expression of EOBI in petunia leaves. pCGN1559-35Spro:EOBI was substituted with pART27-35Spro:YFP in control experiments. After 2 to 5 d, the leaves were examined with a fluorescence binocular microscope and by quantitative real-time PCR.
GUS activity was assayed by incubating tissue samples overnight at 37°C in a 0.1% (w/v) X-Gluc (5-bromo-4-chloro-3-indolyl β-d-glucuronic acid sodium salt; Biosynth) solution containing 0.1 M sodium phosphate buffer, pH 7.0, 10 mM EDTA, and 0.1% (w/v) Triton X-100. Green tissues were bleached, after staining, by immersion in 50% ethanol for a few hours, followed by several washes with 70% ethanol.
Real-Time PCR Analysis
Petunia total RNA was extracted with the Tri-Reagent kit (Molecular Research Center) and treated with RNase-free DNase (Fermentas). First-strand cDNA was synthesized using 1 μg total RNA, oligo(dT) primer, and Reverse Transcriptase ImProm-II (Promega). Real-time quantitative PCR was performed as described by Spitzer-Rimon et al. (2010) for 40 cycles (94°C for 15 min and then cycling at 94°C for 10 s, 60°C for 30 s, and 72°C for 20 s) in the presence of Absolute Blue qPCR SYBR Green ROX Mix (Thermo Fisher Scientific) on a Corbett Research Rotor-Gene 6000 cycler. A standard curve was generated for each gene using dilutions of cDNA samples, and data analysis were performed using Rotor-Gene 6000 series software 1.7. PCR primers used for amplification of gene-specific regions (at least one of the primers was directed to the UTR of the transcript) are listed in Supplemental Table 1 online, primer sets 9 to 28. Primer specificity was determined by melting curve analysis; a single, sharp peak in the melting curve ensured that a single, specific DNA species had been amplified.
Collection and Gas Chromatography–Mass Spectrometry Analysis of Volatile Compounds
For dynamic headspace analysis, flowers were collected 1 d after anthesis at 10:00, unless otherwise indicated. Volatiles emitted from detached petunia flowers were collected for 24 h using an adsorbent trap consisting of a glass tube containing 100 mg Porapak Type Q polymer (80/100 mesh; Alltech) and 100 mg charcoal-activated 20/40 mesh (Supelco), held in place with plugs of silanized glass wool (Guterman et al., 2006). Trapped volatiles were eluted using 1.5 mL hexane, and 2 μg iso-butylbenzene was added to each sample as an internal standard.
Gas chromatography–mass spectrometry analysis (1-μL sample) was performed using a device composed of a Pal autosampler (CTC Analytic), a TRACE GC 2000 equipped with an Rtx-5SIL mass spectrometer (Restek; i.d. 0.25 μm, 30 m × 0.25 mm) fused-silica capillary column, and a TRACE DSQ quadrupole mass spectrometer (ThermoFinnigan). Helium was used as the carrier gas at a flow rate of 0.9 mL/min. The injection temperature was set to 250°C (splitless mode) and the interface to 240°C, and the ion source was adjusted to 200°C. The analysis was performed under the following temperature program: 2 min of isothermal heating at 40°C followed by a 10°C/min oven temperature ramp to 250°C. The system was equilibrated for 1 min at 70°C before injection of the next sample. Mass spectra were recorded at 3.15 scan/s with a scanning range of 40 to 450 mass-to-charge ratio and electron energy of 70 eV. Compounds were tentatively identified (>95% match) based on the NIST/EPA/NIH Mass Spectral Library (data version NIST 05; software version 2.0d) using the XCALIBUR v1.3 program (ThermoFinnigan). Further identification of major compounds was based on comparison of mass spectra and retention times with those of authentic standards (Sigma-Aldrich) analyzed under similar conditions.
EMSA
MBP-EOBI and MBP-EOBII fusion proteins (cloned from 35Spro:EOBI and 35Spro:EOBII, respectively) were expressed in Escherichia coli cells essentially as done by Van Moerkercke et al. (2011). Four hours after induction with 0.1 mM isopropyl β-d-thiogalactopyranoside, the culture was harvested by centrifugation for 5 min at 5000g. The pellet was resuspended in 50 mL ice-cold MBP buffer (10 mM Tris-Cl, pH 7.5, 30 mM NaCl, 1 mM EDTA, 1 mM PMSF, and 1× protease inhibitor cocktail), sonicated for 15 min, and centrifuged for 20 min at 14,000g. The supernatant was incubated for 2 h at 4°C with prewashed amylose resin (NEB). The resin was then washed five times with 10 mM Tris-Cl, pH 7.5, and 1 M NaCl buffer. MBP, MBP-EOBI, and MBP-EOBII proteins were eluted with 10 mM Tris-Cl, pH 7.5, and 10 mM maltose buffer and used in EMSA experiments. A 247-bp fragment containing the two MYB binding sites of ODO1 promoter (ODO1fpro; Van Moerkercke et al., 2011) was PCR amplified using 5′ biotinylated or nonbiotinylated (used as competitor) primer set 29 (see Supplemental Table 1 online). To construct EOBI promoter target containing the potential consensus MYB binding sequence CTAACT (Sablowski et al., 1994), a 30-nucleotide long (biotinylated or not) oligonucleotide pair (5′-GACCTATATGTCTAACTTAATAGGTCTTTTCT-3′ and 5′-AGAAAAGACCTATTAAGTTAGACATATAGGTC-3′) corresponding to −1204 to −1174 bp upstream of the EOBI transcriptional start point was synthesized. Oligonucleotide pairs were heated to 80°C for 2 min and then cooled to room temperature (20°C) overnight. EMSA reactions were prepared according to the manufacturer’s protocol (LightShift Chemiluminescent EMSA kit; Thermo Fisher Scientific) using binding buffer, 50 ng poly(dI-dC), proteins, competitor, noncompetitor, and biotin-labeled probes. The protein-probe mixture was separated in a native 6% polyacrylamide gel and transferred to a nylon membrane (Amersham). Migration of biotin-labeled probes was detected on x-ray film using streptavidin–horseradish peroxidase conjugates according to the manufacturer’s protocol.
Y1H Analysis
To generate reporter strains, ODO1fpro, IGSpro, and PALpro promoter fragments were cloned into pENTR/D-TOPO (Invitrogen). In addition, a −764/−234 fragment from ODO1 promoter was cloned as a negative control for the Y1H assay. Promoter fragments were then transferred to pGLacZi (Helfer et al., 2011) by LR recombination according to the manufacturer’s protocol (Invitrogen) to generate ODO1fpro:GLacZi, IGSpro:GLacZi, and PALpro:GLacZi. pGLacZi derivatives were then integrated at the URA3 site of Saccharomyces cerevisiae strain YM4271 (Clontech) by homologous recombination. To generate translational fusion of EOBI to the GAL4 activation domain (AD), the ORF of EOBI was amplified by PCR from 35Spro:EOBI and cloned into pENTR/D-TOPO, and LR was recombined into pDEST22 (Invitrogen) to generate pD22-EOBI. As a positive control, EOBII was cloned into pDEST22, generating pD22-EOBII. Yeast strain Y187 (Clontech) was transformed with an empty pDEST22 vector (pD22) as a negative control or with pD22-EOBI or pD22-EOBII. Reporter and activation strains were crossed, selected on medium lacking Trp and uracil, and tested for β-galactosidase activity by the colony-lift filter assay (Clontech).
Phylogenetic Analysis
The dendogram was constructed using the neighbor-joining algorithm with MEGA5 software (default settings; Tamura et al., 2011). Boostrapping was performed with 1000 replicates. A FASTA file of the ClustalW alignment used for dendogram construction is available as Supplemental Data Set 1 online.
Accession Numbers
Sequence data from this article can be found in GenBank/EMBL data libraries under the accession numbers listed in Supplemental Table 2 online.
Supplemental Data
The following materials are available in the online version of this article.
Supplemental Figure 1. Suppression of MYB-Related Sequences Affects Emission of Volatiles in Petunia Flowers.
Supplemental Figure 2. EOBII Overexpression in Petunia Flower Buds Leads to EOBI Upregulation.
Supplemental Figure 3. Confirmation of the Transgenic Origin of Independent Petunia Lines.
Supplemental Figure 4. EOBI Activates the Promoter and the Transcription of IGS in Petunia Leaves.
Supplemental Figure 5. Sequence Alignment of Petunia hybrida Line P720 EOBI and EOBII.
Supplemental Figure 6. Protein Sequence Alignment of EOBI Cloned from Petunia hybrida Lines P720 and W115.
Supplemental Table 1. List of Primers Used in This Study.
Supplemental Table 2. Accession Numbers of Genes and Proteins.
Supplemental Data Set 1. FASTA File of ClustalW Alignment Using MEGA5 Software.
Acknowledgments
We thank the Danziger “Dan” Flower Farm for providing the plant material, Hillary Voet for assistance in the statistical analyses, and Emmanuel Koen, Sharona Shleizer-Burko, Yogev Burko, and Naomi Ori (The Hebrew University of Jerusalem, Israel) for the help with vector construction and Y1H. We thank Robert C. Schuurink (University of Amsterdam, The Netherlands) for kindly providing us with pBIN-M19pro:GUS. This work was funded by Israel Science Foundation Grants 432/10, U.S.–Israel Binational Agricultural Research and Development Grant US-4322-10, and the Chief Scientist of the Israel Ministry of Agriculture and Rural Development. A.V. is an incumbent of the Wolfson Chair in Floriculture.
AUTHOR CONTRIBUTIONS
B.S.-R. designed and performed the research, analyzed the data, and wrote the article. B.A. and A.C. performed the research and analyzed the data. T.M., O.E., Y.Y., E.S., and M.O. performed the research. M.F. and M.M.B.Z. analyzed the data and wrote the article. A.V. designed the research and wrote the article.
Glossary
- PAL
l-Phe ammonia lyase
- EMSA
electrophoretic mobility shift assay
- RNAi
RNA interference
- GUS
β-glucuronidase
- YFP
yellow fluorescent protein
- GFP
green fluorescent protein
- Y1H
yeast one-hybrid
- bHLH
basic helix-loop-helix
- ORF
open reading frame
- MS
Murashige and Skoog
- NAA
1-naphthalene acetic acid
- ANOVA
analysis of variance
References
- Aharoni A., De Vos C.H.R., Wein M., Sun Z., Greco R., Kroon A., Mol J.N.M., O’Connell A.P. (2001). The strawberry FaMYB1 transcription factor suppresses anthocyanin and flavonol accumulation in transgenic tobacco. Plant J. 28: 319–332 [DOI] [PubMed] [Google Scholar]
- Aharoni A., Galili G. (2011). Metabolic engineering of the plant primary-secondary metabolism interface. Curr. Opin. Biotechnol. 22: 239–244 [DOI] [PubMed] [Google Scholar]
- Ben Zvi M.M., Negre-Zakharov F., Masci T., Ovadis M., Shklarman E., Ben-Meir H., Tzfira T., Dudareva N., Vainstein A. (2008). Interlinking showy traits: Co-engineering of scent and colour biosynthesis in flowers. Plant Biotechnol. J. 6: 403–415 [DOI] [PubMed] [Google Scholar]
- Boatright J., Negre F., Chen X., Kish C.M., Wood B., Peel G., Orlova I., Gang D., Rhodes D., Dudareva N. (2004). Understanding in vivo benzenoid metabolism in petunia petal tissue. Plant Physiol. 135: 1993–2011 [DOI] [PMC free article] [PubMed] [Google Scholar]
- Burow M., Halkier B.A., Kliebenstein D.J. (2010). Regulatory networks of glucosinolates shape Arabidopsis thaliana fitness. Curr. Opin. Plant Biol. 13: 348–353 [DOI] [PubMed] [Google Scholar]
- Colquhoun T.A., Clark D.G. (2011). Unraveling the regulation of floral fragrance biosynthesis. Plant Signal. Behav. 6: 378–381 [DOI] [PMC free article] [PubMed] [Google Scholar]
- Colquhoun T.A., Kim J.Y., Wedde A.E., Levin L.A., Schmitt K.C., Schuurink R.C., Clark D.G. (2011a). PhMYB4 fine-tunes the floral volatile signature of Petunia hybrida through PhC4H. J. Exp. Bot. 62: 1133–1143 [DOI] [PMC free article] [PubMed] [Google Scholar]
- Colquhoun T.A., Schwieterman M.L., Wedde A.E., Schimmel B.C.J., Marciniak D.M., Verdonk J.C., Kim J.Y., Oh Y., Gális I., Baldwin I.T., Clark D.G. (2011b). EOBII controls flower opening by functioning as a general transcriptomic switch. Plant Physiol. 156: 974–984 [DOI] [PMC free article] [PubMed] [Google Scholar]
- Colquhoun T.A., Verdonk J.C., Schimmel B.C.J., Tieman D.M., Underwood B.A., Clark D.G. (2010). Petunia floral volatile benzenoid/phenylpropanoid genes are regulated in a similar manner. Phytochemistry 71: 158–167 [DOI] [PubMed] [Google Scholar]
- Croteau R., Karp F. (1991). Origin of natural odorants. In Perfume: Art, Science and Technology, D. Lamparsky and M. Müller, eds (New York: Elsevier Applied Sciences), pp. 101–126.
- Dal Cin V., et al. (2011). Identification of genes in the phenylalanine metabolic pathway by ectopic expression of a MYB transcription factor in tomato fruit. Plant Cell 23: 2738–2753 [DOI] [PMC free article] [PubMed] [Google Scholar]
- Dare A.P., Schaffer R.J., Lin-Wang K., Allan A.C., Hellens R.P. (2008). Identification of a cis-regulatory element by transient analysis of co-ordinately regulated genes. Plant Methods 4: 17. [DOI] [PMC free article] [PubMed] [Google Scholar]
- Devaiah B.N., Madhuvanthi R., Karthikeyan A.S., Raghothama K.G. (2009). Phosphate starvation responses and gibberellic acid biosynthesis are regulated by the MYB62 transcription factor in Arabidopsis. Mol. Plant 2: 43–58 [DOI] [PMC free article] [PubMed] [Google Scholar]
- Dexter R., Qualley A., Kish C.M., Ma C.J., Koeduka T., Nagegowda D.A., Dudareva N., Pichersky E., Clark D. (2007). Characterization of a petunia acetyltransferase involved in the biosynthesis of the floral volatile isoeugenol. Plant J. 49: 265–275 [DOI] [PubMed] [Google Scholar]
- Dias A.P., Braun E.L., McMullen M.D., Grotewold E. (2003). Recently duplicated maize R2R3 Myb genes provide evidence for distinct mechanisms of evolutionary divergence after duplication. Plant Physiol. 131: 610–620 [DOI] [PMC free article] [PubMed] [Google Scholar]
- Dubos C., Stracke R., Grotewold E., Weisshaar B., Martin C., Lepiniec L. (2010). MYB transcription factors in Arabidopsis. Trends Plant Sci. 15: 573–581 [DOI] [PubMed] [Google Scholar]
- Dudareva N., Pichersky E., Gershenzon J. (2004). Biochemistry of plant volatiles. Plant Physiol. 135: 1893–1902 [DOI] [PMC free article] [PubMed] [Google Scholar]
- Farhi M., Lavie O., Masci T., Hendel-Rahmanim K., Weiss D., Abeliovich H., Vainstein A. (2010). Identification of rose phenylacetaldehyde synthase by functional complementation in yeast. Plant Mol. Biol. 72: 235–245 [DOI] [PubMed] [Google Scholar]
- Feller A., Machemer K., Braun E.L., Grotewold E. (2011). Evolutionary and comparative analysis of MYB and bHLH plant transcription factors. Plant J. 66: 94–116 [DOI] [PubMed] [Google Scholar]
- Ferrer J.L., Austin M.B., Stewart C., Jr, Noel J.P. (2008). Structure and function of enzymes involved in the biosynthesis of phenylpropanoids. Plant Physiol. Biochem. 46: 356–370 [DOI] [PMC free article] [PubMed] [Google Scholar]
- Goodrich K.R., Raguso R.A. (2009). The olfactory component of floral display in Asimina and Deeringothamnus (Annonaceae). New Phytol. 183: 457–469 [DOI] [PubMed] [Google Scholar]
- Guo Y., Gan S. (2011). AtMYB2 regulates whole plant senescence by inhibiting cytokinin-mediated branching at late stages of development in Arabidopsis. Plant Physiol. 156: 1612–1619 [DOI] [PMC free article] [PubMed] [Google Scholar]
- Guterman I., Masci T., Chen X., Negre F., Pichersky E., Dudareva N., Weiss D., Vainstein A. (2006). Generation of phenylpropanoid pathway-derived volatiles in transgenic plants: Rose alcohol acetyltransferase produces phenylethyl acetate and benzyl acetate in petunia flowers. Plant Mol. Biol. 60: 555–563 [DOI] [PubMed] [Google Scholar]
- Helfer A., Nusinow D.A., Chow B.Y., Gehrke A.R., Bulyk M.L., Kay S.A. (2011). LUX ARRHYTHMO encodes a nighttime repressor of circadian gene expression in the Arabidopsis core clock. Curr. Biol. 21: 126–133 [DOI] [PMC free article] [PubMed] [Google Scholar]
- Hippauf F., Michalsky E., Huang R., Preissner R., Barkman T.J., Piechulla B. (2010). Enzymatic, expression and structural divergences among carboxyl O-methyltransferases after gene duplication and speciation in Nicotiana. Plant Mol. Biol. 72: 311–330 [DOI] [PubMed] [Google Scholar]
- Hoballah M.E., Stuurman J., Turlings T.C., Guerin P.M., Connétable S., Kuhlemeier C. (2005). The composition and timing of flower odour emission by wild Petunia axillaris coincide with the antennal perception and nocturnal activity of the pollinator Manduca sexta. Planta 222: 141–150 [DOI] [PubMed] [Google Scholar]
- Horiuchi J., Badri D.V., Kimball B.A., Negre F., Dudareva N., Paschke M.W., Vivanco J.M. (2007). The floral volatile, methyl benzoate, from snapdragon (Antirrhinum majus) triggers phytotoxic effects in Arabidopsis thaliana. Planta 226: 1–10 [DOI] [PubMed] [Google Scholar]
- Jin H., Cominelli E., Bailey P., Parr A., Mehrtens F., Jones J., Tonelli C., Weisshaar B., Martin C. (2000). Transcriptional repression by AtMYB4 controls production of UV-protecting sunscreens in Arabidopsis. EMBO J. 19: 6150–6161 [DOI] [PMC free article] [PubMed] [Google Scholar]
- Jin H., Martin C. (1999). Multifunctionality and diversity within the plant MYB-gene family. Plant Mol. Biol. 41: 577–585 [DOI] [PubMed] [Google Scholar]
- Kaminaga Y., et al. (2006). Plant phenylacetaldehyde synthase is a bifunctional homotetrameric enzyme that catalyzes phenylalanine decarboxylation and oxidation. J. Biol. Chem. 281: 23357–23366 [DOI] [PubMed] [Google Scholar]
- Kang Y.H., Kirik V., Hulskamp M., Nam K.H., Hagely K., Lee M.M., Schiefelbein J. (2009). The MYB23 gene provides a positive feedback loop for cell fate specification in the Arabidopsis root epidermis. Plant Cell 21: 1080–1094 [DOI] [PMC free article] [PubMed] [Google Scholar]
- Karlova R., Rosin F.M., Busscher-Lange J., Parapunova V., Do P.T., Fernie A.R., Fraser P.D., Baxter C., Angenent G.C., de Maagd R.A. (2011). Transcriptome and metabolite profiling show that APETALA2a is a major regulator of tomato fruit ripening. Plant Cell 23: 923–941 [DOI] [PMC free article] [PubMed] [Google Scholar]
- Kaufmann K., Pajoro A., Angenent G.C. (2010). Regulation of transcription in plants: Mechanisms controlling developmental switches. Nat. Rev. Genet. 11: 830–842 [DOI] [PubMed] [Google Scholar]
- Klahre U., Gurba A., Hermann K., Saxenhofer M., Bossolini E., Guerin P.M., Kuhlemeier C. (2011). Pollinator choice in Petunia depends on two major genetic loci for floral scent production. Curr. Biol. 21: 730–739 [DOI] [PubMed] [Google Scholar]
- Klempien A., et al. (2012). Contribution of CoA ligases to benzenoid biosynthesis in petunia flowers. Plant Cell 24: 2015–2030 [DOI] [PMC free article] [PubMed] [Google Scholar]
- Knudsen J.T., Eriksson R., Gershenzon J., Stahl B. (2006). Diversity and distribution of floral scent. Bot. Rev. 72: 1–120 [Google Scholar]
- Koeduka T., Louie G.V., Orlova I., Kish C.M., Ibdah M., Wilkerson C.G., Bowman M.E., Baiga T.J., Noel J.P., Dudareva N., Pichersky E. (2008). The multiple phenylpropene synthases in both Clarkia breweri and Petunia hybrida represent two distinct protein lineages. Plant J. 54: 362–374 [DOI] [PMC free article] [PubMed] [Google Scholar]
- Koes R., Verweij W., Quattrocchio F. (2005). Flavonoids: A colorful model for the regulation and evolution of biochemical pathways. Trends Plant Sci. 10: 236–242 [DOI] [PubMed] [Google Scholar]
- Kolosova N., Gorenstein N., Kish C.M., Dudareva N. (2001). Regulation of circadian methyl benzoate emission in diurnally and nocturnally emitting plants. Plant Cell 13: 2333–2347 [DOI] [PMC free article] [PubMed] [Google Scholar]
- Kranz H.D., et al. (1998). Towards functional characterisation of the members of the R2R3-MYB gene family from Arabidopsis thaliana. Plant J. 16: 263–276 [DOI] [PubMed] [Google Scholar]
- Leitner-Dagan Y., Ovadis M., Shklarman E., Elad Y., Rav David D., Vainstein A. (2006). Expression and functional analyses of the plastid lipid-associated protein CHRC suggest its role in chromoplastogenesis and stress. Plant Physiol. 142: 233–244 [DOI] [PMC free article] [PubMed] [Google Scholar]
- Li J.G., Yang X.Y., Wang Y., Li X.J., Gao Z.F., Pei M., Chen Z.L., Qu L.J., Gu H.Y. (2006). Two groups of MYB transcription factors share a motif which enhances trans-activation activity. Biochem. Biophys. Res. Commun. 341: 1155–1163 [DOI] [PubMed] [Google Scholar]
- Liu Y., Schiff M., Dinesh-Kumar S.P. (2002). Virus-induced gene silencing in tomato. Plant J. 31: 777–786 [DOI] [PubMed] [Google Scholar]
- Locatelli F., Vannini C., Magnani E., Coraggio I., Bracale M. (2003). Efficiency of transient transformation in tobacco protoplasts is independent of plasmid amount. Plant Cell Rep. 21: 865–871 [DOI] [PubMed] [Google Scholar]
- Long M.C., Nagegowda D.A., Kaminaga Y., Ho K.K., Kish C.M., Schnepp J., Sherman D., Weiner H., Rhodes D., Dudareva N. (2009). Involvement of snapdragon benzaldehyde dehydrogenase in benzoic acid biosynthesis. Plant J. 59: 256–265 [DOI] [PubMed] [Google Scholar]
- Maeda H., Shasany A.K., Schnepp J., Orlova I., Taguchi G., Cooper B.R., Rhodes D., Pichersky E., Dudareva N. (2010). RNAi suppression of Arogenate Dehydratase1 reveals that phenylalanine is synthesized predominantly via the arogenate pathway in petunia petals. Plant Cell 22: 832–849 [DOI] [PMC free article] [PubMed] [Google Scholar]
- Maeda H., Yoo H., Dudareva N. (2011). Prephenate aminotransferase directs plant phenylalanine biosynthesis via arogenate. Nat. Chem. Biol. 7: 19–21 [DOI] [PubMed] [Google Scholar]
- Malitsky S., Blum E., Less H., Venger I., Elbaz M., Morin S., Eshed Y., Aharoni A. (2008). The transcript and metabolite networks affected by the two clades of Arabidopsis glucosinolate biosynthesis regulators. Plant Physiol. 148: 2021–2049 [DOI] [PMC free article] [PubMed] [Google Scholar]
- Mandaokar A., Browse J. (2009). MYB108 acts together with MYB24 to regulate jasmonate-mediated stamen maturation in Arabidopsis. Plant Physiol. 149: 851–862 [DOI] [PMC free article] [PubMed] [Google Scholar]
- Moyano E., Martínez-Garcia J.F., Martin C. (1996). Apparent redundancy in myb gene function provides gearing for the control of flavonoid biosynthesis in Antirrhinum flowers. Plant Cell 8: 1519–1532 [DOI] [PMC free article] [PubMed] [Google Scholar]
- Nakai K., Horton P. (1999). PSORT: A program for detecting sorting signals in proteins and predicting their subcellular localization. Trends Biochem. Sci. 24: 34–36 [DOI] [PubMed] [Google Scholar]
- Pichersky E., Lewinsohn E. (2011). Convergent evolution in plant specialized metabolism. Annu. Rev. Plant Biol. 62: 549–566 [DOI] [PubMed] [Google Scholar]
- Preston J., Wheeler J., Heazlewood J., Li S.F., Parish R.W. (2004). AtMYB32 is required for normal pollen development in Arabidopsis thaliana. Plant J. 40: 979–995 [DOI] [PubMed] [Google Scholar]
- Quattrocchio F., Verweij W., Kroon A., Spelt C., Mol J., Koes R. (2006). PH4 of Petunia is an R2R3 MYB protein that activates vacuolar acidification through interactions with basic-helix-loop-helix transcription factors of the anthocyanin pathway. Plant Cell 18: 1274–1291 [DOI] [PMC free article] [PubMed] [Google Scholar]
- Sablowski R.W.M., Moyano E., Culianez-Macia F.A., Schuch W., Martin C., Bevan M. (1994). A flower-specific Myb protein activates transcription of phenylpropanoid biosynthetic genes. EMBO J. 13: 128–137 [DOI] [PMC free article] [PubMed] [Google Scholar]
- Schwachtje J., Baldwin I.T. (2008). Why does herbivore attack reconfigure primary metabolism? Plant Physiol. 146: 845–851 [DOI] [PMC free article] [PubMed] [Google Scholar]
- Schwinn K., Venail J., Shang Y.J., Mackay S., Alm V., Butelli E., Oyama R., Bailey P., Davies K., Martin C. (2006). A small family of MYB-regulatory genes controls floral pigmentation intensity and patterning in the genus Antirrhinum. Plant Cell 18: 831–851 [DOI] [PMC free article] [PubMed] [Google Scholar]
- Shin B., Choi G., Yi H., Yang S., Cho I., Kim J., Lee S., Paek N.-C., Kim J.-H., Song P.-S., Choi G. (2002). AtMYB21, a gene encoding a flower-specific transcription factor, is regulated by COP1. Plant J. 30: 23–32 [DOI] [PubMed] [Google Scholar]
- Sønderby I.E., Burow M., Rowe H.C., Kliebenstein D.J., Halkier B.A. (2010). A complex interplay of three R2R3 MYB transcription factors determines the profile of aliphatic glucosinolates in Arabidopsis. Plant Physiol. 153: 348–363 [DOI] [PMC free article] [PubMed] [Google Scholar]
- Spelt C., Quattrocchio F., Mol J.N.M., Koes R. (2000). anthocyanin1 of petunia encodes a basic helix-loop-helix protein that directly activates transcription of structural anthocyanin genes. Plant Cell 12: 1619–1632 [DOI] [PMC free article] [PubMed] [Google Scholar]
- Spitzer B., et al. (2007). Reverse genetics of floral scent: Application of tobacco rattle virus-based gene silencing in Petunia. Plant Physiol. 145: 1241–1250 [DOI] [PMC free article] [PubMed] [Google Scholar]
- Spitzer-Rimon B., Marhevka E., Barkai O., Marton I., Edelbaum O., Masci T., Prathapani N.-K., Shklarman E., Ovadis M., Vainstein A. (2010). EOBII, a gene encoding a flower-specific regulator of phenylpropanoid volatiles’ biosynthesis in petunia. Plant Cell 22: 1961–1976 [DOI] [PMC free article] [PubMed] [Google Scholar]
- Stafford H.A. (1991). Flavonoid evolution: An enzymic approach. Plant Physiol. 96: 680–685 [DOI] [PMC free article] [PubMed] [Google Scholar]
- Tamagnone L., Merida A., Parr A., Mackay S., Culianez-Macia F.A., Roberts K., Martin C. (1998). The AmMYB308 and AmMYB330 transcription factors from Antirrhinum regulate phenylpropanoid and lignin biosynthesis in transgenic tobacco. Plant Cell 10: 135–154 [DOI] [PMC free article] [PubMed] [Google Scholar]
- Tamura K., Peterson D., Peterson N., Stecher G., Nei M., Kumar S. (2011). MEGA5: Molecular evolutionary genetics analysis using maximum likelihood, evolutionary distance, and maximum parsimony methods. Mol. Biol. Evol. 28: 2731–2739 [DOI] [PMC free article] [PubMed] [Google Scholar]
- Tieman D., Taylor M., Schauer N., Fernie A.R., Hanson A.D., Klee H.J. (2006). Tomato aromatic amino acid decarboxylases participate in synthesis of the flavor volatiles 2-phenylethanol and 2-phenylacetaldehyde. Proc. Natl. Acad. Sci. USA 103: 8287–8292 [DOI] [PMC free article] [PubMed] [Google Scholar]
- Toledo-Ortiz G., Huq E., Rodríguez-Concepción M. (2010). Direct regulation of phytoene synthase gene expression and carotenoid biosynthesis by phytochrome-interacting factors. Proc. Natl. Acad. Sci. USA 107: 11626–11631 [DOI] [PMC free article] [PubMed] [Google Scholar]
- Tzfira T., Tian G.-W., Lacroix B.T., Vyas S., Li J., Leitner-Dagan Y., Krichevsky A., Taylor T., Vainstein A., Citovsky V. (2005). pSAT vectors: A modular series of plasmids for autofluorescent protein tagging and expression of multiple genes in plants. Plant Mol. Biol. 57: 503–516 [DOI] [PubMed] [Google Scholar]
- Uimari A., Strommer J. (1997). Myb26: A MYB-like protein of pea flowers with affinity for promoters of phenylpropanoid genes. Plant J. 12: 1273–1284 [DOI] [PubMed] [Google Scholar]
- van der Fits L., Memelink J. (2000). ORCA3, a jasmonate-responsive transcriptional regulator of plant primary and secondary metabolism. Science 289: 295–297 [DOI] [PubMed] [Google Scholar]
- Van Moerkercke A., Haring M.A., Schuurink R.C. (2011). The transcription factor EMISSION OF BENZENOIDS II activates the MYB ODORANT1 promoter at a MYB binding site specific for fragrant petunias. Plant J. 67: 917–928 [DOI] [PubMed] [Google Scholar]
- Van Moerkercke A., Schauvinhold I., Pichersky E., Haring M.A., Schuurink R.C. (2009). A plant thiolase involved in benzoic acid biosynthesis and volatile benzenoid production. Plant J. 60: 292–302 [DOI] [PubMed] [Google Scholar]
- Verdonk J.C., Haring M.A., van Tunen A.J., Schuurink R.C. (2005). ODORANT1 regulates fragrance biosynthesis in petunia flowers. Plant Cell 17: 1612–1624 [DOI] [PMC free article] [PubMed] [Google Scholar]
- Vogt T. (2010). Phenylpropanoid biosynthesis. Mol. Plant 3: 2–20 [DOI] [PubMed] [Google Scholar]
- Wilkins O., Nahal H., Foong J., Provart N.J., Campbell M.M. (2009). Expansion and diversification of the Populus R2R3-MYB family of transcription factors. Plant Physiol. 149: 981–993 [DOI] [PMC free article] [PubMed] [Google Scholar]
- Zhang P., Chopra S., Peterson T. (2000). A segmental gene duplication generated differentially expressed myb-homologous genes in maize. Plant Cell 12: 2311–2322 [DOI] [PMC free article] [PubMed] [Google Scholar]
- Zhong R., Lee C., Ye Z.H. (2010). Evolutionary conservation of the transcriptional network regulating secondary cell wall biosynthesis. Trends Plant Sci. 15: 625–632 [DOI] [PubMed] [Google Scholar]
- Zvi M.M., Shklarman E., Masci T., Kalev H., Debener T., Shafir S., Ovadis M., Vainstein A. (2012). PAP1 transcription factor enhances production of phenylpropanoid and terpenoid scent compounds in rose flowers. New Phytol. 195: 335–345 [DOI] [PubMed] [Google Scholar]