Abstract
The role of electrical activity in axon guidance has been extensively studied in vitro. To better understand its role in the intact nervous system, we imaged intracellular Ca2+ in zebrafish primary motor neurons (PMN) during axon pathfinding in vivo. We found that PMN generate specific patterns of Ca2+ spikes at different developmental stages. Spikes arose in the distal axon of PMN and were propagated to the cell body. Suppression of Ca2+ spiking activity in single PMN led to stereotyped errors, but silencing all electrical activity had no effect on axon guidance, indicating that an activity-based competition rule regulates this process. This competition was not mediated by synaptic transmission. Combination of PlexinA3 knockdown with suppression of Ca2+ activity in single PMN produced a synergistic increase in the incidence of pathfinding errors. However, expression of PlexinA3 transcripts was not regulated by activity. Our results provide an in vivo demonstration of the intersection of spontaneous electrical activity with the PlexinA3 guidance molecule receptor in regulation of axon pathfinding.
Keywords: calcium transients, spontaneous activity, stochastic expression
Development of the nervous system involves the outgrowth of a complex network of axons to specific synaptic targets. Axon pathfinding to the target area is directed by interactions between the growth cone and guidance cues present in the environment (1, 2). Electrical activity has been considered to have a role by contributing to the fine tuning of connections (3, 4). However, evidence for a role of activity during early pathfinding decisions has been emerging (5–7). The mechanisms underlying such regulation remain unclear, but the response of neurons to chemotropic molecules in vitro is modulated by electrical activity (7, 8).
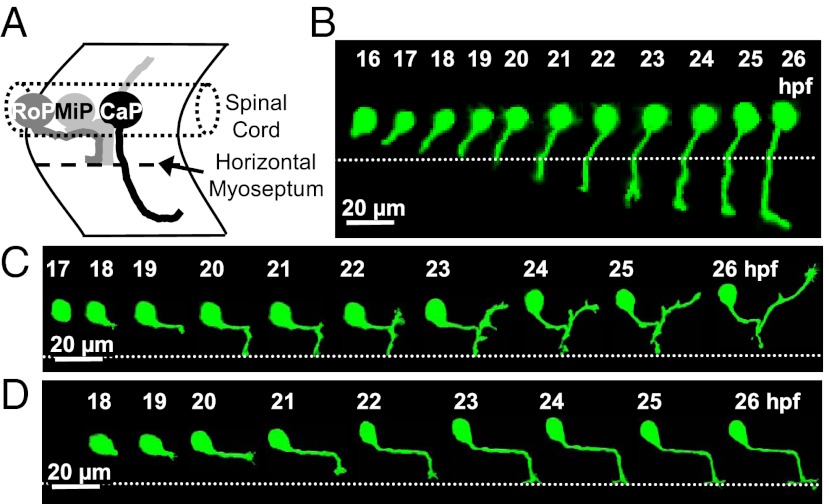
Here, we use the zebrafish embryo as an in vivo model to address the role of electrical activity in axon pathfinding. Each spinal hemisegment contains 3 primary motor neurons (PMN), named caudal primary (CaP), middle primary (MiP), and rostral primary (RoP), and ∼30 secondary motor neurons (SMN). During the first day of development, all three PMN axons pioneer into the periphery through a shared exit point, follow a common pathway to reach the horizontal myoseptum (HMS) and then diverge onto cell subtype-specific trajectories (9) (Fig. 1A).
Fig. 1.
PMN axon pathfinding in the developing zebrafish embryo. (A) Schematic lateral view of the three PMN (CaP, MiP, and RoP) showing their axonal trajectories at 24 hpf. Anterior to the left and dorsal to the top. (B–D) Time-lapse analysis of axon outgrowth of a single CaP (B), MiP (C), or RoP (D) expressing eGFP in WT embryos. Each neuron was imaged at 20-min intervals for 10 h. The dotted line indicates the HMS. CaP is present at 16 hpf and begins to extend a process by 17 hpf. At 19 hpf, coincident with its arrival at the HMS, the CaP axon pauses, resuming its outgrowth by 21 hpf. MiP starts axonogenesis by 18 hpf and is followed by RoP at 19 hpf. n = 10 neurons of each class in 10 embryos.
We characterize early calcium (Ca2+) signals in PMN of intact zebrafish embryos during axon outgrowth and investigate their role in pathfinding behavior. We show that spontaneous electrical activity is expressed in developing PMN during the entire process of axon pathfinding. Specific patterns of Ca2+ spiking activity are present at different developmental stages and expressed sequentially in CaP, MiP, and then RoP, beginning with the onset of axonogenesis. To investigate the role of Ca2+ activity, mosaic expression of an exogenous potassium channel (hKir2.1) was used to suppress electrical activity in single PMN. The results indicate that an activity-based competition rule regulates early pathfinding decisions of MiP and RoP axons.
The molecular mechanism of zebrafish PMN axonal migration has been studied intensively (10, 11). Semaphorin 3A1 (Sema3A1) and Sema3A2 guide PMN axons by repellent mechanisms through the neuropilin-1a (NRP1a)/PlexinA3 receptor complex (12–15). This interaction plays a crucial role early during guidance, when pioneering growth cones navigate to and then through spinal cord exit points. Here, we show that PlexinA3 signaling is modulated by spontaneous Ca2+ spike activity-dependent competition. Our results provide an in vivo demonstration of the role of early embryonic electrical activity in modulating the neuronal responses to a chemotropic factor.
Results
Characterization of the Outgrowth of PMN Axons.
We used a mosaic labeling strategy to study the entire process of axonogenesis, outgrowth, and pathfinding by single identified PMN. A DNA construct encoding Hb9:eGFP was injected at the one-cell stage to label small numbers of motor neurons (16). We focused on PMN located in medial segments of the spinal cord (somites 6–9) and restricted our analysis to stages before SMN begin axonogenesis. We tracked CaP axon outgrowth in vivo in zebrafish embryos paralyzed with α-bungarotoxin between 16 and 26 h postfertilization (hpf) (Movie S1). CaP initiates axonogenesis at 17 hpf; MiP and RoP axons initiate axonogenesis at 18 and 19 hpf, respectively. All pause at the HMS and then diverge to their specific muscle targets (Fig. 1 B–D).
Spontaneous Intracellular Ca2+ Transients in Developing PMN.
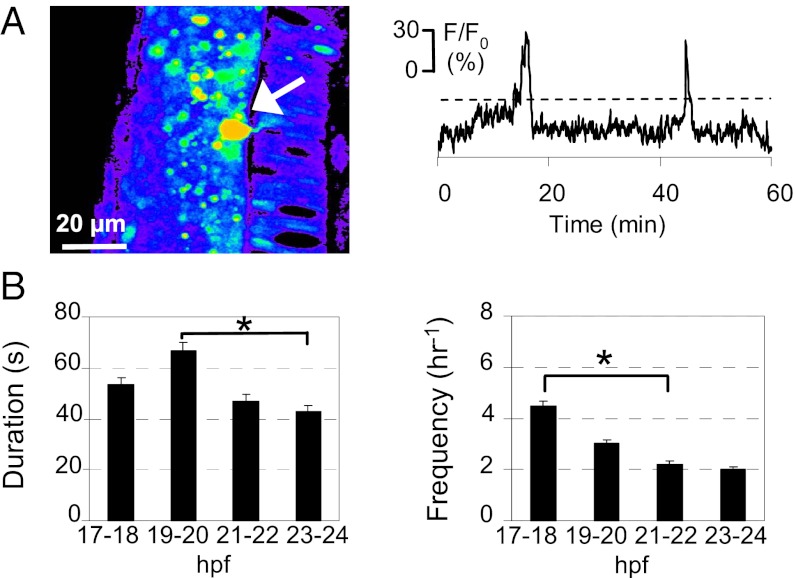
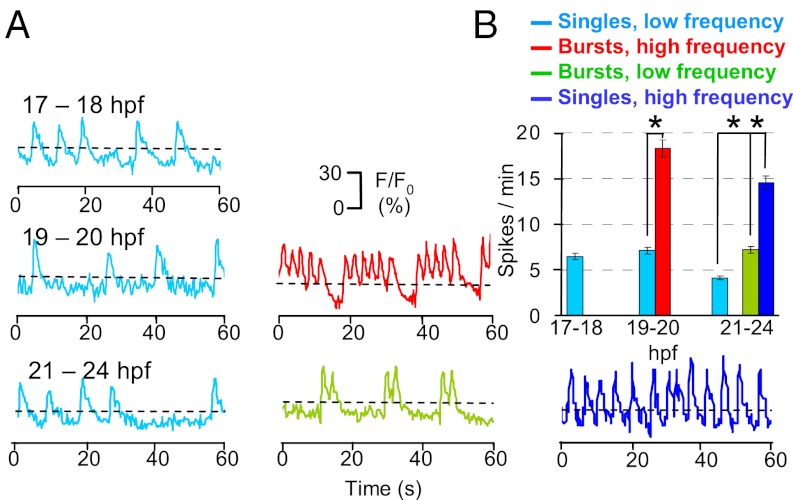
To determine the timing of spontaneous electrical activity in developing spinal motor neurons, we performed in vivo Ca2+ imaging in intact embryos during PMN pathfinding. We first injected transgenic Hb9:mGFP embryos (16) at the one-cell stage with calcium green-1 dextran (CGD) and imaged Ca2+ transients in the center of the somata of PMN and SMN between 17 and 24 hpf. GFP expression allowed us to identify PMN and SMN and restrict analysis to those cellular populations, although the absence of strong axonal CGD labeling precluded determination of CaP, MiP, or RoP identity. We recorded two types of spontaneous intracellular Ca2+ transients. Ca2+ waves were generated in both PMN (Fig. 2) and SMN (Fig. S1), with durations and frequencies that change during development. In contrast, we found that Ca2+ spikes were uniquely expressed in PMN and generated in different patterns at specific developmental stages. At 17–18 hpf (onset of CaP axon extension), spikes are single events at a frequency of 6.5 ± 0.5 min−1. Between 19 and 20 hpf (when CaP axons are paused at the HMS), PMN exhibit either single spikes (7.1 ± 0.8 min−1) or bursts of higher spike frequencies (18.3 ± 0.5 min−1). Beyond this developmental stage (when CaP axons resume their outgrowth), spikes occur in three patterns, all of which can be observed in individual neurons: single events (5.3 ± 0.6 min−1), high-frequency single events (15.3 ± 0.3 min−1), and bursts of lower spike frequency (7.1 ± 0.4 min−1) (Fig. 3).
Fig. 2.
Developing PMN generate spontaneous intracellular Ca2+ waves. (A) PMN (arrow) loaded with CGD in the spinal cord of a zebrafish embryo at 20–21 hpf. Dorsal to the left and caudal at the bottom. Images were captured at 0.2 Hz for 30 min, and fluorescence intensity was normalized to baseline. Fluorescence is displayed on a pseudocolor scale, where purple represents the lowest intensity and red represents the highest intensity. Changes in fluorescence intensity in a PMN are plotted as a function of time. Ca2+ waves were identified as fluorescence transients greater than 20% of ΔF/F0 (dashed lines), more than two times the SD of the baseline, and >20 s in duration, calculated as the width at half-maximum. (B) Duration and frequency of Ca2+ waves in PMN. n = 15–20 neurons from seven to nine embryos for each time period; values are means ± SEM. *P < 0.05.
Fig. 3.
Developing spinal PMN generate spontaneous intracellular Ca2+ spikes. (A) Changes in CGD fluorescence intensity in six PMN at three sets of developmental stages are plotted as a function of time. Images were captured at 4 Hz for 5 min, and fluorescence intensity was normalized to baseline. Ca2+ spikes were identified as fluorescence transients greater than 10% of ΔF/F0 (dashed lines), more than two times the SD of the baseline, and 2–4 s in duration, calculated as the width at half-maximum. (B) Frequency of Ca2+ spikes. n = 10–20 neurons from six to nine embryos for each period; values are means ± SEM. *P < 0.05.
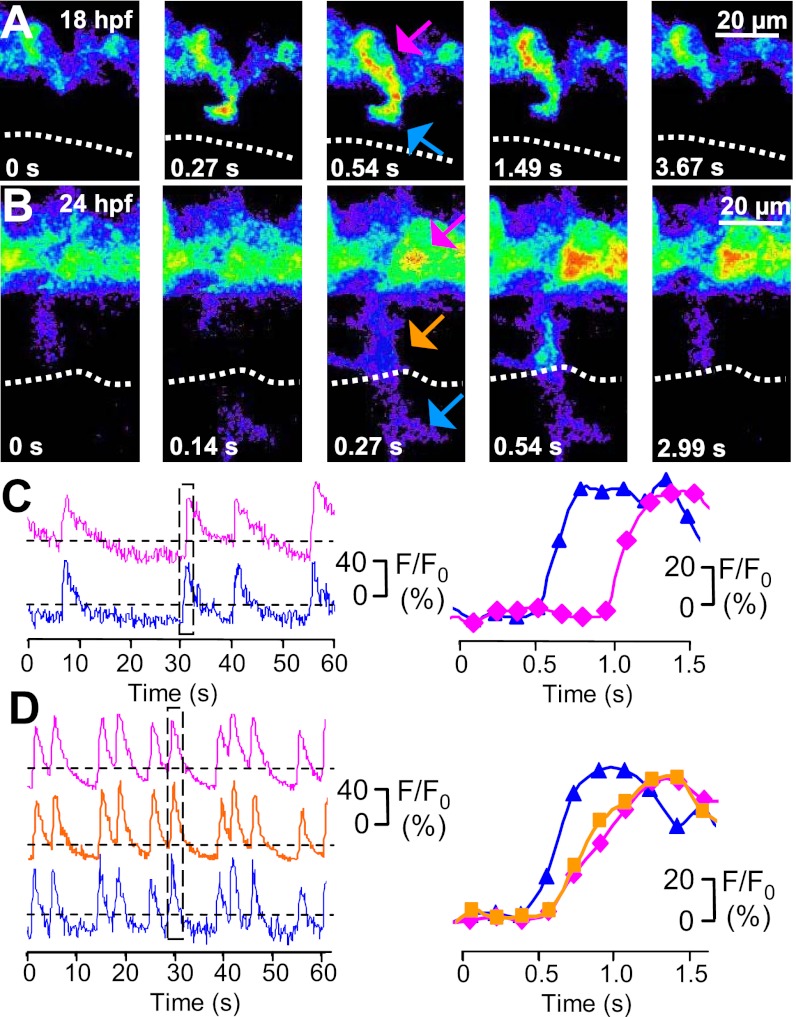
To reveal the identity of the PMN subclasses in which Ca2+ spiking activity occurs and characterize the patterns of activity exhibited throughout development in each subclass, we used Gal4s1020t/UAS (Upstream Activation Sequence):GCaMP3 double-transgenic embryos (17–19). This line drives expression of the genetically encoded Ca2+ indicator GCaMP3 in PMN and allowed us to identify Ca2+ spiking activity in the axons of specific PMN. We found that Ca2+ spikes are present both in the soma and axon of all subclasses. Moreover, image capture at 7.6 Hz revealed a delay in the signal between the distal portion of the axon and the cell body. A typical trajectory is illustrated by a time series of images and intensity traces of a single CaP at 18 and 24 hpf (Fig. 4 and Movies S2 and S3). Analysis of the times of peak spike fluorescence showed a delay between the distal axon and the soma at both developmental times (18 hpf, 0.36 ± 0.17 s; 24 hpf, 0.23 ± 0.19 s). The apparent simultaneity of Ca2+ spikes in the midaxon and soma at 24 hpf may reflect a greater rate of propagation between these two locations. A delay was also observed in the onset of the signal in the soma, calculated as the first time point to have a relative fluorescence intensity value greater than two times the SD of the baseline noise (18 hpf, 0.37 ± 0.20 s; 24 hpf, 0.20 ± 0.18 s). These findings suggest that Ca2+ signals from the distal axon propagate to the soma with higher velocities at later developmental stages (18 hpf, 48 ± 7 μm/s; 24 hpf, 112 ± 10 μm/s).
Fig. 4.
Ca2+ spikes are expressed both in the axon and soma of developing CaPs. (A and B) GCaMP3 activity acquired at 7.6 Hz in a single CaP of a single double-transgenic Hb9:Gal4/UAS:GCaMP3 embryo at 18 and 24 hpf. Dorsal is to the top and rostral is to the left. Fluorescence intensity is displayed on a pseudocolor scale like in Fig. 2. Dotted line indicates the HMS. (C and D) Time course of GCaMP3 activity in three regions (distal axon is blue, proximal axon is orange, and soma is magenta) from the same neuron. Intensity traces for regions identified by arrows are plotted as a function of time. The boxed regions in C Left and D Left are plotted in C Right and D Right, respectively. Fluorescence intensity was normalized to baseline. Dashed lines are the same as in Fig. 3. n = 50 spikes from 12 embryos (18 hpf), and n = 50 spikes from 5 embryos (24 hpf).
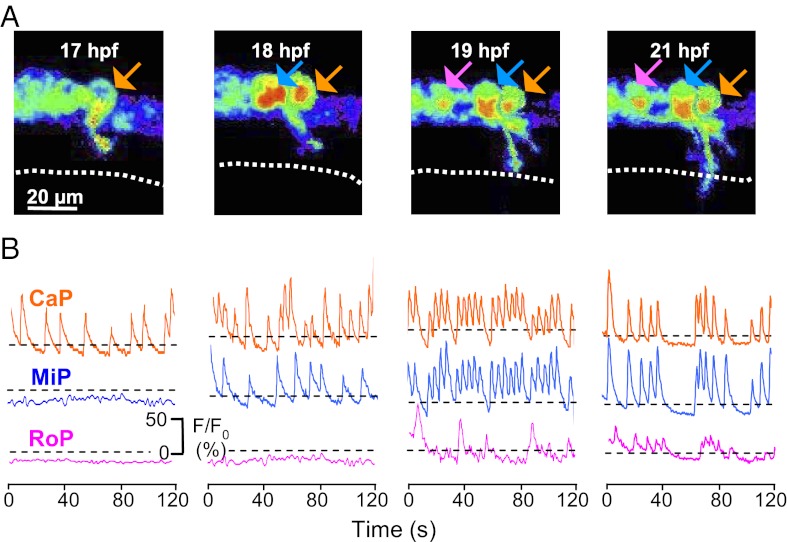
Time-lapse imaging also showed that all four patterns of Ca2+ spiking activity are expressed sequentially in single CaP, MiP, and then RoP, beginning with the onset of axonogenesis in each subpopulation (Fig. 5). At 17 hpf, a CaP extending a process out of the neural tube started generating single spikes (Movie S4). At 18 hpf, a second cell located rostrally to the CaP and later identified as a MiP started spiking (Movie S5). No correlation between CaP and MiP spike activity was observed at this stage. At 19 hpf, CaP and MiP exhibited correlated activity characterized by bursts at high spike frequencies, occurring at the time when CaP axons arrive at the HMS. At this stage, a third cell located rostrally to MiP started spiking without correlation with CaP and MiP activity. This cell was identified later as a RoP. RoPs did not generate bursts of high-frequency spikes, but all three PMN exhibited correlated spiking activity with single events and short doublet or triplet bursts beginning at 21 hpf (Movie S6).
Fig. 5.
Ca2+ spiking activity is expressed sequentially in CaP, MiP, and RoP and then becomes synchronized. (A) GCaMP3 activity acquired at 4 Hz in three neurons (arrows; CaP is in orange, MiP is in blue, and RoP is in magenta) in a single double-transgenic Hb9:Gal4/UAS:GCaMP3 embryo imaged through consecutive time-lapse movies from 17 to 21 hpf. Dorsal is to the top and rostral is to the left. Fluorescence intensity is displayed as in Fig. 2. Dotted line identifies the HMS. (B) Intensities for selected regions are plotted as a function of time. Dashed lines are the same as in Fig. 3. n = 6 CaP, MiP, and RoP neurons from six embryos.
Suppression of Ca2+ Spiking in Single PMN Leads to Errors in Axon Pathfinding.
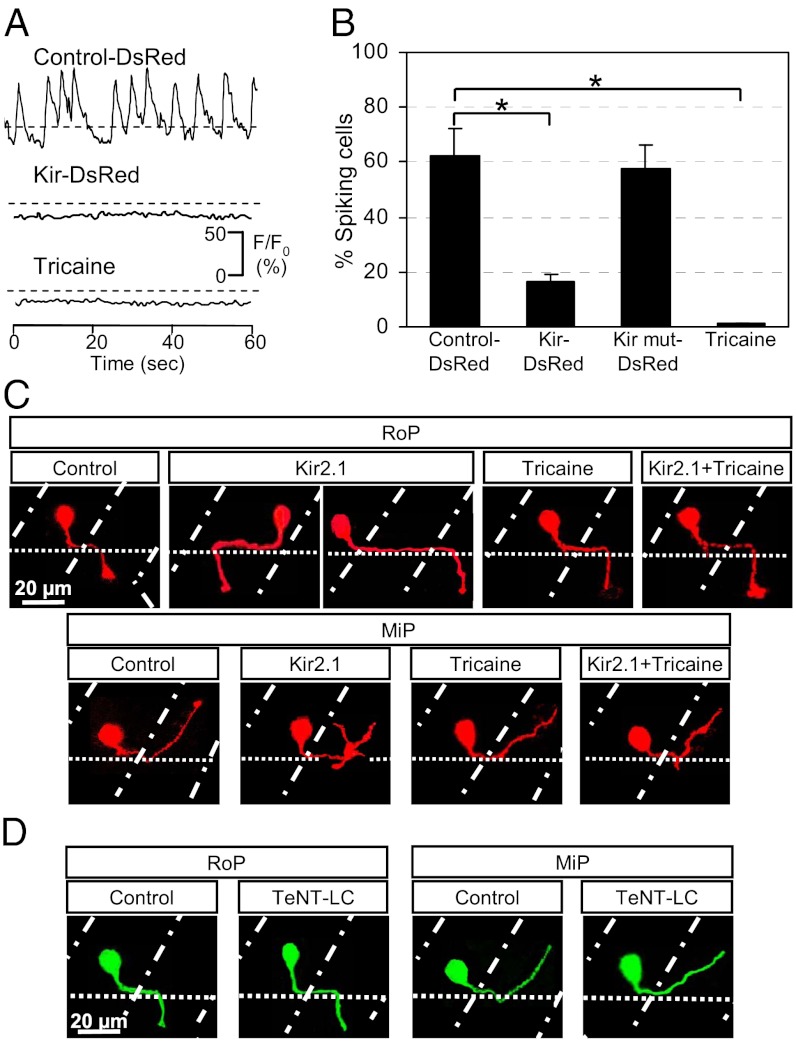
To identify the PMN subclasses in which activity-dependent processes are important, we manipulated their activity in two ways: globally, by treatment with tricaine (MS222), a voltage-dependent Na+ channel blocker, or stochastically, by expressing hKir2.1 in single PMN. We used the Gal4-UAS system to generate transiently transgenic embryos stochastically expressing Hb9:Gal4 (20) and a double UAS cassette driving hKir2.1 and DsRed (21). Spontaneous Ca2+ spiking activity in spinal PMN was suppressed by stochastic expression of hKir2.1 or abolished by exposure to 0.02% (wt/vol) tricaine for 15 min (Fig. 6A). Whereas 62% of PMN generated spikes in DsRed-expressing controls during a 5-min imaging period, only 16% spiked in those PMN cotransfected with DsRed and hKir2.1, and none spiked in those PMN exposed to tricaine (Fig. 6B). In animals expressing a nonconducting mutant version of hKir2.1 (Kir mut) (21, 22), the percentage of active neurons was 57%, comparable with controls. In contrast, Ca2+ waves were not suppressed by tricaine or hKir2.1.
Fig. 6.
Suppression of Ca2+ spiking activity in single PMN leads to errors in axon pathfinding. (A) Ca2+ spikes are blocked by stochastic expression of hKir2.1 or exposure to 0.02% tricaine for 15 min. n = 20 for each condition. (B) Percentage of PMN exhibiting Ca2+ spiking activity at 19 hpf. n = 20 for each group; values are means ± SEM. *P < 0.0005 compared with control. (C) RoP and MiP neurons expressing hKir2.1 bypass the exit point or project rostrally and exhibit extra branching. Neither tricaine nor Kir2.1 + tricaine leads to errors in axon pathfinding. Control, embryos injected with Hb9:Gal4 and UAS:DsRed plasmids; Kir2.1, embryos injected with Hb9:Gal4 and UAS:DsRed::UAS:hKir2.1 plasmids; Tricaine, embryos raised in the presence of 0.02% tricaine; Kir2.1 + Tricaine, embryos expressing hKir2.1 and raised in the presence of tricaine. (D) Tetanus toxin expression does not cause pathfinding errors. Control, embryos injected with Hb9:Gal4 and UAS:eGFP plasmids; TeNT-LC, embryos injected with Hb9:Gal4 and UAS:TeNT-LC:eGFP plasmids. (C and D) Dorsal is to the top and rostral is to the left. Dot-dash lines mark lateral edges of the myotomes; dotted lines mark the ventral edge of the spinal cord. n ≥ 30 cells from ≥30 24-hpf embryos for each group.
We next examined the effect of hKir2.1 expression on PMN axon pathfinding in intact living embryos. Suppression of Ca2+ spiking activity by hKir2.1 expression in single PMN led to substantial errors in MiP and RoP but not CaP axon pathfinding (Figs. 6C and 7A and B). Errors comprise intraspinal pathfinding mistakes made by 26% of RoPs (8/30) and aberrant branching over the myotome in 20% of MiPs (6/30). Misguided RoP growth cones either orient away from the endogenous spinal cord exit point (13%, 4/30) or extend to the endogenous exit point but bypass it (13%, 4/30). In contrast, expression of Kir mut had no effect on axon pathfinding (n = 20 for each subclass). These results suggest that axon pathfinding regulation by hKir2.1 is a result of hKir2.1 channel activity, acting through the suppression of electrical excitability.
Fig. 7.
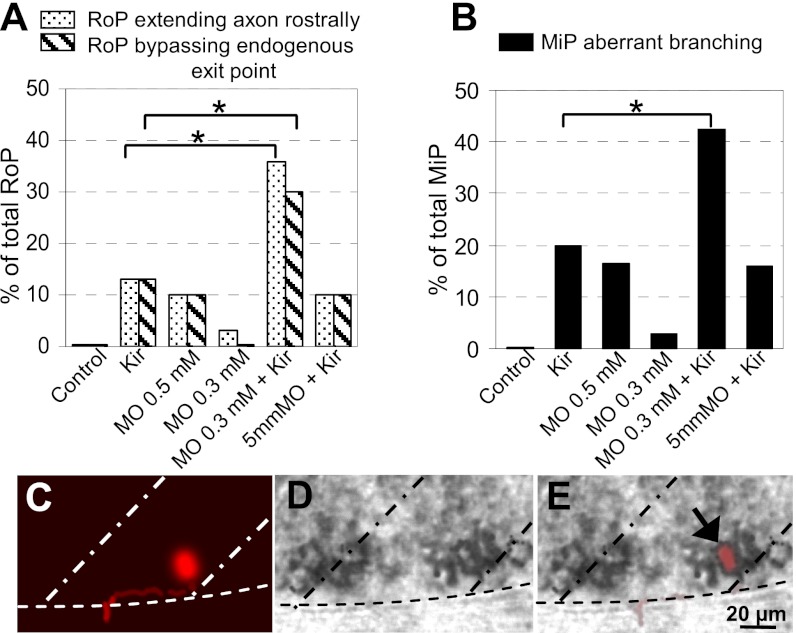
Synergistic interaction of hKir2.1 and PlexinA3. Percentage of (A) RoPs extending their axons rostrally or bypassing the endogenous exit point or (B) MiP axons with aberrant branching, including data from Fig. 6. Combination of a subthreshold concentration of PlexinA3 MO and hKir2.1 expression generates an increase in the incidence of pathfinding errors. Control, embryos injected with Hb9:Gal4 and UAS:DsRed plasmids; Kir, embryos injected with Hb9:Gal4 and UAS:DsRed::UAS:hKir2.1 plasmids; MO 0.5 mM, embryos injected with 0.5 mM PlexinA3 MO and Hb9:Gal4 and UAS:DsRed plasmids; MO 0.3 mM, embryos injected with 0.3 mM PlexinA3 MO and Hb9:Gal4 and UAS:DsRed plasmids; MO 0.3 mM + Kir, embryos injected with 0.3 mM PlexinA3 MO and Hb9:Gal4 and UAS:DsRed::UAS:hKir2.1 plasmids; 5 mm MO + Kir, embryos injected with 0.3 mM MO with five mismatched bases based on PlexinA3 MO and Hb9:Gal4 and UAS:DsRed::UAS:hKir2.1 plasmids. n = 30–40 neurons from ≥30 24-hpf embryos for each condition. *P < 0.05 using a Fisher exact test comparing PlexinA3 MO + Kir-injected with Kir-injected alone. (C–E) Single PMN expressing hKir2.1 and DsRed and exhibiting a pathfinding error expresses PlexinA3 mRNA. (C) A DsRed immunopositive RoP extending its axon rostrally. (D) In situ hybridization shows strong expression of PlexinA3 mRNA. (E) Merge of C and D. Dorsal is to the top and rostral is to the left. Dot-dash lines mark lateral edges of the myotomes; dotted lines mark the ventral edge of the spinal cord. n = 4 MiPs, and n = 4 RoPs.
Pioneering studies of the development of mammalian peripheral motor axons have shown that synaptic connectivity is governed by activity-based competition rules (23). During development of mammalian sensory maps under competitive conditions, neurons that are deficient in synaptic release or neuronal firing fail to establish or maintain precise connectivity (23, 24). We therefore determined whether pathfinding errors by hKir2.1-expressing axons were a consequence of silencing single neurons surrounded by active ones. To achieve this goal, we performed imaging experiments in which the activity of nearby cells was also suppressed either by raising the embryos in the presence of tricaine or injecting one cell-stage embryos with mRNA encoding hKir2.1. Neither of these treatments affected the axon pathfinding behavior of PMN expressing DsRed alone, but both restored normal axon pathfinding to single PMN expressing hKir2.1 and DsRed (Fig. 6C). This pharmacological rescue from the effects of single-cell inhibition of activity indicates that competition mediated by Ca2+ signaling leads to guidance errors when hKir2.1 is expressed.
The effects of hKir2.1 expression could result directly from the suppression of neuronal excitation or indirectly from blocking neurotransmitter release that is normally triggered by electrical excitation. To distinguish between these two possibilities, we specifically blocked transmitter release in single PMN using targeted expression of tetanus toxin light chain fused to eGFP (TeNT-LC:eGFP) (25). We coinjected the Hb9:Gal4 and UAS:TeNT-LC:eGFP constructs into one cell-stage embryos and analyzed axon trajectories of eGFP-expressing PMN in 24-hpf embryos. Expression of TeNT-LC in single PMN did not affect axon pathfinding (Fig. 6D). Thus, spontaneous activity but not SNARE-dependent transmitter release is required for establishment of normal axon projections by developing PMN.
Modulation of PlexinA3 Signaling by Ca2+ Spiking Activity.
PlexinA3 plays a critical role in intraspinal motor axon guidance in zebrafish embryos, and mutation of the gene leads to substantial errors in motor axon growth and pathfinding (15) resembling those mistakes that we observed by expressing hKir2.1 in single PMN. To investigate whether PlexinA3 is part of the molecular mechanism underlying the regulation of axonal pathfinding by Ca2+ activity, we tested for synergy between Ca2+ spiking activity and PlexinA3. Injection of a PlexinA3 morpholino (MO; 0.5 mM) generated errors in axon guidance (14) phenocopied by hKir2.1 expression. We then performed pairwise coinjections of hKir2.1 cDNA with the PlexinA3 MO at a subthreshold concentration and compared the incidence of axonal pathfinding errors elicited by injecting PlexinA3 MO alone, expressing hKir2.1 stochastically in PMN, and the combination of these two perturbations. Coinjections of PlexinA3 MO (0.3 mM) with Hb9:Gal4 and UAS:hKir2.1::UAS:DsRed constructs induced a significant increase in the incidence of pathfinding errors in PMN compared with embryos coinjected with 0.3 mM PlexinA3 MO and Hb9:Gal4 and UAS:DsRed constructs or coinjected with Hb9:Gal4 and UAS:hKir2.1::UAS:DsRed constructs (Fig. 7A and B). As a control, hKir2.1 was coinjected with a five-base mismatch PlexinA3 MO (0.3 mM) (14), which elicited aberrant growth of motor axons comparable with the abnormal axon outgrowth generated by the expression of hKir2.1 alone. The synergistic effects observed in these experiments suggest an intersection of PlexinA3 signaling with Ca2+ spiking activity in regulation of axon pathfinding. However, PMN exhibited patterns of activity that were not different from controls after MO knockdown of PlexinA3 (0.5 mM) (Fig. S2). To determine whether PlexinA3 expression itself is regulated by Ca2+ activity, we generated pathfinding errors in single PMN by silencing their activity with stochastic expression of hKir2.1 and then performed in situ hybridization to assess the expression of PlexinA3 in these single neurons. Inactive PMN exhibited PlexinA3 expression indistinguishable from the expression of its surrounding active neurons (Fig. 7C–E).
Discussion
We have used the zebrafish embryo to address the role of electrical activity in axon pathfinding in vivo. We show that specific patterns of Ca2+ spiking activity are present at different developmental stages and expressed sequentially in CaP, MiP, and then RoP, coincident with the onset of axonogenesis. We find that suppressing Ca2+ spiking activity selectively in single PMN but not all PMN leads to errors in axon pathfinding of MiP and RoP axons, indicating that an activity-based competition rule regulates their early pathfinding decisions. Moreover, we provide evidence for a mechanism by which Ca2+ spiking activity regulates axon pathfinding behavior in vivo, involving modulation of signaling by the chemotropic receptor PlexinA3.
Spontaneous Ca2+ Activity in Developing PMN During Pathfinding Behavior.
Spinal PMN exhibit two types of Ca2+ transients throughout the process of axon pathfinding. The events that we detected as Ca2+ waves likely correspond to cell-autonomous Ca2+ events observed in axon-less cells of the 19- to 26-hpf embryo (26). Recent work using a genetically encoded Ca2+ indicator showed that ventral spinal neurons exhibit Ca2+ spiking activity during development of the motor network (19, 27). We show that Ca2+ spikes are expressed both in the soma and axon of developing PMN and find that the onset of the Ca2+ transient is delayed between the distal portion of the axon and the cell body. Rapid long-range signaling within the neuronal cytoplasm may be mediated by spread of second messengers. Local elevation of cAMP at an advancing neuronal growth cone leads to inhibition of growth of other sibling neurites (28).
Zebrafish PMN axons exhibit bursts of high-frequency spikes and stall at the HMS, the point at which they seem to decide which trajectory to follow. High frequencies of Ca2+ transients in growth cones of axons extending in the Xenopus spinal cord also cause stalling or neurite retraction at decision points (5). The delay in the onset of Ca2+ spiking activity among the three subtypes of PMN may be caused by the differences in electrical properties of CaPs and MiPs before axonal growth (29). Our data show that only MiP and RoP axon pathfinding are regulated by spontaneous Ca2+ spikes. The basis of this differential effect is unknown, but it could involve differences in the expression of molecular markers. In zebrafish, PMN express subtype-specific patterns of LIM (Lin11/Isl1/Mec3) genes, which act as transcription factors (30). This fact supports the idea that PMN subtypes use different cues to extend axons or branch and that these processes could be regulated by electrical activity depending on the combinations of guidance cues to which each subtype is programmed to respond.
Spontaneous Ca2+ activity evolves from uncorrelated to correlated events. Adjacent PMN are stereotypically sequentially incorporated into an active network, because CaP is followed by MiP and then RoP when they each reach the HMS, suggesting that electrical connections among these cells are established at that point. Changes in global activity patterns are associated with strengthening of functional connectivity between ipsilateral neurons, suggesting that early activity is cell-autonomous and later activity depends on network interactions (19). Ipsilateral network interactions in the zebrafish spinal cord are mediated through electrical synapses, and gap junctions play a key role in the propagation of correlated spontaneous activity (31).
Regulation of Axon Pathfinding by in Vivo Activity-Based Competition.
Neuronal activity is necessary for normal development of chick motor neuron axon projections (6, 32) and for axonal pathfinding in the developing visual (21, 33, 34), olfactory (24, 35), and somatosensory systems (36). The activity-based competition that we observed is not mediated by synaptic transmission, because suppressing neurotransmitter release by expression of tetanus toxin light chain in single neurons failed to produce errors in axon guidance. Spontaneous electrical activity in retinal ganglion cells (RGCs) is needed, independent of synaptic transmission, for ordering of retinotopy and elimination of exuberant retinal axons in the mouse retinotectal system (7). However, growth and branching of RGC axon arbors in the zebrafish optic tectum are governed by activity-based competition between neighboring axons that seems to be mediated by synaptic transmission (21, 25). Similarly, suppression of neuronal activity or synaptic release in small populations of olfactory sensory neurons results in more severe phenotypes than suppressing activity in all neurons (24). Suppression of spiking and synaptic release under competitive circumstances could result in a growth advantage for active neurons compared with a subpopulation of inactive cells, potentially through axon–axon interactions. Single-cell labeling of CaP and MiP revealed intimate contact between their axons, suggesting that the CaP axon could be a guidepost for MiP and RoP axons, directing them to turn and exit the spinal cord (37).
The role of neural activity is likely to be permissive rather than instructive, because global suppression of neural activity had no effect on axon pathfinding of PMN. Ca2+ activity might be required for the appropriate action of extrinsic factors by creating an appropriate environment within spinal neurons to allow the correct developmental program to unfold.
Modulation of PlexinA3 Signaling by Ca2+ Spiking Activity in Vivo.
In vitro studies have shown that activity can influence the response of an axon to guidance cues (8, 38). However, the mechanisms by which neural activity regulates axonal pathfinding remain incompletely resolved. We show that PlexinA3 and spontaneous Ca2+ spiking activity interact to specify spinal cord exit points and regulate axon branching.
How could neuronal activity affect axon pathfinding of developing spinal PMN? One possibility is that neuronal activity regulates the expression of membrane receptors for axon guidance cues in the growth cones of PMN axons. In the developing chick spinal cord, inhibition of motor neuron bursting activity prevents the appearance of normal expression patterns of EphA4 and polysialylated neural cell adhesion molecule in distal axons, leading to motor axon pathfinding errors (6). However, spontaneous activity of RGCs is necessary for ordering of the retinotopic map in the mouse tectum independent of changes in the expression level of either ephrin-A5 or its EphA5 receptor (7). In addition, Drosophila motor neuron responses to Sema2a through the PlexinB receptor are modulated by electrical activity without detectable changes in PlexinB receptor levels (39). We find that the expression level of PlexinA3 transcripts is similar in single Kir-expressing PMN and active neighbors, arguing that the interaction between Ca2+ activity and PlexinA3 is posttranscriptional. Electrical activity may regulate neuronal signal transduction pathways through changes in Ca2+ and cyclic nucleotide levels (8) or modulating the activity of downstream effectors (40, 41) in a manner required for proper growth cone responses to target-derived guidance cues. Significantly, guidance cues can cause growth cone membrane potential shifts, and the polarity of these shifts is a determinant of the direction of growth cone turning (42). Consistent with this finding, constitutive expression of hKir 2.1 could prevent Sema3A from shifting the membrane potential and consequently abolish Sema3A-induced repulsion. As a result, expression of hKir2.1 and MO knockdown of PlexinA3 would lead to the same pathfinding phenotype.
Independent of the underlying mechanism, our data support a model whereby spontaneous Ca2+ activity regulates the motor neuron’s response to a chemotropic factor, modulating PlexinA3 receptor signaling. Retinocollicular mapping is strongly dependent on relative differences in EphA signaling that exist between neighboring RGCs (43). The level of PlexinA3 signaling seems to be interpreted similarly by developing PMN in the context of competition with their neighbors for synaptic targets, axon branching pathways, or other features of the developing spinal cord that are present in limiting amounts.
Methods
Imaging Axon Outgrowth.
Embryos stochastically expressing the Hb9:GFP construct were paralyzed with 20 μM α-bungarotoxin and kept at 28.5 °C in a heated chamber. Live embryos were imaged at 30-min intervals from 16 to 26 hpf.
Calcium Imaging.
CGD (10 mM, 10 kDa; Molecular Probes) was injected into one cell-stage Hb9:mGFP embryos, and progeny of Gal4s1020t/UAS:GCaMP3 doubly transgenic fish were identified for GCaMP3 expression. Live embryos were imaged at 0.2 Hz for 30 min, 4 Hz for 5 min, or 7.6 Hz for 2 min.
Mosaic Suppression of Activity and Transmitter Release.
The UAS:DsRed, UAS:DsRed::UAS:hKir2.1, UAS:DsRed::UAS:hKir2.1mut (21), or UAS:TeNT-Lc:EGFP (25) plasmids were coinjected with the Hb9:Gal4 construct (20) at a concentration of 25 ng/μL in 0.1 M KCl into one to four cell-stage zebrafish embryos.
A detailed description of experimental procedures is provided in SI Methods.
Supplementary Material
Acknowledgments
We thank D. Meyer, E. Isacoff, S. Smith, M. Meyer, M. Granato, and H. Baier for gifts of the Hb9:eGFP, Hb9:Gal4, UAS:DsRed, UAS:DsReD::UAS:hKir2.1, UAS:DsReD::UAS:hKir2.1mut, and UAS:TeNT-Lc:EGFP plasmids, the PlexinA3 probe, and the Tg(Gal4s1020t/UAS:GCaMP3) line; D. Yelon, L. Pandolfo, K. McDaniel, and R. Shehane for invaluable assistance with animal husbandry and in situ protocols; A. De La Torre for technical assistance; and members of our laboratory for helpful discussions. We also thank D. Berg, Y. Jin, and Y. Zou for their critical reviews of the manuscript. This work was supported by a Human Frontiers in Science Program fellowship (P.V.P.) and National Institutes of Health Grants NS15818 and NS57690 (to N.C.S.).
Footnotes
The authors declare no conflict of interest.
This article is a PNAS Direct Submission.
This article contains supporting information online at www.pnas.org/lookup/suppl/doi:10.1073/pnas.1213048110/-/DCSupplemental.
References
- 1.Tessier-Lavigne M, Goodman CS. The molecular biology of axon guidance. Science. 1996;274(5290):1123–1133. doi: 10.1126/science.274.5290.1123. [DOI] [PubMed] [Google Scholar]
- 2.Dickson BJ. Molecular mechanisms of axon guidance. Science. 2002;298(5600):1959–1964. doi: 10.1126/science.1072165. [DOI] [PubMed] [Google Scholar]
- 3.Katz LC, Shatz CJ. Synaptic activity and the construction of cortical circuits. Science. 1996;274(5290):1133–1138. doi: 10.1126/science.274.5290.1133. [DOI] [PubMed] [Google Scholar]
- 4.Erzurumlu RS, Kind PC. Neural activity: Sculptor of ‘barrels’ in the neocortex. Trends Neurosci. 2001;24(10):589–595. doi: 10.1016/s0166-2236(00)01958-5. [DOI] [PMC free article] [PubMed] [Google Scholar]
- 5.Gomez TM, Spitzer NC. In vivo regulation of axon extension and pathfinding by growth-cone calcium transients. Nature. 1999;397(6717):350–355. doi: 10.1038/16927. [DOI] [PubMed] [Google Scholar]
- 6.Hanson MG, Landmesser LT. Normal patterns of spontaneous activity are required for correct motor axon guidance and the expression of specific guidance molecules. Neuron. 2004;43(5):687–701. doi: 10.1016/j.neuron.2004.08.018. [DOI] [PubMed] [Google Scholar]
- 7.Nicol X, et al. cAMP oscillations and retinal activity are permissive for ephrin signaling during the establishment of the retinotopic map. Nat Neurosci. 2007;10(3):340–347. doi: 10.1038/nn1842. [DOI] [PubMed] [Google Scholar]
- 8.Ming G, Henley J, Tessier-Lavigne M, Song H, Poo M. Electrical activity modulates growth cone guidance by diffusible factors. Neuron. 2001;29(2):441–452. doi: 10.1016/s0896-6273(01)00217-3. [DOI] [PubMed] [Google Scholar]
- 9.Myers PZ, Eisen JS, Westerfield M. Development and axonal outgrowth of identified motoneurons in the zebrafish. J Neurosci. 1986;6(8):2278–2289. doi: 10.1523/JNEUROSCI.06-08-02278.1986. [DOI] [PMC free article] [PubMed] [Google Scholar]
- 10.Beattie CE. Control of motor axon guidance in the zebrafish embryo. Brain Res Bull. 2000;53(5):489–500. doi: 10.1016/s0361-9230(00)00382-8. [DOI] [PubMed] [Google Scholar]
- 11.Rodino-Klapac LR, Beattie CE. Zebrafish topped is required for ventral motor axon guidance. Dev Biol. 2004;273(2):308–320. doi: 10.1016/j.ydbio.2004.06.007. [DOI] [PubMed] [Google Scholar]
- 12.Roos M, Schachner M, Bernhardt RR. Zebrafish semaphorin Z1b inhibits growing motor axons in vivo. Mech Dev. 1999;87(1–2):103–117. doi: 10.1016/s0925-4773(99)00153-7. [DOI] [PubMed] [Google Scholar]
- 13.Feldner J, et al. Neuropilin-1a is involved in trunk motor axon outgrowth in embryonic zebrafish. Dev Dyn. 2005;234(3):535–549. doi: 10.1002/dvdy.20520. [DOI] [PubMed] [Google Scholar]
- 14.Feldner J, et al. PlexinA3 restricts spinal exit points and branching of trunk motor nerves in embryonic zebrafish. J Neurosci. 2007;27(18):4978–4983. doi: 10.1523/JNEUROSCI.1132-07.2007. [DOI] [PMC free article] [PubMed] [Google Scholar]
- 15.Palaisa KA, Granato M. Analysis of zebrafish sidetracked mutants reveals a novel role for Plexin A3 in intraspinal motor axon guidance. Development. 2007;134(18):3251–3257. doi: 10.1242/dev.007112. [DOI] [PubMed] [Google Scholar]
- 16.Flanagan-Steet H, Fox MA, Meyer D, Sanes JR. Neuromuscular synapses can form in vivo by incorporation of initially aneural postsynaptic specializations. Development. 2005;132(20):4471–4481. doi: 10.1242/dev.02044. [DOI] [PubMed] [Google Scholar]
- 17.Scott EK, et al. Targeting neural circuitry in zebrafish using GAL4 enhancer trapping. Nat Methods. 2007;4(4):323–326. doi: 10.1038/nmeth1033. [DOI] [PubMed] [Google Scholar]
- 18.Del Bene F, et al. Filtering of visual information in the tectum by an identified neural circuit. Science. 2010;330(6004):669–673. doi: 10.1126/science.1192949. [DOI] [PMC free article] [PubMed] [Google Scholar]
- 19.Warp E, et al. Emergence of patterned activity in the developing zebrafish spinal cord. Curr Biol. 2012;22(2):93–102. doi: 10.1016/j.cub.2011.12.002. [DOI] [PMC free article] [PubMed] [Google Scholar]
- 20.Wyart C, et al. Optogenetic dissection of a behavioural module in the vertebrate spinal cord. Nature. 2009;461(7262):407–410. doi: 10.1038/nature08323. [DOI] [PMC free article] [PubMed] [Google Scholar]
- 21.Hua JY, Smear MC, Baier H, Smith SJ. Regulation of axon growth in vivo by activity-based competition. Nature. 2005;434(7036):1022–1026. doi: 10.1038/nature03409. [DOI] [PubMed] [Google Scholar]
- 22.Burrone J, O’Byrne M, Murthy VN. Multiple forms of synaptic plasticity triggered by selective suppression of activity in individual neurons. Nature. 2002;420(6914):414–418. doi: 10.1038/nature01242. [DOI] [PubMed] [Google Scholar]
- 23.LeVay S, Wiesel TN, Hubel DH. The development of ocular dominance columns in normal and visually deprived monkeys. J Comp Neurol. 1980;191(1):1–51. doi: 10.1002/cne.901910102. [DOI] [PubMed] [Google Scholar]
- 24.Yu CR, et al. Spontaneous neural activity is required for the establishment and maintenance of the olfactory sensory map. Neuron. 2004;42(4):553–566. doi: 10.1016/s0896-6273(04)00224-7. [DOI] [PubMed] [Google Scholar]
- 25.Ben Fredj N, et al. Synaptic activity and activity-dependent competition regulates axon arbor maturation, growth arrest, and territory in the retinotectal projection. J Neurosci. 2010;30(32):10939–10951. doi: 10.1523/JNEUROSCI.1556-10.2010. [DOI] [PMC free article] [PubMed] [Google Scholar]
- 26.Ashworth R, Bolsover SR. Spontaneous activity-independent intracellular calcium signals in the developing spinal cord of the zebrafish embryo. Brain Res Dev Brain Res. 2002;139(2):131–137. doi: 10.1016/s0165-3806(02)00538-2. [DOI] [PubMed] [Google Scholar]
- 27.Muto A, et al. Genetic visualization with an improved GCaMP calcium indicator reveals spatiotemporal activation of the spinal motor neurons in zebrafish. Proc Natl Acad Sci USA. 2011;108(13):5425–5430. doi: 10.1073/pnas.1000887108. [DOI] [PMC free article] [PubMed] [Google Scholar]
- 28.Shelly M, et al. Local and long-range reciprocal regulation of cAMP and cGMP in axon/dendrite formation. Science. 2010;327(5965):547–552. doi: 10.1126/science.1179735. [DOI] [PubMed] [Google Scholar]
- 29.Moreno RL, Ribera AB. Zebrafish motor neuron subtypes differ electrically prior to axonal outgrowth. J Neurophysiol. 2009;102(4):2477–2484. doi: 10.1152/jn.00446.2009. [DOI] [PMC free article] [PubMed] [Google Scholar]
- 30.Appel B, et al. Motoneuron fate specification revealed by patterned LIM homeobox gene expression in embryonic zebrafish. Development. 1995;121(12):4117–4125. doi: 10.1242/dev.121.12.4117. [DOI] [PubMed] [Google Scholar]
- 31.Saint-Amant L, Drapeau P. Synchronization of an embryonic network of identified spinal interneurons solely by electrical coupling. Neuron. 2001;31(6):1035–1046. doi: 10.1016/s0896-6273(01)00416-0. [DOI] [PubMed] [Google Scholar]
- 32.Hanson MG, Landmesser LT. Increasing the frequency of spontaneous rhythmic activity disrupts pool-specific axon fasciculation and pathfinding of embryonic spinal motoneurons. J Neurosci. 2006;26(49):12769–12780. doi: 10.1523/JNEUROSCI.4170-06.2006. [DOI] [PMC free article] [PubMed] [Google Scholar]
- 33.Hensch TK, Fagiolini M. Excitatory-inhibitory balance and critical period plasticity in developing visual cortex. Prog Brain Res. 2005;147:115–124. doi: 10.1016/S0079-6123(04)47009-5. [DOI] [PubMed] [Google Scholar]
- 34.Mizuno H, Hirano T, Tagawa Y. Evidence for activity-dependent cortical wiring: Formation of interhemispheric connections in neonatal mouse visual cortex requires projection neuron activity. J Neurosci. 2007;27(25):6760–6770. doi: 10.1523/JNEUROSCI.1215-07.2007. [DOI] [PMC free article] [PubMed] [Google Scholar]
- 35.Serizawa S, et al. A neuronal identity code for the odorant receptor-specific and activity-dependent axon sorting. Cell. 2006;127(5):1057–1069. doi: 10.1016/j.cell.2006.10.031. [DOI] [PubMed] [Google Scholar]
- 36.Wang CL, et al. Activity-dependent development of callosal projections in the somatosensory cortex. J Neurosci. 2007;27(42):11334–11342. doi: 10.1523/JNEUROSCI.3380-07.2007. [DOI] [PMC free article] [PubMed] [Google Scholar]
- 37.Eisen JS, Pike SH, Debu B. The growth cones of identified motoneurons in embryonic zebrafish select appropriate pathways in the absence of specific cellular interactions. Neuron. 1989;2(1):1097–1104. doi: 10.1016/0896-6273(89)90234-1. [DOI] [PubMed] [Google Scholar]
- 38.Nishiyama M, et al. Cyclic AMP/GMP-dependent modulation of Ca2+ channels sets the polarity of nerve growth-cone turning. Nature. 2003;423(6943):990–995. doi: 10.1038/nature01751. [DOI] [PubMed] [Google Scholar]
- 39.Carrillo RA, Olsen DP, Yoon KS, Keshishian H. Presynaptic activity and CaMKII modulate retrograde semaphorin signaling and synaptic refinement. Neuron. 2010;68(1):32–44. doi: 10.1016/j.neuron.2010.09.005. [DOI] [PMC free article] [PubMed] [Google Scholar]
- 40.Blair NT, Kaczmarek JS, Clapham DE. Intracellular calcium strongly potentiates agonist-activated TRPC5 channels. J Gen Physiol. 2009;133(5):525–546. doi: 10.1085/jgp.200810153. [DOI] [PMC free article] [PubMed] [Google Scholar]
- 41.Kaczmarek JS, Riccio A, Clapham DE. Calpain cleaves and activates the TRPC5 channel to participate in semaphorin 3A-induced neuronal growth cone collapse. Proc Natl Acad Sci USA. 2012;109(20):7888–7892. doi: 10.1073/pnas.1205869109. [DOI] [PMC free article] [PubMed] [Google Scholar]
- 42.Nishiyama M, von Schimmelmann MJ, Togashi K, Findley WM, Hong K. Membrane potential shifts caused by diffusible guidance signals direct growth-cone turning. Nat Neurosci. 2008;11(7):762–771. doi: 10.1038/nn.2130. [DOI] [PubMed] [Google Scholar]
- 43.Reber M, Burrola P, Lemke G. A relative signalling model for the formation of a topographic neural map. Nature. 2004;431(7010):847–853. doi: 10.1038/nature02957. [DOI] [PubMed] [Google Scholar]
Associated Data
This section collects any data citations, data availability statements, or supplementary materials included in this article.


