

Abstract
Water and its influence on plants likely exerted strong adaptive pressures in human evolution. Understanding relationships among water, plants, and early humans is limited both by incomplete terrestrial records of environmental change and by indirect proxy data for water availability. Here we present a continuous record of stable hydrogen-isotope compositions (expressed as δD values) for lipid biomarkers preserved in lake sediments from an early Pleistocene archaeological site in eastern Africa—Olduvai Gorge. We convert sedimentary leaf- and algal-lipid δD values into estimates for ancient source-water δD values by accounting for biochemical, physiological, and environmental influences on isotopic fractionation via published water–lipid enrichment factors for living plants, algae, and recent sediments. Reconstructed precipitation and lake-water δD values, respectively, are consistent with modern isotopic hydrology and reveal that dramatic fluctuations in water availability accompanied ecosystem changes. Drier conditions, indicated by less negative δD values, occur in association with stable carbon-isotopic evidence for open, C4-dominated grassland ecosystems. Wetter conditions, indicated by lower δD values, are associated with expanded woody cover across the ancient landscape. Estimates for ancient precipitation amounts, based on reconstructed precipitation δD values, range between approximately 250 and 700 mm·y−1 and are consistent with modern precipitation data for eastern Africa. We conclude that freshwater availability exerted a substantial influence on eastern African ecosystems and, by extension, was central to early human proliferation during periods of rapid climate change.
Keywords: paleohydrology, plant waxes, carbon isotopes
The role of water and ecosystem change in human evolution remains a subject of active debate (1–3), but experts widely acknowledge that these factors likely shaped early human (hominin) foraging strategies and diet (4) approximtely 2.0–1.8 million years ago (Ma). According to marine records, this juncture occurred during an interval of protracted grassland expansion across eastern Africa (1). In contrast, coeval terrestrial records from hominin archaeological sites such as Olduvai Gorge indicate recurrent fluctuations between open-grassland and closed-woodland ecosystems (5). Although such ecosystem fluctuations are commonly interpreted in relation to aridity, grassland expansion is sensitive to multiple factors (6), and proxy signals more closely linked to meteoric waters could strengthen interpretations.
Here we use δD values for lipid biomarkers preserved in lake sediments to reconstruct source-water δD values at Olduvai Gorge during the early Pleistocene. In modern lake basins, precipitation and lake-water δD values correlate strongly with δD values for leaf- and algal-lipids, respectively, after accounting for isotopic fractionation during lipid biosynthesis (7). Present and past source-water δD values reflect the combined influences of vapor-source, transport history, and aridity, ultimately linking local hydrologic patterns to atmospheric and oceanic-circulation dynamics (8).
Sample Locality.
Olduvai Gorge is incised into the eastern margin of the Serengeti Plain in northern Tanzania (Fig. 1). Gorge walls expose a thick sequence of volcaniclastic sediments and tuff accumulated in lake and lake-margin environments (9, 10). Between approximately 2.0 and 1.8 Ma, a perennial saline-alkaline lake (paleolake Olduvai) occupied the center of the closed basin (9–11). Lake-margin stratigraphy suggests paleolake Olduvai responded sensitively to local and regional precipitation patterns during this 200,000-y interval (9–12). Stable carbon-isotope compositions (expressed as δ13C values) of leaf-lipids preserved in the lake sediments vary by more than 15‰, suggesting that pronounced ecosystem fluctuations accompanied lake-level fluctuations (5). Here we measure leaf-lipid δD values in a subset of the same lake sediment outcrop. All samples are from locality 80 (Bed I), which accumulated near the depocenter of paleolake Olduvai (10) and was exposed by stream incision during the late Pleistocene (9).
Fig. 1.

Modern precipitation patterns in eastern Africa (66) during the (A) long rains (March to May) and (B) the short rains (October to December), with respect to average monthly precipitation in northern Tanzania (C) (Data courtesy of http://climexp.knmi.nl). In A and B, bold horizontal lines mark the position of the Intertropical Convergence Zone, whereas dashed lines mark the Interoceanic Confluence (13). Target symbols mark the location of Olduvai Gorge (2° 48′S, 35° 06′E). In C, the bold line reflects observed average monthly rainfall (1964–1984); gray envelops variation for average monthly precipitation. The dashed line reflects modeled average monthly rainfall for Tanzania (67). (D) Depositional environments surrounding paleolake Olduvai during the early Pleistocene (9). Contracted (dashed line) and expanded (bold line) lake margins are based on correlated stratigraphic sections (9–12).
Precipitation Patterns in Eastern Africa.
In eastern Africa, precipitation patterns reflect interactions between regional highlands and two convergent boundaries (Fig. 1). The Intertropical Convergence Zone (ITCZ) and closely associated African rainbelt (13) mark north–south convergence of monsoon airstreams. The Interoceanic Confluence (IOC; also referred to as the Congo Air Boundary) marks east–west convergence of air masses derived from the Indian and Atlantic Oceans (14). Both the ITCZ and IOC migrate in response to insolation-driven surface heating patterns (13), yielding two rainy seasons. In eastern Africa, the “long rains” (March to May) account for more than 50% of annual totals (15). Precipitation during the “short rains” (October to December) is more variable but correlates strongly with annual totals (16).
Precipitation δD values (δDrain) reflect the origins and histories of the related air masses that produce it. In eastern Africa, δDrain values correlate inversely with precipitation amounts due to the influences of vapor-source, transport history, and “amount” effects (17). Today the Indian Ocean is the primary vapor source to eastern Africa (13); the Atlantic Ocean and continental surface-water evaporation are important secondary sources. Transport history and amount effects result in δDrain values that differ between the rainy seasons (18). On average, δDrain values for the long rains are less negative (−20‰) than for the short rains (−28‰); in central eastern Africa, the average annual δDrain value is approximately −22‰ (19–22).
Leaf-Lipid Apparent Fractionation Factors.
Plant-water δD values reflect soil-water δD values (δDsoil) (7). Isotopic relationships between δDsoil and δDrain values can be influenced by surface evaporation in arid and semiarid regions (8), but plant-water δD values attenuate evaporative signals by accessing deep soil moisture and increasing productivity during rainy seasons (23).
Soil water is not fractionated significantly during uptake by plant roots, and stem-water δD values generally reflect δDsoil values (23). In contrast, leaf-water δD values can vary markedly from δDsoil values as a result of transpiration (24). The relative importance of stem-water vs. leaf-water during lipid biosynthesis remains unclear (25, 26), as does biosynthetic phenology. These factors could account for differences in apparent fractionation between source-waters and lipids (ɛlipid/water = [(δDlipid + 1,000)/(δDwater + 1,000)] − 1, expressed in permil (‰)) among living plants when grouped according to plant functional type (PFT).
We reevaluate a global compilation of published leaf-lipid δD values for living plants (SI Appendix) to determine representative ɛlipid/water values for different PFTs relevant to this study. We target subtropical and tropical taxa in clades most representative of plants in eastern Africa since the early Pleistocene (27, 28). Leaves of subtropical and tropical plants commonly contain the leaf-lipid hentriacontane (nC31) (29, 30), and nC31 is also abundant in lake sediments from Olduvai Gorge (5). Therefore, we use published δD values for nC31 (δD31) to determine ɛlipid/water values applicable to sedimentary δD31 values from Olduvai Gorge.
We define PFTs in terms of photosynthetic pathway and growth habit: C3 woody plants, C3 herbs, and C4 graminoids. We determine representative ɛlipid/water values—termed ɛ31/model values—from published δD31 values using modeled annual δDrain values ( ) (21, 22). Measured annual δDrain values rarely accompany published leaf-lipid δD values but, when available, generally coincide with
  values (7, 21).
Collectively, ɛ31/model values average −124‰ (ɛaverage). Among individual PFTs the median ɛ31/model value for C4 graminoids is most negative (−146‰ ± 8‰, 95% confidence interval; n = 51). The median ɛ31/model value for C3 herbs (−124‰ ± 10‰; n = 24) is more negative than for C3 woody plants (−109‰ ± 8‰; n = 84).
We calculate “landscape” apparent fractionation factors (ɛlandscape) using ɛ31/model values and relative PFT abundances (Fig. 2) estimated from δ13C values for nC31 (δ13C31) in lake sediments (5). Leaf-lipids represent relative PFT abundances in basins ranging from small lakes (31) to expansive river systems (32), despite differences in basin morphology, transport, and burial processes (33). We multiply each ɛ31/model value by relative PFT abundance (i.e., fwoody, fherb, and fgram for woody plants, herbs, and gramminoids, respectively) to calculate ɛlandscape values:
Fig. 2.

Schematic depiction of ɛ31/model values as a function of reconstructed ecosystem. (A) We use δ13C31 values to estimate relative abundances for three different PFTs: C4 graminoids, C3 herbs, and C3 woody plants. (B) We relate relative PFT abundances to ecosystem (5) according to United Nations Educational, Scientific, and Cultural Organization terminology (68). (C) We calculate “landscape” apparent fractionation factors (ɛlandscape) for deuterium by mass balance.
Finally, we apply ɛlandscape values to sedimentary δD31 values to reconstruct δDsoil values.
The relative influences of biochemical, physiological, and environmental processes on ɛlipid/water values are difficult to account for in interpretations of δD31 values. For instance, our ɛ31/model value for C3 woody plants does not distinguish by canopy height, despite observed differences between modern trees and shrubs (SI Appendix). Similarly, annual δDrain values do not distinguish seasonality. In eastern Africa, annual and rainy-season δDrain values can differ in excess of 20‰ (SI Appendix), although >85% of annual precipitation occurs during rainy seasons (15). Thus, to the extent that plant growth takes place in rainy seasons, annual δDrain values can overestimate δDsoil values during lipid biosynthesis.
Although propagated uncertainty in ɛlandscape values (SI Appendix) represents a substantial portion of the variability in modern δDrain values across central eastern Africa (approximately 60‰), sedimentary δD31 values capture space- and time-integrated signals that attenuate variability of individual plants or species (7, 31). Thus, uncertainty in ɛlandscape values largely reflects ecosystem-scale differences in transpiration and phenology (7), which are at least partially accounted for by ɛ31/model values, provided living plants are representative of their ancient counterparts. Despite some significant shortcomings in the state of the art, ɛlandscape values provide a useful interpretational framework to account for biological and physical influences on leaf-lipid δD values—a factor often overlooked in hydrologic reconstructions.
Algal-Lipid Apparent Fractionation Factors.
Aquatic photosynthetic organisms acquire hydrogen for lipid biosynthesis from ambient waters (7). Therefore, algal δD values reflect lake-water δD values—which integrate precipitation, groundwater, runoff, and evaporation—as modified by biosynthetic fractionation. Biosynthetic fractionation, in turn, incorporates biological and physical factors (7). Culture studies indicate that algal ɛlipid/water values vary between species (34), but space- and time-integration seems to minimize these effects in sediments (7).
Field studies indicate that algal ɛlipid/water values vary in relation to salinity and must be accounted for when interpreting algal-lipid δD values (35). The response of algal ɛlipid/water values to salinity is markedly consistent at 0.9‰ ± 0.2‰ ppt−1 (7). Heptacosane (nC17) is a general biomarker for algae (36) and is abundant in lake sediments from Olduvai Gorge. Modern studies establish an apparent fractionation between freshwater and nC17 equal to −172‰ (7), and we use this value to determine algal ɛlipid/water values at different salinities—termed ɛlake values:
We construct a basic lake-water evaporation model to constrain ɛlake values in the past (SI Appendix). Briefly, we estimate the total solute load for paleolake Olduvai on the basis of stratigraphic evidence for maximum lake area (approximately 200 km2) (10) and lake level (approximately 5 m) (12) during the early Pleistocene and fossil evidence for minimum salinity (approximately 20 ppt) (9). Then, we infer changes in lake level from changes in sedimentary total organic carbon (%TOC) because these values covary in many modern lakes in eastern Africa (37). Next, we assume a conservative solute balance and use estimates for paleolake volume to estimate salinities during lake contraction. Finally, we apply ɛlake values to sedimentary δD17 values to reconstruct lake-water δD values (δDlake). Salinity estimates for paleolake Olduvai range from approximately 20 to 100 ppt, resulting in ɛlake values that vary by up to 88‰ from freshwater algal ɛlipid/water values.
Biosynthetic processes responsible for the influence of salinity on δD17 values are unclear (7), and not all possible mechanisms result in linear relationships. Still, ɛlake values range between −158‰ and −84‰ for paleolake Olduvai, highlighting the importance of salinity when interpreting δDlake values from sedimentary δD17 values.
Results
Sedimentary δ13C31 values range from −36.3‰ to −21.4‰, with an average value of −27.8‰ (Fig. 3). Sedimentary δD31 values range from −148% to –132‰ and correlate weakly with δ13C31 values (r2 = 0.11) and %TOC (r2 = 0.08). Reconstructed δDsoil values show an increased isotopic range of 54‰, from −38‰ to +16‰ (Fig. 4).
Fig. 3.
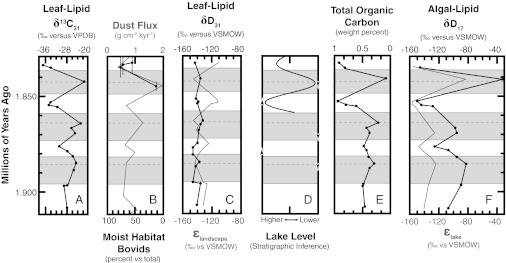
Relationships between leaf- and algal-lipid δD values and ancillary proxy data for Olduvai Gorge. (A) Sedimentary δ13C31 values (5). (B) Dust fluxes into the Arabian Sea (gray line) and closed- or moist-habitat bovids by percentage of total bovids (black circles) (1, 69). (C) Sedimentary δD31 values (black circles) alongside ɛecosystem values (gray line). (D) Stratigraphic evidence for lake levels (9–12). Horizons that contain faunal evidence for low (down arrows) or high (up arrows) lake levels are also shown (12). (E) Sedimentary total organic carbon. (F) Sedimentary δD17 values (black circles) alongside ɛlake values (gray line).
Fig. 4.

Leaf- and algal-lipid δD values and reconstructed source waters with respect to sedimentary %TOC. (A) Measured δD31 (hollow circles) and reconstructed δDsoil values (black circles) with respect to %TOC. For reference, a gray line marks the linear regression for values based on the average ɛ31/model value of −124‰. (B) Measured δD17 (hollow circles) and reconstructed δDlake values (black circles) with respect to %TOC. A gray line marks the linear regression for values based on a freshwater ɛ17/water value of −172‰.
Sedimentary δD17 values range from −150‰ to −30‰ (Fig. 4). Measured values correlate strongly with δ13C31 values (r2 = 0.83) and %TOC (r2 = 0.86). Reconstructed δDlake values show a relatively smaller the isotopic range, from +3‰ to +59‰, but still correlate strongly with δ13C31 values (r2 = 0.88). Interestingly, sedimentary δD17 values correlate weakly with sedimentary δD31 values (r2 = 0.11), but reconstructed δDlake values correlate strongly with reconstructed δDsoil values (r2 = 0.84).
Interpretations and Discussion
Precipitation in Eastern Africa.
Historical precipitation patterns serve as a framework for interpreting reconstructed hydrologic patterns over timescales of 101 to 103 thousand years (38), although regional tectonism and the intensification of zonal atmospheric (Walker) circulation during the early Pleistocene could weaken this interpretational link (1, 13). Modern δDrain values reveal a regional meteoric waterline (RMWL) for eastern Africa (Fig. 5):
Fig. 5.

Modern isotopic relationships for precipitation and lake waters in eastern Africa. We plot a RMWL (bold line) based on modern monthly δDrain and δ18Orain values and single precipitation events (19–22, 39, 40):  . For reference, we also plot the global meteoric waterline (dashed line). A large black circle marks the point defined by a single reconstructed δDsoil and published δ18Orain value reconstructed from minerals in closely associated lake-margin sediments (SI Appendix). Propagated uncertainties are shown (SI Appendix). For reference, a cross marks the δD value based on the average ɛ31/model value of −124‰. Modern δDlake and δ18Olake values yield an LEL for eastern Africa (48–53):
  . A large black square marks the point defined by a single reconstructed δDlake and published δ18Olake value reconstructed from authigenic clays in associated lake sediments (SI Appendix), whereas the overlying cross marks the δD value based on a freshwater ɛ17/water value of −172‰.
Today, annual δDrain values in eastern Africa range from approximately −30‰ and −10‰, whereas monthly δDrain values range from approximately −50‰ and +30‰ (19–22, 39–41). We pair reconstructed δDsoil values with published δ18Orain values derived from lake and soil-carbonate minerals in closely associated lake (12) and lake-margin (41) sediments (SI Appendix). Reconstructed δDsoil–δ18Orain values plot within the range of modern precipitation data for eastern Africa and show strong agreement with the RMWL (Fig. 5).
A wide range in δDsoil values (and, by inference δDrain values) indicates pronounced changes in vapor source, transport history, amount of precipitation, or a combination thereof. Today, changes in vapor source account for up to 10‰ variability in δDrain values (40). Sea-surface temperatures in vapor-source regions influence δDrain values by approximately 1‰ °C−1 (42), accounting for up to 5‰ variability during the early Pleistocene (43). Transport history is difficult to constrain (44) but can account for up to 10‰ variability today. Together, changes in vapor source and transport history can account for nearly half of the variability (25‰) in reconstructed δDsoil values for eastern Africa. If so, changes in the amount of precipitation account for the remaining variability (29 of 54‰) in reconstructed δDsoil values.
The relationship between modern δDrain values and amount of precipitation is difficult to evaluate in many tropical regions because of sparse measurements, but available data suggest comparable effects at seasonal, annual, and interannual timescales (44, 45). In eastern Africa, available rainy-season δDrain values correlate inversely with precipitation at a slope of −0.125‰ mm−1 (SI Appendix). If modern sensitivity is representative for the past, and changes in vapor-source and transport history were important, then a 29‰ range in δDsoil values translate to 225 mm precipitation range; the full 54‰ range translates to 415-mm precipitation range.
Historical data for annual δDrain values (−22‰) (19, 39) and mean annual precipitation (MAP) (550 mm) (9, 15) provide a local reference point from which to project reconstructed δDsoil values. Because rainy seasons account for approximately 85% of MAP in northern Tanzania (15), we use an amount effect for rainy-season months to reconstruct MAP in the past:
MAP estimates for the full range of δDsoil values are from ∼700–250 mm. This range is consistent with reconstructions based on pollen spectra (∼750 mm) (46) and soil carbonates (<400 mm) (47) during wetter and drier intervals, respectively. Woody cover strongly covaries with MAP today in eastern Africa (6):
We find a similar relationship between our estimates of MAP and woody cover (5). For instance, in the modern calibration, MAP of 700 mm yields an fwoody value of 0.84, which is consistent with a δ13C31-derived (−36.3‰) fwoody value of 0.90 (5). These observations suggest amount effects influenced δDrain values more than changes in vapor-source or transport history at Olduvai Gorge and highlight the importance of using ɛlandscape values to reconstruct hydrologic patterns from leaf-lipid δD values.
Lake-Water Evaporation in Eastern Africa.
Loss of lighter isotopic species (H216O) during evaporation progressively enriches residual lake waters in DH16O and H218O. In eastern Africa, lake-water δD values (δDlake) and δ18O values (δ18Olake) define an isotopic trajectory—called a local evaporation line (LEL)—with a slope that is lower than that of the RMWL (8). LEL slopes are primarily a function of relative humidity (h); in general, very low h values (e.g., 0.25) result in slopes close to 4, whereas higher h values result in slopes closer to 6 (8). Modern δDlake and δ18Olake values yield an LEL for eastern Africa:
Modern δDlake values range from approximately −30‰ in humid regions of eastern Africa to +80‰ or higher in extremely arid regions (48–53).
The LEL defines source-water composition at its intersection with the RMWL. For modern waters in eastern Africa, LEL and RMWL intersect at a source-water δD value of −22‰ (Fig. 5), which closely matches historical data (19–22). In closed basins, lake waters derive primarily from precipitation (54).
Tracing Isotopic Hydrology at Olduvai Gorge.
To compare modern and ancient lake-waters, we pair reconstructed δDlake values with published δ18Olake values that were determined from authigenic clays (12) in associated sediments (SI Appendix). Reconstructed δDlake–δ18Olake values show close agreement with the modern LEL (Fig. 5). Further, reconstructed δDlake and δDsoil values strongly correlate, suggesting lake-water compositions shifted largely owing to changes in precipitation. Evaporation rates decrease at high salinity because of the decreased activity of water in high ionic-strength solutions. As a result, potential evaporation can exceed lake-water evaporation by up to 100-fold (54). Thus, although reconstructed δDlake values vary only slightly more than δDsoil values, changes in source-water and amount of precipitation would have been accompanied by large changes in potential evaporation. Reconstructed lake evaporation relative to meteoric input (E/I) based on our data suggest higher evaporation during intervals of reduced precipitation (E/I = 2.9) than during increased precipitation (E/I = 1.3) and are consistent with historical and modeled E/I values for eastern Africa (SI Appendix).
Water Availability and Ecosystem Dynamics.
Reconstructed δDrain and δDlake values reveal strong relationships between water and carbon-isotopic data for ecosystem type. Lower δDrain and δDlake values, which reflect increased MAP and decreased evaporation, respectively, correspond with increased woody cover (fwoody = 0.90). Although the organic carbon-derived indicators we use to determine ɛlandscape and ɛlake values may be codependent (55), reconstructed values for fwoody and lake level are consistent with independent indicators for ecosystem type and paleolake level (Fig. 3). Much like today (6), aridity was a dominant control on ecosystem change in eastern Africa during the Pleistocene.
Contrasting proxy records have fueled debate about the pace and patterns of environmental change in eastern Africa during the Pleistocene. Pollen and fossil abundance records suggest expansion of arid-adapted species beginning near 2.0 Ma and culminating around 1.8 Ma (56, 57). Marine dust-flux records and soil-carbonate δ13C values also suggest shifts toward more arid conditions around 1.8 Ma (1), although geomorphic evidence suggests regionally wetter conditions (1).
Lipid biomarkers from Olduvai Gorge point to rapid changes in plants and water between approximately 2.0 and 1.8 Ma, and we suggest this environmental variability both influenced and can reconcile proxy records. For instance, increased seasonality can lead to C4 graminoid expansions (58) but can also lead to unrepresentatively positive C4-like δ13C values in soil carbonates (59). Similarly, rapid wet-to-dry transitions can simultaneously produce both increased dust and elevated lake-levels (60). Over the past several million years, modulation of marine dust-flux records from the Arabian Sea has been tightly coupled with orbital eccentricity, resulting in distinct intervals of exceptionally high-amplitude variability during orbital-eccentricity maxima (1). We hypothesize that high-amplitude, orbital precession-paced environmental variability, as opposed to gradual or stepwise aridification, characterized eastern Africa during the early Pleistocene.
Water and Early Human Evolution.
In semiarid regions, precipitation primarily determines water availability (15). Today, water availability shapes primate behaviors through its influence on vegetation and resource distributions (4, 61). For example, regions with MAP <700 mm do not support chimpanzee populations (62). Water likely shaped behavioral adaptations in the genus Homo (63). Our evidence for dramatic variability is consistent with water as a strong selective pressure in human evolution (1, 2). However, thermoregulatory and dietary constraints function at microhabitat scales (64), and many hominin fossil sites—including Olduvai Gorge (9)—are associated with ephemeral or saline water sources (65). Our reconstructions of precipitation and lake-chemistry indicate that, even during maximum lake expansion, lake waters at Olduvai Gorge were likely not potable (12). Groundwater-fed freshwater springs could have aided hominin existence and proliferation (65).
Conclusions
This study presents a continuous record of δD values for lipid biomarkers from lake sediments at Olduvai Gorge that were deposited during a key juncture in human evolution, ∼2.0–1.8 Ma. We pair sedimentary leaf-lipid δD values with corresponding δ13C values to account for physiological and environmental influences on reconstructed precipitation δD values. We use a basic lake-water evaporation model to account for the influence of salinity on algal-lipid δD values and reconstructed lake-water δD values. Sedimentary leaf- and algal-lipid δD values show a weak relationship, but “corrected” values correlate strongly. We compare reconstructed precipitation and lake-water δD values with isotopic data for environmental waters in modern eastern African to estimate ancient precipitation amounts and evaporative losses, respectively. Our results indicate Olduvai Gorge received approximately 250 mm of MAP during arid intervals and ∼700 mm during wetter intervals. Given the magnitude and variability in water availability revealed by our reconstructions, we hypothesize freshwater springs were important for hominin subsistence in highly variable environments.
Materials and Methods
Lipid Extraction and Purification.
Lipid biomarkers in lake sediments were extracted and separated according to Magill et al. (5).
Isotopic Analysis.
Lipid δD values were measured by gas chromatography–isotope ratio monitoring–mass spectrometry. Hydrogen gas of known δD value was used as reference. Samples were coinjected with internal standards of known δD values (nC41, androstane, and squalane). Uncertainty (1σ SD) for nC41 was 4‰.
Age Model.
Our age model is constrained using previously published 40Ar/39Ar, magnetic stratigraphy, and tuff correlation dates (5).
Supplementary Material
Acknowledgments
We thank the Ngorongoro Conservation Area Authority for field permits to R. Blumenschine and F. Masao. This study was supported by the Winston Churchill Foundation, Carbon Educators and Researchers Together for Humanity (CarbonEARTH) (National Science Foundation Grant Division of Graduate Education 0947962), and the Tanzania Antiquities Department. Samples were collected by G. Ashley and R. Renaut (National Science Foundation Grant Earth Sciences 9903258).
Footnotes
The authors declare no conflict of interest.
This article is a PNAS Direct Submission.
This article contains supporting information online at www.pnas.org/lookup/suppl/doi:10.1073/pnas.1209405109/-/DCSupplemental.
See Commentary on page 1144.
References
- 1.deMenocal P. African climate change and faunal evolution during the Pliocene-Pleistocene. Earth Planet Sci Lett. 2004;220(1-2):3–24. [Google Scholar]
- 2.Potts R. Environmental hypotheses of Pliocene human evolution. In: Bobe R, Alemseged Z, Behrensmeyer A, editors. Hominin Environments in the East African Pliocene: An Assessment of the Faunal Evidence, Vertebrate Paleobiology and Paleoanthropology. The Netherlands: Springer; 2007. pp. 25–49. [Google Scholar]
- 3.Cerling TE, et al. Woody cover and hominin environments in the past 6 million years. Nature. 2011;476(7358):51–56. doi: 10.1038/nature10306. [DOI] [PubMed] [Google Scholar]
- 4.Teaford MF, Ungar PS. Diet and the evolution of the earliest human ancestors. Proc Natl Acad Sci USA. 2000;97(25):13506–13511. doi: 10.1073/pnas.260368897. [DOI] [PMC free article] [PubMed] [Google Scholar]
- 5.Magill C, Ashley G, Freeman K. Landscape variability and early human environments in Africa. Proc Natl Acad Sci USA. 2012;110:1167–1174. doi: 10.1073/pnas.1206276110. [DOI] [PMC free article] [PubMed] [Google Scholar]
- 6.Sankaran M, et al. Determinants of woody cover in African savannas. Nature. 2005;438(7069):846–849. doi: 10.1038/nature04070. [DOI] [PubMed] [Google Scholar]
- 7.Sachse D, et al. Molecular paleohydrology, interpreting the hydrogen-isotopic composition of lipid biomarkers from photosynthetic organisms. Annu Rev Earth Planet Sci. 2012;40(1):221–249. [Google Scholar]
- 8.Gibson J, Birks S, Edwards T. Global prediction of δA and δ2H-δ18O evaporation slopes for lakes and soil water accounting for seasonality. Global Biogeochem Cycles. 2008 doi: 10.1029/2007GB002997. [DOI] [Google Scholar]
- 9.Hay R. Geology of the Olduvai Gorge. Los Angeles: Univ of California Press; 1976. [Google Scholar]
- 10.Ashley G, Hay R. Sedimentation patterns in a Plio-Pleistocene volcaniclastic rift-platform basin, Olduvai Gorge, Tanzania. In: Renaut R, Ashley G, editors. Sedimentation in Continental Rifts. Tulsa: Society for Sedimentary Geology; 2002. pp. 107–122. [Google Scholar]
- 11.Ashley G. Orbital rhythms, monsoons, and playa lake response, Olduvai basin, equatorial East Africa (ca. 1.85-1.74 Ma) Geology. 2007;35(12):1091–1094. [Google Scholar]
- 12.Hay R, Kyser T. Chemical sedimentology and paleoenvironmental history of Lake Olduvai, a Pliocene lake in northern Tanzania. Geol Soc Am Bull. 2001;113(12):1505–1521. [Google Scholar]
- 13.Nicholson S. The nature of rainfall variability over Africa on time scales of decades to millenia. Global Planet Change. 2000;26(1-3):137–158. [Google Scholar]
- 14.Pohl B, Camberlin P. Influence of the Madden-Julian Oscillation on East African rainfall: Intraseasonal variability and regional dependency. Q J R Meteorol Soc. 2006;132(621):2521–2539. [Google Scholar]
- 15.Prins H, Loth P. Rainfall patterns as background to plant phenology in northern Tanzania. J Biogeogr. 1988;15(3):451–463. [Google Scholar]
- 16.Moron V, Robertson A, Ward M, Camberlin P. Spatial coherence of tropical rainfall at the regional scale. J Clim. 2007;20(21):5244–5263. [Google Scholar]
- 17.Araguás-Araguás L, Froehlich K, Rozanski K. Stable isotope composition of precipitation over southeast Asia. J Geophys Res. 1998 doi: 10.1029/98JD02582. [DOI] [Google Scholar]
- 18.van der Ent R, Savenije H, Schaefli B, Steele-Dunne S. Origin and fate of atmospheric moisture over continents. Water Resour Res. 2010 doi: 10.1029/2010WR009127. [DOI] [Google Scholar]
- 19.Bohté R, et al. Hydrograph separation and scale dependency of natural tracers in a semi-arid catchment. Hydrol Earth Syst Sci Discuss. 2010;7(1):1343–1372. [Google Scholar]
- 20.Nkotagu H. Application of environmental isotopes to groundwater recharge studies in a semi-arid fractured crystalline basement area of Dodoma, Tanzania. J Afr Earth Sci. 1996;22(4):443–457. [Google Scholar]
- 21.Bowen G, Revenaugh J. Interpolating the isotopic composition of modern meteoric precipitation. Water Resour Res. 2003 doi: 10.1029/2003WR002086. [DOI] [Google Scholar]
- 22.International Atomic Energy Agency 2006. Isotope Hydrology Information System. Available at www.iaea.org/water. Accessed January 1, 2012.
- 23.Ehrlinger J, Dawson T. Water uptake by plants: Perspectives from stable isotope composition. Plant Cell Environ. 1992;15(9):1073–1082. [Google Scholar]
- 24.Farquhar GD, Cernusak LA, Barnes B. Heavy water fractionation during transpiration. Plant Physiol. 2007;143(1):11–18. doi: 10.1104/pp.106.093278. [DOI] [PMC free article] [PubMed] [Google Scholar]
- 25.Feakins S, Sessions A. Controls on the D/H ratios of plant leaf waxes in an arid ecosystem. Geochim Cosmochim Acta. 2010;74(7):2128–2141. [Google Scholar]
- 26.McInerney F, Helliker B, Freeman K. Hydrogen isotope ratios of leaf wax n-alkanes in grasses are insensitive to transpiration. Geochim Cosmochim Acta. 2011;75(2):541–554. [Google Scholar]
- 27.Chase M, Reveal J. A phylogenetic classification of the land plants to accompany APG III. Bot J Linn Soc. 2009;161(2):122–127. [Google Scholar]
- 28.Bell CD, Soltis DE, Soltis PS. The age and diversification of the angiosperms re-revisited. Am J Bot. 2010;97(8):1296–1303. doi: 10.3732/ajb.0900346. [DOI] [PubMed] [Google Scholar]
- 29.Rommerskirchen F, et al. Chemotaxonomic significance of distribution and stable carbon isotopic composition of long-chain alkanes and alkan-1-ols in C4 grass waxes. Org Geochem. 2006;37(10):1303–1332. [Google Scholar]
- 30.Vogts A, Moossen H, Rommerskirchen F, Rullkotter J. Distribution patterns and stable carbon isotopic composition of alkanes and alkan-1-ols from plant waxes of African rain forest and savanna C3 species. Org Geochem. 2009;40(10):1037–1054. [Google Scholar]
- 31.Polissar P, Freeman K. Effects of aridity and vegetation on plant-wax δD in modern lake sediments. Geochim Cosmochim Acta. 2010;74(20):5785–5797. [Google Scholar]
- 32.Galy V, Eglinton T. Protracted storage of biospheric carbon in the Ganges-Brahmaputra basin. Nat Geosci. 2011;4(12):843–847. [Google Scholar]
- 33.Carroll A, Bohacs K. Stratigraphic classification of ancient lakes: Balancing tectonic and climatic controls. Geology. 1999;27(2):99–102. [Google Scholar]
- 34.Zhang Z, Sachs J. Hydrogen isotope fractionation in freshwater algae: Variations among lipids and species. Org Geochem. 2007;38(4):582–608. [Google Scholar]
- 35.Sachs J, Schwab V. Hydrogen isotopes in dinosterol from the Chesapeake Bay estuary. Geochim Cosmochim Acta. 2010;75(2):444–459. [Google Scholar]
- 36.Han J, Calvin M. Hydrocarbon distribution of algae and bacteria, and microbiological activity in sediments. Proc Natl Acad Sci USA. 1969;64(2):436–443. doi: 10.1073/pnas.64.2.436. [DOI] [PMC free article] [PubMed] [Google Scholar]
- 37.Talbot M, Livingstone D. Hydrogen index and carbon isotopes of lacustrine organic matter and lake level indicators. Palaeogeogr Palaeoclimatol Palaeoecol. 1989;70(1-3):121–137. [Google Scholar]
- 38.Laepple T, Lohmann G. Seasonal cycle as template for climate variability on astronomical timescales. Paleoceanography. 2009 doi: 10.1029/2008PA001674. [DOI] [Google Scholar]
- 39.Onodera S, Kitaoka K, Shindo S. Stable isotopic compositions of deep groundwater caused by partial infiltration into the restricted recharge area of a semiarid basin in Tanzania. In: Wagner B, Illangasekare T, Jensen K, editors. Models for Assessing and Monitoring Groundwater Quality. Oxfordshire: IAHS Press; 1995. pp. 75–83. [Google Scholar]
- 40.Rozanski K, Araguás-Araguás L, Gonfiantini R. Isotope patterns of precipitation in the East African region. In: Johnson T, Odada E, editors. The Limnology, Climatology and Paleoclimatology of the East African Lakes. Amsterdam: Gordon and Breach; 1996. pp. 79–94. [Google Scholar]
- 41.Cerling T, Hay R. An isotopic study of paleosol carbonates from Olduvai Gorge. Quat Res. 1986;25(1):63–78. [Google Scholar]
- 42.Steig EJ. Paleoclimate. No two latitudes alike. Science. 2001;293(5537):2015–2016. doi: 10.1126/science.1061941. [DOI] [PubMed] [Google Scholar]
- 43.Cleaveland L, Herbert T. Coherent obliquity band and heterogeneous precession band responses in early Pleistocene tropical sea surface temperatures. Paleoceanography. 2007 doi: 10.1029/2006PA001370. [DOI] [Google Scholar]
- 44.Worden J, Noone D, Bowman K. Tropospheric Emission Spectrometer Science Team and Data contributors Importance of rain evaporation and continental convection in the tropical water cycle. Nature. 2007;445(7127):528–532. doi: 10.1038/nature05508. [DOI] [PubMed] [Google Scholar]
- 45.Risi C, Bony S, Vimeux F. Influence of convective processes on the isotopic composition (δ18O and δD) of precipitation and water vapor in the tropics: Physical interpretation of the amount effect. J Geophys Res. 2008 doi: 10.1029/2008JD009943. [DOI] [Google Scholar]
- 46.Bonnefille R, et al. Glacial-interglacial record from intertropical Africa, high resolution pollen and carbon data at Rusaka, Burundi. Quat Sci Rev. 1995;14(9):917–936. [Google Scholar]
- 47.Sikes NE, Ashley GM. Stable isotopes of pedogenic carbonates as indicators of paleoecology in the Plio-Pleistocene (upper Bed I), western margin of the Olduvai Basin, Tanzania. J Hum Evol. 2007;53(5):574–594. doi: 10.1016/j.jhevol.2006.12.008. [DOI] [PubMed] [Google Scholar]
- 48.Darling W, Gizaw B, Arusei M. Lake-groundwater relationships and fluid-rock interaction in the East African Rift Valley: Isotopic evidence. J Afr Earth Sci. 1996;22(4):423–431. [Google Scholar]
- 49.Odada E. Stable isotopic composition of East African lake waters. In: Gourcy L, editor. Use of Isotope Techniques in Lake Dynamics Investigations. Vienna: IAEA; 2001. pp. 43–48. [Google Scholar]
- 50.Kebede S, et al. Lake-groundwater relationships, oxygen isotope balance and climate sensitivity of the Bishoftu crater lakes, Ethiopia. In: Odada E, Olago D, editors. The East African Great Lakes. New York: Kluwer; 2004. pp. 261–275. [Google Scholar]
- 51.Delalande M, et al. Hydroclimatic and geothermal controls on the salinity of Mbaka Lakes (SW Tanzania): Limnological and paleolimnological implications. J Hydrol (Amst) 2008;359(3-4):274–286. [Google Scholar]
- 52.Kebede S, Travi Y. Origin of the δ18O and δ2H composition of meteoric waters in Ethiopia. Quat Int. 2012;257:4–12. [Google Scholar]
- 53.Delalande M, Bergonzini L, Massault M. Mbaka lakes isotopic ((18)O and (2)H) and water balances: Discussion on the used atmospheric moisture compositions. Isotopes Environ Health Stud. 2008;44(1):71–82. doi: 10.1080/10256010801887414. [DOI] [PubMed] [Google Scholar]
- 54.Yechieli Y, Wood W. Hydrogeologic processes in saline systems: Playas, sabkhas, and saline lakes. Earth Sci Rev. 2002;58(3-4):343–365. [Google Scholar]
- 55.Meyers P, Lallier-Vergés E. Lacustrine sedimentary organic matter records of Late Quaternary paleoclimates. J Paleolimnol. 1999;21(3):345–372. [Google Scholar]
- 56.Bonnefille R. Cenozoic vegetation, climate changes and hominid evolution in tropical Africa. Global Planet Change. 2010;72(4):390–411. [Google Scholar]
- 57.Bobe R. The evolution of arid ecosystems in eastern Africa. J Arid Environ. 2006;66(3):564–584. [Google Scholar]
- 58.Gritti E, et al. Simulated effects of a seasonal precipitation change on the vegetation in tropical Africa. Climate of the Past. 2010;6:169–178. [Google Scholar]
- 59.Breecker D, Sharp Z, McFadden L. Seasonal bias in the formation and stable isotopic composition of pedogenic carbonate in modern soils from central New Mexico, USA. Geol Soc Am Bull. 2009;121(3-4):630–640. [Google Scholar]
- 60.Trauth M, et al. Human evolution in a variable environment: the amplifier lakes of Eastern Africa. Quat Sci Rev. 2010;29(23-24):2981–2988. [Google Scholar]
- 61.Pruetz J, Bertolani P. Chimpanzee (Pan trglodytes verus) behavioral responses to stresses associated with living in a savanna-mosaic environment, implications for hominin adaptations to open habitats. PaleoAnthropology. 2009;2009:252–262. [Google Scholar]
- 62.Copeland SR. Potential hominin plant foods in northern Tanzania: Semi-arid savannas versus savanna chimpanzee sites. J Hum Evol. 2009;57(4):365–378. doi: 10.1016/j.jhevol.2009.06.007. [DOI] [PubMed] [Google Scholar]
- 63.Rose L, Marshall F. Meat eating, hominid sociality, and home bases revisited. Curr Anthropol. 1996;37(2):307–338. [Google Scholar]
- 64.Hill RA. Thermal constraints on activity scheduling and habitat choice in baboons. Am J Phys Anthropol. 2006;129(2):242–249. doi: 10.1002/ajpa.20264. [DOI] [PubMed] [Google Scholar]
- 65.Ashley G, et al. Paleoenvironmental and paleoecological reconstruction of a freshwater oasis in savannah grassland at FLK North, Olduvai Gorge, Tanzania. Quat Res. 2010;74(3):333–343. [Google Scholar]
- 66.Mitchell T, Jones P. An improved method of constructing a database of monthly climate observations and associated high-resolution grids. Int J Climatol. 2005;25(6):693–712. [Google Scholar]
- 67.Kalnay E, et al. The NCEP/NCAR 40-year reanalysis project. Bull Am Meteorol Soc. 1996;77(3):437–471. [Google Scholar]
- 68.White F. The Vegetation of Africa. Paris: United Nations Scientific and Cultural Organization; 1983. [Google Scholar]
- 69.Kappelman J. Plio-Pleistocene environments of Bed I and lower Bed II, Olduvai Gorge, Tanzania. Palaeogeogr Palaeoclimatol Palaeoecol. 1984;48(2-4):171–196. [Google Scholar]
Associated Data
This section collects any data citations, data availability statements, or supplementary materials included in this article.