

Abstract
The pyloric rhythm of the stomatogastric ganglion of the crab, Cancer borealis, slows or stops when descending modulatory inputs are acutely removed. However, the rhythm spontaneously resumes after one or more days in the absence of neuromodulatory input. We recorded continuously for days to characterize quantitatively this recovery process. Activity bouts lasting 40 to 900 seconds began several hours after removal of neuromodulatory input and were followed by stable rhythm recovery after 1-4 days. Bout duration was not related to the intervals (0.3 to 800 minutes) between bouts. During an individual bout the frequency rapidly increased and then decreased more slowly. Photoablation of back-filled neuromodulatory terminals in the STG neuropil had no effect on activity bouts or recovery, suggesting that these processes are intrinsic to the STG neuronal network. After removal of neuromodulatory input the phase relationships of the components of the triphasic pyloric rhythm were altered, and then over time the phase relationships moved towards their control values. Although at low pyloric rhythm frequency the phase relationships among pyloric network neurons depended on frequency, the changes in frequency during recovery did not completely account for the change in phase seen after rhythm recovery. Additionally, we suggest that activity bouts represent underlying mechanisms controlling the restructuring of the pyloric network to allow resumption of an appropriate output following removal of neuromodulatory input.
Keywords: central pattern generator, stomatogastric ganglion, crustaceans, homeostasis, plasticity
Introduction
Episodic bouts of activity are thought to be involved in processes controlling the development of neural networks including neurite outgrowth, neuronal phenotype differentiation, pruning of existing synaptic contacts and the formation of new synaptic contacts. Spontaneous, bouts of activity are seen in developing networks in the retina (Meister et al. 1991; Wong et al. 1995; Wong 1999), spinal cord (O'Donovan et al. 1998), hippocampus (Ben-Ari et al. 1989; Garaschuk et al. 1998), and cultures of young cortical neurons (Kamioka et al. 1996; Murphy et al. 1992). In the developing spinal cord, bouts of activity lasting approximately one minute are interspersed with silent periods lasting 10-15 minutes. Individual activity bouts are composed of multiple cycles of action potential discharge that lengthen in duration over the course of the bout (Landmesser and O'Donovan 1984a,b). Calcium entry during bouts is necessary for the proper development of neuronal phenotype and for the regulation of neurite extension in spinal motor networks (Gu and Spitzer 1995; Holliday and Spitzer 1990).
Long-term changes in neuronal activity have been shown to occur following deafferentation in a variety of systems. Damage to the vestibuloreceptors or vestibular nerve in mammals results in an alteration of neural activity in the vestibular nucleus complex (VNC), which affects balance and postural control (Darlington et al. 2002; Him and Dutia 2001). The neurons in the VNC typically display a spontaneous output that is believed to be due to intrinsic membrane properties (Darlington et al. 2002). Following deafferentation this activity decreases, but resumes over time allowing a partial recovery of behavioral function (Darlington et al. 2002; Him and Dutia 2001). Damage to the sensory input to the spinal cord causes long lasting changes in the activity of thalamic and cortical neurons and their synaptic organization, which may underlie abnormal sensory responses following loss of a limb or spinal damage (Jones 2000; Vaculin et al. 2000; Weng et al. 2000).
In this paper we describe episodic bouts of activity, resembling bouts in developing motor systems, that accompany the recovery of the pyloric rhythm following removal of modulatory inputs to the pyloric network. (Golowasch et al. 1999b; Mizrahi et al. 2001; Thoby-Brisson and Simmers 1998, 2000, 2002). The pyloric rhythm of the crustacean stomatogastric ganglion (STG) consists of a triphasic motor pattern with a frequency typically around 1 Hz (Harris-Warrick et al. 1992). The STG receives descending modulatory inputs that under normal conditions are crucial for the expression of the pyloric rhythm, and removal of these inputs results in either a decrease in frequency or complete loss of the pyloric rhythm (Russell 1979; Russell and Hartline 1978). However, if preparations are maintained in the absence of neuromodulatory inputs for days, the pyloric rhythm recovers (Golowasch et al. 1999b; Mizrahi et al. 2001; Thoby-Brisson and Simmers 1998, 2000, 2002). We suggest that the activity bouts that we have observed are a consequence of retuning of cellular and synaptic properties so that the absence of the currents normally evoked by the neuromodulatory inputs is compensated by other changes in the network. Additionally, the time course of these activity bouts may provide insight into some important aspects of the underlying recovery mechanisms (Golowasch et al. 1999b; Thoby-Brisson and Simmers 2002).
Methods
Animals
All experiments were done using adult rock crabs, Cancer borealis, obtained from local seafood suppliers (Commercial Lobster, Boston, Massachusetts).
Physiological saline
The physiological saline contained in mM: 440 NaCl, 11 KCl, 26 MgCl2, 13 CaCl2, 12 Trizma base and 5 maleic acid; pH 7.4-7.5.
Organ culture
The stomatogastric nervous system (STNS) (Fig. 1A) consisting of the single STG, two commissural ganglia (CoGs) and single esophageal ganglion (OG) was dissected and the STG was desheathed (Selverston and Moulins 1987). All dissection dishes were autoclaved and dissection tools were cleaned and soaked in 70% ethanol for at least ten minutes. All solutions were sterile filtered (0.2 μm, Nalge Nunc Int. Corp., Rochester, NY). The physiological saline used for the dissection additionally contained 50 μg/ml streptomycin and 50 U/ml penicillin (Sigma, St. Louis, MO). After the dissection, and once a stable recording was obtained, the antibiotic concentration was lowered to 25 μg/ml streptomycin and 25 U/ml penicillin. Antibiotic concentrations were as follows: day 2, 25 μg streptomycin and 25 U penicillin per ml; day three, 33 μg streptomycin and 33 U penicillin per ml; additional days, 100 μg/ml gentamicin (Invitrogen Life Technologies, Carlsbad, CA). Preparations were maintained in a humidified low-temperature incubator at 12° to 13° C, and the saline was exchanged approximately every twelve hours.
Fig. 1.

The pyloric rhythm is generated by alternate firing of groups of neurons in the stomatogastric ganglion (STG), and can be recorded from descending motor nerves. A. Schematic drawing of the stomatogastric nervous system preparation including the paired commissural ganglia (CoG) and the single esophageal ganglion (OG), which give rise to descending neuromodulatory input to the STG through the stomatogastric nerve (stn). To remove neuromodulatory input the stn was cut where indicated by the X. Vaseline wells (circles) were used to make extracellular recordings from three motor nerves, the lateral ventricular nerve (lvn), the pyloric dilator nerve (pdn) and the pyloric nerve (pyn). B. An extracellular recording made from the lvn showing the alternate firing of the pyloric dilator (PD), the lateral pyloric (LP) and the pyloric (PY) neurons. C. A phase plot generated from the recording shown in panel B. Phase (Φ) is defined relative to the PD burst onset (see Methods), and shows the relative timing of bursts in each cell. Box onset and end positions are given by the mean ± SD of the Φ values.
Isolation of the STG from descending inputs
The STG was isolated from descending inputs by transection of the stomatogastric nerve (stn). The stn was cut using iridectomy scissors approximately where indicated in Figure 1A. In some cases a Vaseline well filled with isotonic sucrose (750 mM) containing 10−6 M TTX was placed on the stn to block action potential transmission through the stn prior to physically cutting the nerve. This procedure resulted in a more rapid loss of the pyloric rhythm than cutting alone.
Photoablation of neuromodulatory terminals
A Vaseline well was made around the stn as described above and filled with isotonic sucrose and 10−6 M TTX for ∼20 min or until the rhythm began to stop. The sucrose/TTX was then replaced with 10−6 M TTX in water and the stn was cut. After several minutes dextran, tetramethylrhodamine 3000 MW (Molecular Probes, Eugene, OR), or lucifer yellow (Sigma Chemical, St. Louis, MO), was added directly to the well and the preparation was maintained overnight to allow the dye to fill the terminals (11-24 hrs). The following day the preparation was illuminated with a 100 watt mercury bulb for 25-45 min. During the initial stages of the photoablation process the preparations exhibited temporary resumption of the pyloric rhythm, presumably due to injury discharge-induced modulator release from the dying terminals of the descending axons. After photoablation the preparation was returned to the incubator and pyloric output was recorded overnight. To ensure that the terminals were ablated the stn was stimulated the next day with 2.5 Hz trains of 3 ms voltage pulses at amplitudes substantially higher than normally needed to evoke modulator release (up to 100 V). None of the preparations responded to the stn stimulation, indicating that the modulatory terminals were inactivated by the photoablation. This stimulation protocol consistently evoked neuromodulator release, (as assessed by an increase in the pyloric rhythm frequency), in both recovering preparations that had not been photoablated (n = 3/3) and stn-intact control preparations (n = 3/3) (data not shown).
Electrophysiological recordings
Extracellular recordings were performed using monopolar stainless steel electrodes placed into Vaseline wells made around the lateral ventricular nerve (lvn), pyloric dilator nerve (pdn) and pyloric nerve (pyn) (Fig 1A). Recordings were made continuously throughout the culture period, except during solution exchanges. All electrode and ground leads were soaked for at least ten minutes in 70% ethanol. Signals were amplified using A-M systems 1700 differential amplifiers (Carlsborg, WA). Intracellular impalements were performed using 20-30 MΩ microelectrodes filled with 0.6 M K2SO4 and 20 mM KCl. An Axoclamp 2B amplifier (Axon Instruments, Union City, CA) was used in bridge mode to inject DC current into identified pyloric dilator (PD) neurons to alter the pyloric frequency. Signals were recorded to a computer hard drive using pClamp 8 software and a Digidata 1200A or a Digidata 1322A digitizer board (Axon Instruments, Union City, CA).
Data analysis and statistics
Bouts were readily identifiable by eye in extracellular recordings from the lvn and pdn as rapid increases in pyloric rhythm frequency (see Fig. 2B). The rhythm frequency, bout durations and interbout intervals were measured from recordings from the pdn in Clampfit (pClamp 8 software, Axon Instruments, Union City, CA). Analysis of pyloric rhythm frequency and cellular phase relationships were performed using Spike 2 version 4 (Cambridge Electronic Design, Cambridge, England). Phase relationships were defined relative to the onset of the PD burst and were calculated with the following formula: Φ = (X-PDon)/cycle period, where X is the onset or end of the burst of each pyloric network neuron, PD, lateral pyloric (LP) or pyloric (PY) neurons, during the cycle period starting with that PD burst. At least 20 cycles, but typically more were used to calculate phase in each case. Statistical analyses were performed using Sigma Stat software package (SPSS Inc., Chicago, IL). Data are reported as means ± SDs.
Fig. 2.

After transection of the stn the pyloric rhythm rapidly slowed, or stopped and was followed by episodic bouts of activity that preceded a period of stable recovery. A. A plot of instantaneous pyloric frequency over time in culture shows the rapid decrease of the rhythm frequency after cutting the stn (arrow). This preparation remained silent until bouts began to occur after about 10 hr in culture (insets). A period of stable frequency, beginning after approximately 18 hr in culture, followed the period of activity bouts and interbouts. B. A plot of instantaneous pyloric frequency over time for a different preparation than in A that only remained silent for about one hour after transection of the stn. This preparation displayed ongoing activity throughout hours 3-11, but nevertheless displayed bouts of activity (insets). A trace of an extracellular recording made from the lvn of this preparation is shown above the expanded pyloric frequency versus time plot in the inset. This trace corresponds temporally to the frequency plot and shows two activity bouts.
Results
The triphasic pyloric rhythm is illustrated in the extracellular recording from the lvn in Figure 1B. The single LP neuron characteristically generates the largest amplitude action potential in such recordings. LP neuron activity is followed by discharge of several PY neurons (there are 5 PY neurons in C. borealis (Kilman and Marder 1996). The PY neuron burst is terminated by discharge of the 2 PD neurons and the anterior burster neuron (AB) (an interneuron with its axon in the stn). Figure 1C shows block diagrams illustrating the phase of firing of each of the neurons. Together with the AB neuron the two PD cells form the pacemaker kernel for this circuit (Eisen and Marder 1982) and is, for this reason, used as reference for phase analysis. The timing of activity of the LP and PY neurons is set by their intrinsic membrane properties and the synaptic connections within the circuit (Harris-Warrick et al. 1992).
The pyloric rhythm ceases when modulatory inputs are removed, but then recovers
It has been long known that descending inputs from the two CoGs and the single OG are crucial for maintaining a strong and robust pyloric rhythm (Moulins and Cournil 1982; Russell 1976; Selverston and Moulins 1987). In all species studied, acute removal of the influence of these descending inputs always results in a decrease in pyloric rhythm frequency, and often results in a complete cessation of the pyloric rhythm. Complete stomatogastric nervous systems consisting of the STG, OG and CoG's and their intact connecting nerves, however remain rhythmic for several days after dissection when kept sterile (MacLean et al. 2003). In our hands intact Cancer borealis preparations remain stably rhythmic for several days (2-6 days; n = 10, data not shown).
Figure 2 shows plots of pyloric frequency versus time on an extremely slow time base for two preparations in which the stn was transected. Both preparations were rhythmically active at about 1 Hz at the start of the experiment. After removing the anterior modulatory inputs by transecting the stn, both preparations became silent for a period of time. The preparation in Fig 2A remained completely silent until at hour 10 it produced a short bout of low frequency activity. Between then and hour 18 the preparation produced more and more bouts of higher frequency, until by hour 18 a strong pyloric rhythm had recovered. The preparation in the bottom panel showed an overall higher level of activity during recovery and was not completely silent during interbout periods (Fig. 2B). Bouts were distinguishable as a rapid increase in pyloric frequency, and were evident in extracellular recordings made from the lvn (Fig. 2B, inset). In this paper we include data from seventeen preparations recorded continuously for up to 7 days. In all of these preparations the frequency of the pyloric rhythm stopped or decreased to < 10% of control values in the first hours after removal of the modulatory inputs.
The recovery process shows episodic bouts of activity
Individual bouts were identified as a rapid increase in frequency followed by a slower decay back to the interbout frequency. Figure 3 shows the pyloric frequency profiles of individual bouts from three different experiments. In all activity bouts the rate of frequency increase was more rapid than its decay, and the peak frequency range displayed during the bout varied from 2 fold to almost 5 fold. This phenomenon was observed in all preparations; however the rates of rise and decay of individual bouts varied between and within preparations.
Fig. 3.

Individual bouts displayed a rapid rise to peak frequency followed by a slower decrease back to the interbout baseline frequency. Plots of instantaneous pyloric frequency versus time show that bouts rose to peak frequency more quickly than they decayed to baseline. Several individual bouts are plotted for each of three preparations (colored plots).
Figure 4 shows raw data from a preparation following removal of the modulatory inputs, and provides examples of activity patterns at 4 times during the experiment. The top panel shows a control pyloric rhythm with its characteristic PD, LP, PY alternating pattern. The second panel shows a much slower, but triphasic pyloric rhythm seen during a bout that occurred 22 hrs after the stn was cut. The third panel shows an interbout interval after the bout in the previous trace. There was spontaneous activity in the PD, LP and PY neurons, which was nevertheless still organized in the characteristic PD, LP, PY pyloric sequence. Activity between bouts was disorganized and variable, sometimes consisting of a slow triphasic rhythm (as shown in Fig. 4), and other times consisting of irregular firing of LP and/or PY neurons. The fourth panel shows a strong pyloric rhythm recorded after 4.4 days in the same preparation.
Fig. 4.

The triphasic pattern of cell bursting of the pyloric rhythm was altered after stn transection, but resumed during bouts and recovery. Recordings from the lvn show the firing of the PD, LP and PY neurons in control (see inset) and during recovery of the rhythm. A triphasic rhythm is seen in recordings from the same preparation during control, bout and recovery. During interbout periods in this preparation, PD and LP fired periodically with long periods of tonic PY firing, leading to a very low frequency triphasic rhythm.
In 16/17 preparations bouts of activity began 3.16 ± 2.50 hrs after cut or block of the stn, in the other preparation bouts did not begin until 24 hrs after cutting the stn. Bouts occurred in every preparation examined in this study, and ended after 55.9 ± 33.9 hrs, (range: 9-100 hrs), when the rhythm recovered a stable firing pattern. Our criterion for recovery was a strong and stable pyloric rhythm that lasted for at least 5 hours. In 10 preparations the recovered rhythm was stable throughout recordings lasting 5 to 60 hours. In 7 preparations the recovered rhythm was stable for 6 to 50 hours and began to fail after that period. The overall number of bouts, number of bouts per hour, average bout duration or total time spent in an activity bout was not correlated with the time to recovery or with the length of time the stable rhythm lasted after recovery (data not shown).
Frequency in control, bouts, and recovery
Figure 5 compares the mean pyloric frequency in control, bout, interbout, and recovery. The control pyloric rhythm frequency was 1.38 ± 0.4 Hz (n = 17). Pyloric frequency was higher during activity bouts (0.42 ± 0.14 Hz) than during interbouts when a triphasic rhythm was active (0.14 ± 0.05 Hz). The mean frequency during recovery, 0.53 ± 0.33 Hz, was significantly higher than that during interbouts, but no different from that during bouts. The control frequency was significantly higher than that observed during bout, interbout or recovery states (Kruskal-Wallis ANOVA on Ranks, followed by Dunn's Method; p < 0.05).
Fig. 5.

The pyloric rhythm frequency decreased after transection of the stn compared to control, and the frequency increased during bouts and the recovered states compared to interbout periods. Histogram plot of the mean frequency of the pyloric rhythm in control, bout, interbout and recovered states. The control frequency was significantly different from all three other states, but whereas the frequency during bout and recovery states differed from that seen during interbout periods, they did not differ from each other, (Kruskal-Wallis ANOVA on Ranks, followed by Dunn's Method; P < 0.05, n = 17).
Temporal pattern and time course of bouts
The pattern of activity bouts varied widely among preparations, n = 17. The bout duration was not directly correlated with the preceding interbout interval (Fig. 6A) or the subsequent interbout interval (not shown). The total number of bouts varied from 0.16 to 2.35 bouts/hr across preparations (mean 0.96 ± 0.80 bouts/hr). Bout durations varied both within and between preparations and showed no correlation with the total number of events, and no trend over time. Mean bout durations varied from 38 to 883 seconds across preparations, and varied between 8 to 230 fold within preparations. Neither bout duration nor interbout interval showed a trend over time in culture (Fig. 6B,C, data shown for 1 preparation). Some preparations exhibited a cluster of bouts at the beginning or ending of the culture period, (the preparation shown in Fig. 2A showed bouts clustered near the end of the culture period), while other preparations exhibited a relatively even distribution over time, as for the preparation in Fig. 6B, C.
Fig. 6.

Bouts of activity did not occur with a clear temporal pattern. A. A plot of the preceding interbout interval versus the bout duration shows no obvious correlation between the two, n = 17. Most bouts lasted less that 500 sec, and most interbout intervals were shorter than 250 min. This section of the plot is shown in detail in the inset. B. A plot of bout duration versus time in culture for a single preparation. Bout durations showed no temporal relationship during recovery. This preparation showed a relatively even distribution of bouts under 500 sec spread over the entire recovery period. C. A plot of interbout intervals versus time in culture for a single preparation (same as in B). Interbout intervals did not show a temporal relationship during recovery. This plot of interbout interval versus time in culture showed a relatively even distribution of intervals less than 300 min over the course of recovery.
Photoablation of neuromodulatory terminals had no effect on bouts
Because transected axon terminals can be slow to degenerate in crustacean species (Bittner 1991; Parnas et al. 1991, 1998; Royer 1987) it is conceivable that pyloric activity bouts occur due to intermittent release of neuromodulators from axon terminal stumps in the STG neuropil. To determine if this was the case, we back-filled neuromodulatory axon terminals overnight with rhodamine-conjugated dextran beads or Lucifer yellow, and illuminated the STG the next day to photoablate the terminals (Miller and Selverston 1979). We then recorded from the preparations overnight to determine if bouts occurred and the preparation recovered. Figure 7A-D shows extracellular recordings from the lvn at different times during one of these experiments. The graph in Fig. 7D shows pyloric frequency over time in organ culture. This preparation was illuminated for 25 min after 12 hrs in culture when the STG neuropil was clearly dye-filled. Illumination resulted in the damage-related release of neuromodulators from terminals in the STG neuropil, and consequently, an increased pyloric frequency and resumption of a typical triphasic output. After illumination this preparation became briefly silent around hour 16 and subsequently displayed activity bouts for several hours, followed by recovery. Similar results were seen in 6 preparations. High voltage stimulation of the stn stump with 2.5 Hz trains of 3 ms pulses had no effect on the recovered rhythm in any preparation, suggesting that the terminals were no longer active. This stimulation protocol evoked modulator release in both stn-intact and in recovering preparations that had not undergone photoablation (not shown).
Fig. 7.
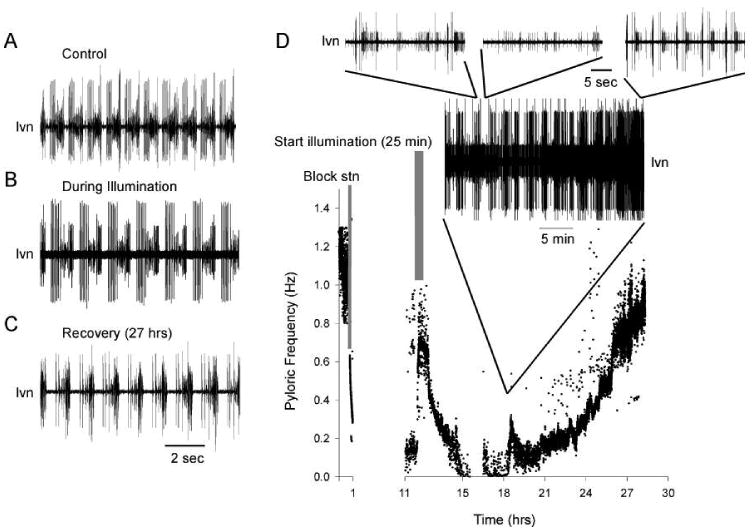
Photoablation of neuromodulatory terminals in the STG neuropil did not stop bouts or recovery. A. A trace showing the triphasic pyloric rhythm output recorded extracellularly from the lvn under control conditions with the stn intact. The stn was subsequently cut in this preparation and the neuromodulatory terminals were back-filled overnight with Rhodamine-dextran beads. B. During illumination, damage-related release of neuromodulators caused a resumption of the pyloric rhythm as seen in this extracellular recording from the lvn. C. After 27 hrs in culture this preparation regained a triphasic pyloric rhythm output, but at a lower frequency than control. D. A plot of instantaneous pyloric frequency versus time in culture shows that after blocking and cutting the stn (gray bar, left), the pyloric rhythm rapidly stopped. The neuromodulatory terminals were back-filled in this preparation for 11 hrs. Upon illumination (gray bar, right), the pyloric output regained a typical triphasic pattern and increased in frequency due to damage-related neuromodulator release. Within 3 hrs after photoablation this preparation exhibited bouts of activity (shown in expanded extracellular recordings from the lvn), and subsequently recovered a stable triphasic pyloric output.
Dependence of phase on neuromodulatory input
In addition to the burst frequency, the phase relationships of the pyloric network neurons were used to characterize the motor patterns of the network. As the phase relationships of network neurons depend on a variety of synaptic and intrinsic properties (Eisen and Marder 1984; Harris-Warrick et al. 1995b; Hartline and Gassie 1979), these can provide indications of the state of the processes that underlie network dynamics. However, bursting phase and duty cycles of pyloric network neurons also vary as a function of neuromodulatory condition (Eisen and Marder 1984; Harris-Warrick et al. 1995a; Hooper and Marder 1987) and previous work on the lobster, Panulirus interruptus, showed that some of the pyloric network phase relationships are frequency dependent (Hooper 1997a,b). To compare the control phase relationships to phase relationships during bouts and interbouts and after recovery, the changes in frequency in these states had to be taken into account. Therefore, we first examined the effect of frequency on the onset and end phase of the LP and PY neuron firing and the end phase of PD in the control condition, by injecting current into one of the two PD neurons. Figure 8A-C shows raw data and phase plots of the pyloric rhythm in a preparation in which the frequency was altered over a range from 0.5 to 1.5 Hz by current injection into a PD neuron. This individual example shows that at the higher frequencies there was little change in phase, but when the preparation was slowed, the phase of firing of the LP and PY neurons was altered. The pooled data from 7 preparations (Fig. 8D) show that at frequencies below 0.8 Hz the PD neuron terminated its burst at an earlier phase, and the LP neuron (onset and end) and the PY neuron onset phases were also advanced. The PY termination (PYend) did not show this frequency dependence because the PY neurons tend to stay active until they are inhibited by the next PD burst. Thus, PY end phase is always close to 1.
Fig. 8.

Phase relationships for bursting in PD, LP and PY neurons are dependent on pyloric cycle frequency in intact STNS preparations. A. Bursts of action potentials generated by PD, LP and PY occur with a stereotypical frequency (∼ 1 Hz) and phase relationship (Φ) under control conditions, shown in the extracellular recording from the lvn (top) and in the phase plot (bottom). B. By depolarizing a PD neuron with intracellular current injection the pyloric frequency can be increased (top). Phase relationships remain similar to control (bottom). C. Hyperpolarizing a PD neuron decreases pyloric frequency (top), and results in an advance of phase relationship values (bottom). D. A plot of phase values versus a wide range of cycle frequencies were generated by injecting hyperpolarizing or depolarizing current into a PD neuron and recording extracellularly from pyloric nerves (n = 7). Phase values for PDend, LPon, LPend and PYon were strongly frequency dependent below 0.8 Hz. Phase was analyzed for 200 blindly chosen cycles from each preparation.
Figure 9 provides comparisons of the phase relationships of the PD, LP, and PY neurons in control (stn intact), bout, interbout and recovered states. Figure 9A shows the mean phase relationships for eleven preparations that showed clear and unambiguously analyzable pyloric rhythms in each state. The phase of PDend, LPon, LPend and PYon were significantly decreased during bout and interbout states compared to control. During recovery all phase relationships increased compared to bout and interbout, but were still decreased compared to control except LPon. This seems unlikely to be due entirely to increased rhythm frequency in recovery because the frequency recovered to only 43% of control (0.64 ± 0.29 Hz vs. 1.48 ± 0.31 Hz).Figure 9B-E shows plots of phase versus instantaneous pyloric frequency for an individual preparation for control, bout, interbout and recovered states (colored circles). The phase relationships for control (black) and recovered (blue) states are similar despite having different frequency ranges, whereas bout (orange) and recovered (blue) have different phase relationships, but have overlapping frequency ranges. This suggests that the delay in phase seen in pyloric rhythm recovery is not only a consequence of changes in bursting frequency.
Fig. 9.

The phase relationships of bursting in PD, LP and PY are smaller during bouts and interbouts as compared to control and recovery. A. Phase plots are shown from eleven preparations with unambiguously analyzable data in each state: control (black), during bouts (orange), interbouts (green) and recovery (blue). Phase relationships were significantly decreased in bout and interbout states as compared to control. During recovery all phase relationships were increased compared to bout and interbout, but were still smaller than control, with the exception of LPon. Data were compared using Kruskal-Wallis ANOVA on Ranks followed by Dunn's Method; * P < 0.05. B.-E. Plots of phase relationships versus instantaneous pyloric frequency from a single preparation. In each case, (PDend in panel B, LPon in panel C, LPend in panel D and PYon in panel E), both phase and frequency was decreased during bouts (orange circles) and interbouts (green circles) as compared to control (black). However, in the recovered state (blue circles), phase increased while the frequency remained similar to values observed during bouts.
To separate better the change in phase during recovery from the confound arising from the fact that phase is frequency dependent at low frequencies, we compared phase relationships for PDend, LPon, LPend and PYon in seven preparations that displayed overlapping frequencies during bouts and recovery. For each preparation, data were selected from a 0.1 Hz bin that showed overlap between pyloric frequency in bouts and during recovery such that the frequencies were not statistically different. There was not sufficient overlap in frequency to include data from control or interbout intervals. Figure 10A shows histogram plots of phase values during bouts (open bars) and recovered state (filled bars) for each of the seven preparations, demonstrating that for LPend, LPon and PYon, at the same frequency, phase was delayed during recovery relative to that during bouts. In each preparation this reached statistical significance (P < 0.001), except in one case for LPend (third panel). For comparison, the preparation shown in Fig. 9B-E is represented by the second pair of columns from the right in each graph in Fig. 10A, filled circle. Mean values for each neuronal phase relationship were: PDend, 0.12 ± 0.01 Hz vs. 0.14 ± 0.02 Hz; LPon 0.28 ± 0.02 Hz vs. 0.37 ± 0.03 Hz; LPend 0.45 ± 0.05 Hz vs. 0.56 ± 0.05 Hz; PYon 0.48 ± 0.04 Hz vs. 0.60 ± 0.04 Hz, for bout vs. recovered, respectively. Interestingly, the phase relationship for PDend did not differ greatly between bout and recovery in most preparations, which suggests that the differences seen in phase for the other cells are not simply due to changes in frequency. Figure 10B compares data from 3 additional preparations in which the PD neurons were hyperpolarized by current injection in control and/or after recovery so that the phase could be compared at the same frequency in control and after recovery. This comparison shows that the phase in the recovered preparations were delayed relative to the control preparations.
Fig. 10.

Frequency controlled neuronal phase relationships after recovery compared with phase relationships during activity bouts and during control. Data are shown as histogram plots of phase values (Φ) under two conditions, and pairs of data correspond to different experiments. Open bars represent data during bouts (in A) and control (in B) and filled bars represent data after recovery. Panels from top to bottom correspond to comparisons of phase values of the end of the PD burst (PDend), beginning and end of the LP burst (LPon and LPend, respectively), and the beginning of the PY burst (PYon). A. Preparations during bouts and after recovery were compared for 7 preparations that displayed overlapping frequencies in the two states. In four preparations the phase of PDend was similar, but in three preparations PDend was significantly larger in recovery than during bouts. In every case of the phase histograms for LPon, LPend and PYon, except one (last set of LPend), phase values were larger after recovery than during bouts. Note that the phase relationships for the same preparation shown in Fig. 9B-E are shown for a frequency of 0.5 Hz in each graph (filled circles). B. Phase relationships are plotted for three preparations in which the pyloric frequency was modified by current injection into one PD neuron during control and/or recovery to match the frequencies between control and recovery. These 3 experiments are from different preparations as those shown in A. In all cases but one (PDend, middle) there is a significantly higher phase value after recovery as compared to control for each phase value (PDend, LPon, LPend and PYon). Data were compared using either Student's t-test for normally distributed data sets or the Mann-Whitney rank sum test for non-normally distributed data; ***, P < 0.001.
Blockade of glutamatergic synapses in the STG does not prevent bouts or recovery
An alteration of the pyloric network that results in compensation for loss of neuromodulation and resumption of output could arise through changes in the intrinsic properties of individual neurons and/or changes in synaptic properties of the pyloric network. Glutamate and acetylcholine are the principal transmitters at synapses between STG neurons (Eisen and Marder 1982). Picrotoxin (PTX) blocks graded and spike-mediated glutamatergic synaptic transmission among STG neurons, therefore its application disconnects much of the network (Bidaut 1980; Marder and Eisen 1984). In order to test whether alterations in glutamatergic synapses were involved in the recovery process we applied PTX during recovery from stn transection in culture. The PTX was applied shortly before transection of the stn and allowed to remain until the preparation recovered. In control, pyloric neuron groups burst alternately creating a triphasic pattern (Fig. 11A). With the stn intact, application of 10−5 M PTX disrupted, but did not stop the pyloric rhythm (Fig. 11B). In the presence of PTX, bursts in the pyloric neurons overlapped temporally before and after recovery (Fig. 11C-E). The triphasic pattern of alternate bursts returned when PTX was washed off (Fig. 11F). Six out of nine preparations displayed activity bouts and recovered in PTX.
Fig. 11.
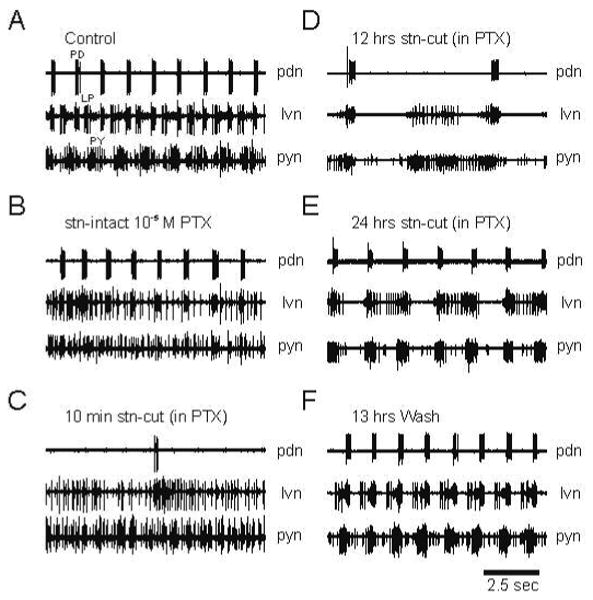
Blocking glutamatergic synaptic transmission between STG neurons alters the pyloric rhythm, but does not block rhythm recovery. Extracellular recordings from the pdn, lvn and pyn. A. Control preparation. B. With the stn intact, 10-5 M picrotoxin (PTX) alters the triphasic pyloric rhythm due to uncoupling of many of the neurons. C. and D. After cutting the stn the pyloric rhythm, and PD bursts decreased in frequency. E. After 24 hrs this preparation regained a stable rhythmic output. However, the pyloric neurons exhibited overlapping bursts, as opposed to the normal alternating triphasic bursting pattern seen in control. F. Thirteen hours after wash-out of PTX the pyloric rhythm had recovered and displayed the typical alternating triphasic pattern.
Discussion
Adult central pattern generating networks must maintain the ability to produce stable neuronal outputs over long time periods, in some cases over many years. Nonetheless, they must also be responsive to the animal's behavioral needs in the short-term. Sensory and neuromodulatory control systems enable the animal to adapt the output of its circuits to the specific behavioral context in which the animal is found. At the same time there must be a stable “baseline state” to which central pattern generating networks return after short-term perturbations. In this study we use the pyloric rhythm of the adult crab as a model system in which to study the return to a “baseline state” in response to long-term removal of descending neuromodulatory inputs.
Adult crabs live many years, and the animals that we used in this study were several years old. In vivo recordings from behaving crabs showed ongoing pyloric rhythms in the 0.2-0.4 Hz frequency range in unfed animals, while rhythms of 1.0-1.5 Hz were routinely seen subsequent to feeding (R. Zarum and E. Marder, unpublished results). Thus, in the behaving animal the unfed “baseline state” has frequencies similar to those that we obtain subsequent to recovery after removal of descending modulatory inputs (Golowasch et al. 1999b).
Bout properties
Bouts of activity occurred in all preparations that showed recovery in this study, but the temporal pattern of the bouts and the overall number of bouts was highly variable between and within preparations. Although bouts had not been previously reported in decentralized STG preparations (Golowasch et al. 1999b; Mizrahi et al. 2001; Thoby-Brisson and Simmers 1998), in the earlier studies recordings were not made continuously and the low frequency of activity bouts, (on average, one ∼3 min bout per hour), would make them easily overlooked without continuous recordings.
The episodic bouts of activity characterized in this study in some ways resemble spontaneous activity bouts seen in developing neural networks in many systems (Ben-Ari 2001; Kamioka et al. 1996; Katz and Shatz 1996; Murphy et al. 1992; O'Donovan 1999). Similar spontaneous bursts are also observed in epileptiform bursting in adult hippocampal CA3 networks (Staley et al. 1998). Bouts of activity in these other systems are thought to be important for guiding the appropriate construction of the developing networks (Ben-Ari 2001; Katz and Shatz 1996; O'Donovan 1999). An attractive possibility is that bouts in the recovering pyloric network represent a similar underlying mechanism that guides the restructuring of the pyloric network to allow a physiologically meaningful output. Nonetheless, there are some important differences between bouts seen in developing motor systems and the bouts we see in the recovering pyloric network. There does not seem to be a refractory period or activity-dependent depression following bouts in the pyloric network because we observed no correlation between bout duration and the preceding or subsequent interbout interval. In contrast, a refractory period is thought to be a common factor contributing to episodic bouts in a variety of developing neural networks (O'Donovan 1999). Additionally, activity bouts did not appear to be related to recovery of phase or frequency of the pyloric rhythm. The overall number of activity bouts, number of bouts per hour, overall time spent in activity bouts or average bout duration in a given preparation was not correlated with the time to recovery or the percentage recovery of phase or frequency in our study. This is in contrast to developmental changes such as that occurring in the delayed rectifier potassium current kinetics seen in amphibian spinal neurons, that are dependent on spontaneous activity bouts in a particular frequency range (Gu and Spitzer 1995) Nevertheless, bouts of activity were consistently associated with rhythm recovery and ceased when a stable rhythm was generated. The discontinuous nature of the recovery process and the intermittent nature of activity bouts suggests that the underlying mechanism itself is discontinuous, or is dependent on several competing processes that must reach equilibrium before the rhythm can resume stably. In the future it will be important to determine if activity bouts are a necessary process that regulate pyloric rhythm recovery or if they are an epiphenomenon that occurs due to another underlying homeostatic process.
What processes might cause the bouts that we have observed? In developing retina and spinal cord it is believed that spontaneous bouts of activity are caused by excitatory GABAergic, glutamatergic or cholinergic synaptic contacts through network-dependent mechanisms, while the duration of the interbout is determined by the recovery from synaptic depression or depletion (Chub and O'Donovan 1998; Feller 1999; Feller et al. 1996). As all chemical synapses among the pyloric network neurons are inhibitory it is possible that an endogenous burst in any pyloric network neuron could trigger a bout by a postinhibitory rebound-like mechanism. This seems unlikely, because we observed that blockade of glutamatergic synaptic transmission between STG neurons did not block either the appearance of the bouts or recovery. Additionally, we saw no evidence for a refractory period following bouts. However, this does not rule out that the cholinergic STG synapses might trigger bouts.
We showed that both the recovery process and bouts persist after descending modulatory inputs were photoablated. This indicates that activity in the presynaptic terminals of the descending modulatory neurons is not solely responsible for the production of bouts. We observed that neuronal phase relationships were different in recovered preparations compared to during bouts or control at a given frequency. Because, the phase relationships are determined by the intrinsic membrane properties of STG neurons and their synaptic connections, one or many of these properties may be altered during recovery. Evidence suggests that the recovery process involves changes in the intrinsic properties of the pyloric neurons (Golowasch et al. 1999b; Mizrahi et al. 2001; Thoby-Brisson and Simmers 2002) as they retune themselves in response to their altered environment and level of activity (Golowasch et al. 1999a; Soto-Trevino et al. 2001). Thoby-Brisson and Simmers (2002) reported that in the lobster, Jasus lalandii, the delayed rectifier and calcium-dependent potassium currents were downregulated and the hyperpolarization-activated cation current was upregulated in PD neurons following rhythm recovery. This alteration of membrane currents favors endogenous, regenerative bursting behavior, which PD neurons do not possess immediately after stn transection. A large increase in the propensity of the pacemaker kernel to display bursting behavior, as suggested by Thoby-Brisson and Simmers (2002), could account for rhythm recovery. However, an alternative possibility is that many small changes could occur in the intrinsic properties of many of the pyloric neurons, or their synaptic contacts, that together account for rhythm recovery. Future experiments will be needed to determine how much each of these potential mechanisms contribute to rhythm recovery in the pyloric network
A similar mechanism is believed to occur in recovery of spontaneous activity of neurons of the vestibular nucleus complex following deafferentation (Darlington et al. 2002). If channel densities are functionally linked to neuronal activity, as suggested by modeling studies (LeMasson et al. 1993; Liu et al. 1998) it can be imagined that activity bouts arise as channel densities are altered. An incremental change in one or more membrane conductance may allow a temporary resumption of the pyloric rhythm, but further changes in membrane conductances could result in the network falling silent again. The rhythm could switch on and off in this manner until the processes that link activity and membrane conductances reach equilibrium. If this were true then the pattern of bouts over time and the time to recovery would depend on the initial conditions of the network elements. This is likely to be different for each preparation, explaining the variability we see in the recovery process. Recent work (MacLean et al. 2003) showed that over-expression of A-type potassium channels subsequent to mRNA injection, resulted in little change in PD neuron activity as the increase in A-type channel density was accompanied by a compensating increase in an inwardly rectifying cation channel. These data add to a growing body of evidence arguing for a number of homeostatic mechanisms, both activity dependent and independent, that may act together during recovery processes to reinstate baseline activity.
Crabs must benefit greatly from having a high degree of stability in a system that is essential to life such as the pyloric network. Indeed, a highly plastic or unstable feeding pattern generating network would be seriously detrimental to any animal. The processes that maintain a stable pyloric network may be common to many rhythmic networks, including essential systems such as those that control breathing, circulatory or digestive processes. The mechanisms that stabilize the pyloric network seem to be highly versatile, as they can compensate for a change as dramatic as complete removal of all neuromodulatory input. Understanding these processes in the pyloric network will help elucidate mechanisms that maintain stability in neural networks in general during learning, physical growth, development and in disease.
Acknowledgments
We thank Dr. William Miller for help with data analysis in the early stages of this work and Dirk Bucher, Ph. D. for invaluable help with Spike 2 analysis. We especially thank Dr. Farzan Nadim for his generous support of JG, JY and CR during part of this project. Research supported by R01 MH 64711 (JG), R37 MH 46742 (EM), T32 NS07292 (JL) and an undergraduate summer IGERT 9972756 NSF (AR).
References
- Ben-Ari Y. Developing networks play a similar melody. Trends Neurosci. 2001;24:353–360. doi: 10.1016/s0166-2236(00)01813-0. [DOI] [PubMed] [Google Scholar]
- Ben-Ari Y, Cherubini E, Corradetti R, Gaiarsa JL. Giant synaptic potentials in immature rat CA3 hippocampal neurones. J Physiol. 1989;416:303–325. doi: 10.1113/jphysiol.1989.sp017762. [DOI] [PMC free article] [PubMed] [Google Scholar]
- Bidaut M. Pharmacological dissection of pyloric network of the lobster stomatogastric ganglion using picrotoxin. J Neurophysiol. 1980;44:1089–1101. doi: 10.1152/jn.1980.44.6.1089. [DOI] [PubMed] [Google Scholar]
- Bittner GD. Long-term survival of anucleate axons and its implications for nerve regeneration. Trends Neurosci. 1991;14:188–193. doi: 10.1016/0166-2236(91)90104-3. [DOI] [PubMed] [Google Scholar]
- Chub N, O'Donovan MJ. Blockade and recovery of spontaneous rhythmic activity after application of neurotransmitter antagonists to spinal networks of the chick embryo. J Neurosci. 1998;18:294–306. doi: 10.1523/JNEUROSCI.18-01-00294.1998. [DOI] [PMC free article] [PubMed] [Google Scholar]
- Darlington CL, Dutia MB, Smith PF. The contribution of the intrinsic excitability of vestibular nucleus neurons to recovery from vestibular damage. Eur J Neurosci. 2002;15:1719–1727. doi: 10.1046/j.1460-9568.2002.02024.x. [DOI] [PubMed] [Google Scholar]
- Eisen JS, Marder E. Mechanisms underlying pattern generation in lobster stomatogastric ganglion as determined by selective inactivation of identified neurons. III. Synaptic connections of electrically coupled pyloric neurons. J Neurophysiol. 1982;48:1392–1415. doi: 10.1152/jn.1982.48.6.1392. [DOI] [PubMed] [Google Scholar]
- Eisen JS, Marder E. A mechanism for production of phase shifts in a pattern generator. Neurophysiol. 1984;51:1375–1393. doi: 10.1152/jn.1984.51.6.1375. [DOI] [PubMed] [Google Scholar]
- Feller MB. Spontaneous correlated activity in developing neural circuits. Neuron. 1999;22:653–656. doi: 10.1016/s0896-6273(00)80724-2. [DOI] [PubMed] [Google Scholar]
- Feller MB, Wellis DP, Stellwagen D, Werblin FS, Shatz CJ. Requirement for cholinergic synaptic transmission in the propagation of spontaneous retinal waves. Science. 1996;272:1182–1187. doi: 10.1126/science.272.5265.1182. [DOI] [PubMed] [Google Scholar]
- Garaschuk O, Hanse E, Konnerth A. Developmental profile and synaptic origin of early network oscillations in the CA1 region of rat neonatal hippocampus. J Physiol. 1998;507(Pt 1):219–236. doi: 10.1111/j.1469-7793.1998.219bu.x. [DOI] [PMC free article] [PubMed] [Google Scholar]
- Golowasch J, Abbott LF, Marder E. Activity-dependent regulation of potassium currents in an identified neuron of the stomatogastric ganglion of the crab Cancer borealis. J Neurosci. 1999a;19:RC33. doi: 10.1523/JNEUROSCI.19-20-j0004.1999. [DOI] [PMC free article] [PubMed] [Google Scholar]
- Golowasch J, Casey M, Abbott LF, Marder E. Network stability from activity-dependent regulation of neuronal conductances. Neural Comput. 1999b;11:1079–1096. doi: 10.1162/089976699300016359. [DOI] [PubMed] [Google Scholar]
- Gu X, Spitzer NC. Distinct aspects of neuronal differentiation encoded by frequency of spontaneous Ca2+ transients. Nature. 1995;375:784–787. doi: 10.1038/375784a0. [DOI] [PubMed] [Google Scholar]
- Harris-Warrick RM, Coniglio LM, Barazangi N, Guckenheimer J, Gueron S. Dopamine modulation of transient potassium current evokes phase shifts in a central pattern generator network. J Neurosci. 1995a;15:342–358. doi: 10.1523/JNEUROSCI.15-01-00342.1995. [DOI] [PMC free article] [PubMed] [Google Scholar]
- Harris-Warrick RM, Coniglio LM, Levini RM, Gueron S, Guckenheimer J. Dopamine modulation of two subthreshold currents produces phase shifts in activity of an identified motoneuron. J Neurophysiol. 1995b;74:1404–1420. doi: 10.1152/jn.1995.74.4.1404. [DOI] [PubMed] [Google Scholar]
- Harris-Warrick RM, Marder E, Selverston AI, Moulins M. Dynamic Biological Networks The Stomatogastric Nervous System. Cambridge: MIT Press; 1992. [Google Scholar]
- Hartline DK, Gassie DV., Jr Pattern generation in the lobster (Panulirus) stomatogastric ganglion. I. Pyloric neuron kinetics and synaptic interactions. Biol Cybern. 1979;33:209–222. doi: 10.1007/BF00337410. [DOI] [PubMed] [Google Scholar]
- Him A, Dutia MB. Intrinsic excitability changes in vestibular nucleus neurons after unilateral deafferentation. Brain Res. 2001;908:58–66. doi: 10.1016/s0006-8993(01)02600-2. [DOI] [PubMed] [Google Scholar]
- Holliday J, Spitzer NC. Spontaneous calcium influx and its roles in differentiation of spinal neurons in culture. Dev Biol. 1990;141:13–23. doi: 10.1016/0012-1606(90)90098-4. [DOI] [PubMed] [Google Scholar]
- Hooper SL. Phase maintenance in the pyloric pattern of the lobster (Panulirus interruptus) stomatogastric ganglion. J Comput Neurosci. 1997a;4:191–205. doi: 10.1023/a:1008822218061. [DOI] [PubMed] [Google Scholar]
- Hooper SL. The pyloric pattern of the lobster (Panulirus interruptus) stomatogastric ganglion comprises two phase maintaining subsets. J Comput Neurosci. 1997b;4:207–219. doi: 10.1023/a:1008867702131. [DOI] [PubMed] [Google Scholar]
- Hooper SL, Marder E. Modulation of the lobster pyloric rhythm by the peptide proctolin. J Neurosci. 1987;7:2097–2112. doi: 10.1523/JNEUROSCI.07-07-02097.1987. [DOI] [PMC free article] [PubMed] [Google Scholar]
- Jones EG. Cortical and subcortical contributions to activity-dependent plasticity in primate somatosensory cortex. Annu Rev Neurosci. 2000;23:1–37. doi: 10.1146/annurev.neuro.23.1.1. [DOI] [PubMed] [Google Scholar]
- Kamioka H, Maeda E, Jimbo Y, Robinson HP, Kawana A. Spontaneous periodic synchronized bursting during formation of mature patterns of connections in cortical cultures. Neurosci Lett. 1996;206:109–112. doi: 10.1016/s0304-3940(96)12448-4. [DOI] [PubMed] [Google Scholar]
- Katz LC, Shatz CJ. Synaptic activity and the construction of cortical circuits. Science. 1996;274:1133–1138. doi: 10.1126/science.274.5290.1133. [DOI] [PubMed] [Google Scholar]
- Kilman VL, Marder E. Ultrastructure of the stomatogastric ganglion neuropil of the crab, Cancer borealis. J Comp Neurol. 1996;374:362–375. doi: 10.1002/(SICI)1096-9861(19961021)374:3<362::AID-CNE5>3.0.CO;2-#. [DOI] [PubMed] [Google Scholar]
- Landmesser LT, O'Donovan MJ. Activation patterns of embryonic chick hind limb muscles recorded in ovo and in an isolated spinal cord preparation. J Physiol. 1984a;347:189–204. doi: 10.1113/jphysiol.1984.sp015061. [DOI] [PMC free article] [PubMed] [Google Scholar]
- Landmesser LT, O'Donovan MJ. The activation patterns of embryonic chick motoneurones projecting to inappropriate muscles. J Physiol. 1984b;347:205–224. doi: 10.1113/jphysiol.1984.sp015062. [DOI] [PMC free article] [PubMed] [Google Scholar]
- LeMasson G, Marder E, Abbott LF. Activity-dependent regulation of conductances in model neurons. Science. 1993;259:1915–1917. doi: 10.1126/science.8456317. [DOI] [PubMed] [Google Scholar]
- Liu Z, Golowasch J, Marder E, Abbott LF. A model neuron with activity-dependent conductances regulated by multiple calcium sensors. J Neurosci. 1998;18:2309–2320. doi: 10.1523/JNEUROSCI.18-07-02309.1998. [DOI] [PMC free article] [PubMed] [Google Scholar]
- MacLean JN, Zhang Y, Johnson BR, Harris-Warrick RM. Activity-independent homeostasis in rhythmically active neurons. Neuron. 2003;37:109–120. doi: 10.1016/s0896-6273(02)01104-2. [DOI] [PubMed] [Google Scholar]
- Marder E, Eisen JS. Transmitter identification of pyloric neurons: electrically coupled neurons use different neurotransmitters. J Neurophysiol. 1984;51:1345–1361. doi: 10.1152/jn.1984.51.6.1345. [DOI] [PubMed] [Google Scholar]
- Meister M, Wong RO, Baylor DA, Shatz CJ. Synchronous bursts of action potentials in ganglion cells of the developing mammalian retina. Science. 1991;252:939–943. doi: 10.1126/science.2035024. [DOI] [PubMed] [Google Scholar]
- Miller JP, Selverston A. Rapid killing of single neurons by irradiation of intracellularly injected dye. Science. 1979;206:702–704. doi: 10.1126/science.386514. [DOI] [PubMed] [Google Scholar]
- Mizrahi A, Dickinson PS, Kloppenburg P, Fenelon V, Baro DJ, Harris-Warrick RM, Meyrand P, Simmers J. Long-term maintenance of channel distribution in a central pattern generator neuron by neuromodulatory inputs revealed by decentralization in organ culture. J Neurosci. 2001;21:7331–7339. doi: 10.1523/JNEUROSCI.21-18-07331.2001. [DOI] [PMC free article] [PubMed] [Google Scholar]
- Moulins M, Cournil I. All-or-none control of the bursting properties of the pacemaker neurons of the lobster pyloric pattern generator. J Neurobiol. 1982;13:447–458. doi: 10.1002/neu.480130506. [DOI] [PubMed] [Google Scholar]
- Murphy TH, Blatter LA, Wier WG, Baraban JM. Spontaneous synchronous synaptic calcium transients in cultured cortical neurons. J Neurosci. 1992;12:4834–4845. doi: 10.1523/JNEUROSCI.12-12-04834.1992. [DOI] [PMC free article] [PubMed] [Google Scholar]
- O'Donovan MJ. The origin of spontaneous activity in developing networks of the vertebrate nervous system. Curr Opin Neurobiol. 1999;9:94–104. doi: 10.1016/s0959-4388(99)80012-9. [DOI] [PubMed] [Google Scholar]
- O'Donovan MJ, Chub N, Wenner P. Mechanisms of spontaneous activity in developing spinal networks. J Neurobiol. 1998;37:131–145. doi: 10.1002/(sici)1097-4695(199810)37:1<131::aid-neu10>3.0.co;2-h. [DOI] [PubMed] [Google Scholar]
- Parnas I, Dudel J, Atwood HL. Synaptic transmission in decentralized axons of rock lobster. J Neurosci. 1991;11:1309–1315. doi: 10.1523/JNEUROSCI.11-05-01309.1991. [DOI] [PMC free article] [PubMed] [Google Scholar]
- Parnas I, Shahrabany-Baranes O, Feinstein N, Grant P, Adelsberger H, Dudel J. Changes in the ultrastructure of surviving distal segments of severed axons of the rock lobster. J Exp Biol. 1998;201(Pt 6):779–791. doi: 10.1242/jeb.201.6.779. [DOI] [PubMed] [Google Scholar]
- Royer SM. Chronic effects of de-afferentation on the stomatogastric ganglion of Panulirus. In: Selverston AI, Moulins M, editors. The crustacean stomatogastric nervous system. Berlin: Springer-Verlag; 1987. pp. 251–257. [Google Scholar]
- Russell DF. Rhythmic excitatory inputs to the lobster stomatogastric ganglion. Brain Res. 1976;101:582–588. doi: 10.1016/0006-8993(76)90482-0. [DOI] [PubMed] [Google Scholar]
- Russell DF. CNS control of pattern generators in the lobster stomatogastric ganglion. B rain Res. 1979;177:598–602. doi: 10.1016/0006-8993(79)90480-3. [DOI] [PubMed] [Google Scholar]
- Russell DF, Hartline DK. Bursting neural networks: a reexamination. Science. 1978;200:453–456. doi: 10.1126/science.644309. [DOI] [PubMed] [Google Scholar]
- Selverston AI, Moulins M. The Crustacean Stomatogastric System. Berlin: Springer-Verlag; 1987. p. 338. [Google Scholar]
- Soto-Trevino C, Thoroughman KA, Marder E, Abbott LF. Activity-dependent modification of inhibitory synapses in models of rhythmic neural networks. Nat Neurosci. 2001;4:297–303. doi: 10.1038/85147. [DOI] [PubMed] [Google Scholar]
- Staley KJ, Longacher M, Bains JS, Yee A. Presynaptic modulation of CA3 network activity. Nat Neurosci. 1998;1:201–209. doi: 10.1038/651. [DOI] [PubMed] [Google Scholar]
- Thoby-Brisson M, Simmers J. Neuromodulatory inputs maintain expression of a lobster motor pattern-generating network in a modulation-dependent state: evidence from long-term decentralization In Vitro. J Neurosci. 1998;18:212–2225. doi: 10.1523/JNEUROSCI.18-06-02212.1998. [DOI] [PMC free article] [PubMed] [Google Scholar]
- Thoby-Brisson M, Simmers J. Transition to endogenous bursting after long-term decentralization requires de novo transcription in a critical time window. J Neurophysiol. 2000;84:596–599. doi: 10.1152/jn.2000.84.1.596. [DOI] [PubMed] [Google Scholar]
- Thoby-Brisson M, Simmers J. Long-term neuromodulatory regulation of a motor pattern-generating network: maintenance of synaptic efficacy and oscillatory properties. J Neurophysiol. 2002;88:2942–2953. doi: 10.1152/jn.00482.2001. [DOI] [PubMed] [Google Scholar]
- Vaculin S, Franek M, Rokyta R. Dorsal rhizotomy changes the spontaneous neuronal activity of nuclei in the medial thalamus. Physiol Res. 2000;49:279–283. [PubMed] [Google Scholar]
- Weng HR, Lee JI, Lenz FA, Schwartz A, Vierck C, Rowland L, Dougherty PM. Functional plasticity in primate somatosensory thalamus following chronic lesion of the ventral lateral spinal cord. Neuroscience. 2000;101:393–401. doi: 10.1016/s0306-4522(00)00368-7. [DOI] [PubMed] [Google Scholar]
- Wong RO, Chernjavsky A, Smith SJ, Shatz CJ. Early functional neural networks in the developing retina. Nature. 1995;374:716–718. doi: 10.1038/374716a0. [DOI] [PubMed] [Google Scholar]
- Wong ROL. Retinal waves and visual system development. Annu Rev Neurosci. 1999;22:29–47. doi: 10.1146/annurev.neuro.22.1.29. [DOI] [PubMed] [Google Scholar]