Abstract
Lysophosphatidic acid (LPA), a naturally occurring bioactive lysophospholipid increases the expression of both pro-inflammatory and anti-inflammatory mediators in airway epithelial cells. sST2 Soluble ST2 (sST2), an anti-inflammatory mediator, has been known to function as a decoy receptor of interleukin (IL)-33 and attenuate endotoxin-induced inflammatory responses. Here, we show that. LPA increased sST2 mRNA expression and protein release in a dose and time dependent manner in human bronchial epithelial cells (HBEpCs). LPA receptors antagonist and Gαi inhibitor, pertussis toxin, attenuated LPA-induced sST2 release. Inhibition of NF-κB or JNK pathway reduced LPA-induced sST2 release. LPA treatment decreased histone deacetylase 3 (HDAC3) expression and enhanced acetylation of histone H3 at lysine 9 that binds to the sST2 promoter region. Furthermore, limitation of intracellular LPA generation by the down-regulation of acetyl glycerol kinase attenuated exogenous LPA-induced histone H3 acetylation on sST2 promoter region, as well as sST2 gene expression. Treatment of HBEpCs with recombinant sST2 protein or sST2-rich cell culture media attenuated endotoxin-induced phosphorylation of PKC and airway epithelial barrier disruption. These results unravel a novel sST2 mediated signaling pathway that has physiological relevance to airway inflammation and remodeling.
Keywords: lysophospholipid, soluble ST2, gene expression, histone acetylation, epithelial barrier function
1. Introduction
Lysophosphatidic acid (LPA) is a bioactive phospholipid that plays an important role in several signaling pathways. It has been detected in various biological fluids, including plasma [1] and bronchoalveolar lavage (BAL) fluids [2, 3]. Elevated level of plasma LPA is considered as a biomarker for ovarian cancer [4]. So far, seven G protein-coupled LPA receptors (LPA1–7) have been cloned and characterized [5–7]. LPA treatment induces activation of transcriptional factors (such as NF-κB, AP-1, and C/EBPβ) and signaling pathways (such as MAPKs and PKC) [5, 7]. Increasing evidences show that LPA plays a dual role in airway inflammation. Increases in LPA level are detected in BAL fluids from challenged asthmatic [2], idiopathic pulmonary fibrosis (IPF) patients [3], and murine models of asthma [8] and fibrosis [3]. LPA treatment increases IL-8 secretion in human bronchial epithelial cells (HBEpCs) [9–11] that results in neutrophil influx into alveolar spaces [8, 9], thereby suggesting a pro-inflammatory role for LPA. However, recent findings show that LPA exhibits an anti-inflammatory effect on airways. For instance, LPA treatment of HBEpCs attenuates IL-13-induced signals through increasing expression of IL-13 decoy receptor, IL-13Rα [12]. LPA enhances airway epithelial barrier integrity by inducing the accumulation of E-cadherin at cell-cell contacts [13]. Intratracheal or intravenous administration of LPA significantly protects against lipopolysaccharide (LPS)-induced lung injury [13, 14].
ST2, an IL-1 receptor related protein, consists of four isoforms, soluble secreted form (sST2), transmembrane form (ST2L), ST2V, and ST2LV [15]. sST2 binds to IL-33, and not to IL-1α, IL-1β, and IL-1 antagonist [16], and functions as a decoy receptor of IL-33[17]. In IL-33 receptor over-expressed murine thymoma cells (EL4), pretreatment with sST2 suppressed IL-33-induced NF-κB activity and IL-4, IL-5, and IL-13 expression [17]. sST2 has been implicated as an anti-inflammatory mediator in inflammatory responses [17–22]. Pretreatment with recombinant sST2 protein attenuates LPS-induced expression of TNF, IL-6, and IL-12 in macrophages [18, 20]. Over-expression of sST2 reduces LPS-induced TNF, IL-6, and TLR4 levels in serum and myeloperoxidase activity in lung, and protests against LPS-induced pulmonary inflammation in a murine model of lung injury [22].
The sST2 gene was first identified in fibroblasts [23, 24]. Serum sST2 levels are significantly elevated in patients with idiopathic pulmonary fibrosis [25], heart failure [26–29], and other immune diseases [30]. In hematopoietic cells, -26999G/A SNP predominantly regulates ST2 gene expression [31]. The current study by using human bronchial epithelial cells, demonstrates that sST2 gene expression is up-regulated by the bioactive lysophospholipid, LPA. We show here that LPA induces both sST2 mRNA expression and protein release through activation of transcription factors NF-κB and AP-1, and histone acetylation at sST2 promoter region. Further, sST2 has a protective effect against LPS-induced airway epithelial barrier dysfunction.
2. Materials and methods
2.1. Materials
1-oleoyl (18:1) LPA and ki16425 were purchased from Sigma-Aldrich (St. Louis, MO). Pertusis toxin (PTx) and JNK inhibitor (JNKi II) were from Calbiochem (San Diego, CA). Bay11-7082 was purchased from BioMol (Plymouth Meetings, PA). sST2, PKCα, and E-cadherin (K20) antibody were from Santa Cruz Biotechnology (Santa Cruz, CA). Antibodies to p-PKCα, HDAC1, HDAC2, HDAC3, acetylated lysine, histone H3, and acetylated histone 3 at lysine 9 were from Cell Signaling Technology Inc. (Danvers, MA). Horseradish peroxidase-conjugated goat anti-rabbit and anti-mouse secondary antibodies were purchased from Molecular Probes (Eugene, OR). ECL kit for detection of proteins by Western blotting was obtained from Amersham Pharmacia (Piscataway, NJ). Human recombinant sST2-fc fusion protein was from R&D systems (Minneapolis, MN). Real time PCR reagents were from Bio-Rad Laboratories (Hercules, CA). Bronchial epithelial cell basal medium (BEBM) and supplement kit were purchased from Lonza (Rockville, MD). MILLIPORE TM 10 kit was purchased from Millipore (Bedford, MA). All other reagents were of analytical grade.
2.2. Cell Culture
HBEpCs were purchased from Lonza (Rockville, MD). The passage 1 (P1) HBEpCs were cultured in serum free basal essential growth medium (BEGM) and supplemented with growth factors. Cells were incubated at 37 °C in 5 % CO2 and 95 % air to ~ 80 % confluence and subsequently propagated in 100-mm or 6-well collagen-coated dishes. All experiments were carried out between passages 1 and 4.
2.3. Preparation of Cell Lysates, Media and Western blotting
After the indicated treatments, media were collected and centrifuged at 500 × g for 10 min, and supernatants were concentrated by MILLIPORE TM 10 kit according to manufacturer’s instruction. Cells were rinsed twice with ice-cold PBS and lysed in 200 μl of buffer containing 20 mM Tris-HCl (pH 7.4), 150 mM NaCl, 2 mM EGTA, 5 mM β-glycerophosphate, 1 mM MgCl2, 1 % Triton X-100, 1 mM sodium orthovanadate, 10 μg/ml protease inhibitors, 1 μg/ml aprotinin, 1 μg/ml leupeptin, and 1 μg/ml pepstatin. Cell lysates were incubated at 4 °C for 10 min, sonicated on ice for 10 seconds and centrifuged at 500 × g for 5 min at 4 °C in a microfuge. Protein concentrations were determined with a BCA protein assay kit (Pierce Chemical Co., Rockford, IL) using BSA as standard. Equal amounts of cell lysates (20 μg) or concentrated media (30 μl) were subjected to 10 % SDS/PAGE gels, transferred to polyvinylidene difluoride membranes, blocked with 5 % (w/v) BSA in TBST (25 mM Tris-HCl, pH 7.4, 137 mM NaCl and 0.1 % Tween-20) for 1 h, and incubated with primary antibodies in 5 % (w/v) BSA in TBST for 1–2 h. The membranes were washed at least three times with TBST at 15 min intervals and then incubated with either mouse or rabbit or goat horseradish peroxidase-conjugated secondary antibody (1: 3,000) for 1 h. The membranes were developed with enhanced chemiluminescence detection system according to manufacturer’s instructions.
2.4. RNA Isolation
Total RNA was isolated from cultured HBEpCs using TRIzol® reagent (Life Technology, Rockville, MD) according to the manufacturer’s instructions. RNA was quantified spectrophotometrically and samples with an absorbance ratio of ≥1.8 measured at 260/280 nm were analyzed by Real-time RT-PCR.
2.5. Real-time RT-PCR and Reverse Transcription-PCR
1 μg of RNA was reverse transcripted using cDNA synthesis kit (Bio-Rad) and Real-time PCR and regular PCR were performed to assess expression of the sST2 gene using primers designed based on human mRNA sequences (NM_003856). sST2 forward primer: 5′-ACGTGAAGGAAGAGGATTTATTGCTGC-3′; sST2 reverse primer: 5′-TCAGAAACACTCCTTAC-3′. For real-time RT-PCR, amplicon expression in each sample was normalized to its 18S RNA content. The relative abundance of target mRNA in each sample was calculated as 2 raised to the negative of its threshold cycle value times 106 after being normalized to the abundance of its corresponding 18S [e.g., 2 −(IL-13Rα2 Threshold Cycle)/2 −(18S Threshold Cycle) × 106].
2.6. E-cadherin immunofluorescencestaining
HBEpCs were grown on glass chamber until ~90 % confluence. After treatment, cells were fixed with 3.7 % formaldehyde for 20 min without permeabilization, then immunostained with E-cadherin antibody (K20) and fluorescence second antibody. Images were captured by Nikon ECLIPSE TE 300 inverted microscope.
2.7. Intratracheal Administration of LPA
C57BL/6 mice (8–10-week) were intratracheally administered with LPA (5 μM in 50 μl PBS with 0.1 % BSA). After 3 h and 18 h, lungs were lavaged by an intratracheal injection of 1 ml of PBS solution followed by gentle aspiration; the lavage was repeated twice to recover a total volume of 1.8–2.0 ml. The recovered BAL fluids were processed for determining sST2 levels by Western blotting. All procedures were executed in accordance with approved protocols though the University of Pittsburgh Institutional Animal Care and Use Committee.
2.8. Chip Experiments
After treatment, cells were cross-linked for 5 min with 0.3 % formaldehyde and the reaction was terminated by adding glycine. Cell lysates were sonicated at 4 °C using a sonicator microtip at 50 % – 60 % maximum power. Immunopricipitation were performed with antibodies against to acetylated lysine (KAc) or acetylated histone H3 at lysine 9 (H3K9Ac) and chromatin DNA was extracted with phenol/chloroform followed by ethanol precipitation. sST2 proximal promoter region were detected by regular PCR and realtime PCR with primers localized within sST2 promoter. The sets of PCR primers used for the analysis of the human sST2 proximal promoter were: 5′-CCTCTCAAGGGATTACTCAATG-3′ and 5′-AGACACTCCTCCCATCCTGAAA-3′.
2.9. Measurement of Transepithelial Resistance (TER) by ECIS
HBEpCs were grown to confluence over gold microelectrodes. TER was measured in an electrical cell-substrate impedance sensing system (Applied BioPhysics, Foster city, CA). The total TER measured dynamically across the epithelial monolayer was determined as the combined resistance between the basal surface of the cell and the electrode, reflecting alterations in cell-cell adhesion [7].
2.10. Statistical Analyses
All results were subjected to statistical analysis using one-way ANOVA and, wherever appropriate, the data was also analyzed by Student–Newman-Keuls test and expressed as mean ± S.D. Data was collected from at least three independent experiments and P < 0.05 was considered significant.
3. Results
3.1. LPA induces sST2 expression and release
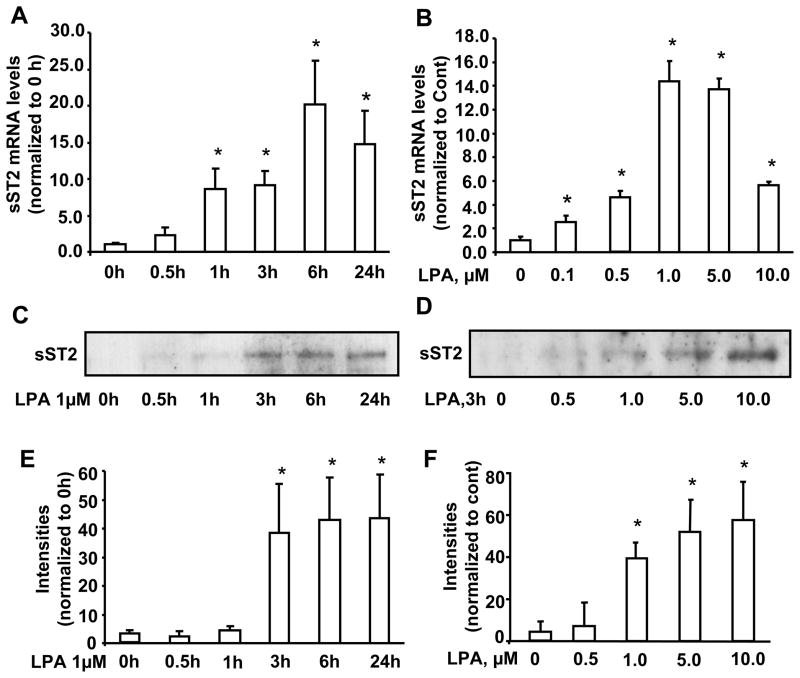
In order to determine the role of IL-1R related protein sST2 in human lungs, we first investigated sST2 gene expression and protein release in response to LPA challenge in HBEpCs. The basal sST2 mRNA levels were relatively low in HBEpCs, however LPA significantly induced sST2 mRNA levels in a dose and time dependent manner (Fig. 1A and B). The peak of sST2 mRNA expression was at 6 h and the maximum response was by 1 μM of LPA. A similar increase in sST2 protein release in cell culture media was also observed, however the peak levels were observed at 24 h and the maximum response was by 10 μM of LPA (Fig. 1C–F).
Figure 1. LPA increases sST2 gene expression and protein release in HBEpCs.
A. HBEpCs grown to ~70–80 % confluence were challenged with LPA (1 μM) and the kinetic response was followed. Total RNA was extracted and mRNA levels were determined by Real-time RT-PCR with primers for human sST2. Data represent mean ± SD generated from three different experiments. *p<0.01 versus 0 h cells. B. HBEpCs grown to ~70–80 % confluence were challenged with LPA at different concentrations for 3 h. Total RNA was extracted and mRNA levels were determined by Real-time RT-PCR with primers for human sST2. Data represent mean ± SD of three values. *p<0.01 versus 0 μM. C. HBEpCs were treated as described in A, culture supernatants were collected, and then were subjected to 10 % SDS-PAGE and analyzed with specific antibody to ST2. E. Quantitative analysis of blots from three independent experiments are shown (mean ± SD). *p<0.01 versus 0 h cells D. HBEpCs were treated as described in B, and the media were collected, centrifuged and concentrated. They were then subjected to 10 % SDS-PAGE and immunoblotted with specific ant-ST2 antibody. F. Quantitative analysis from three independent experiments are shown (mean ± SD). *p<0.01 versus 0 μM
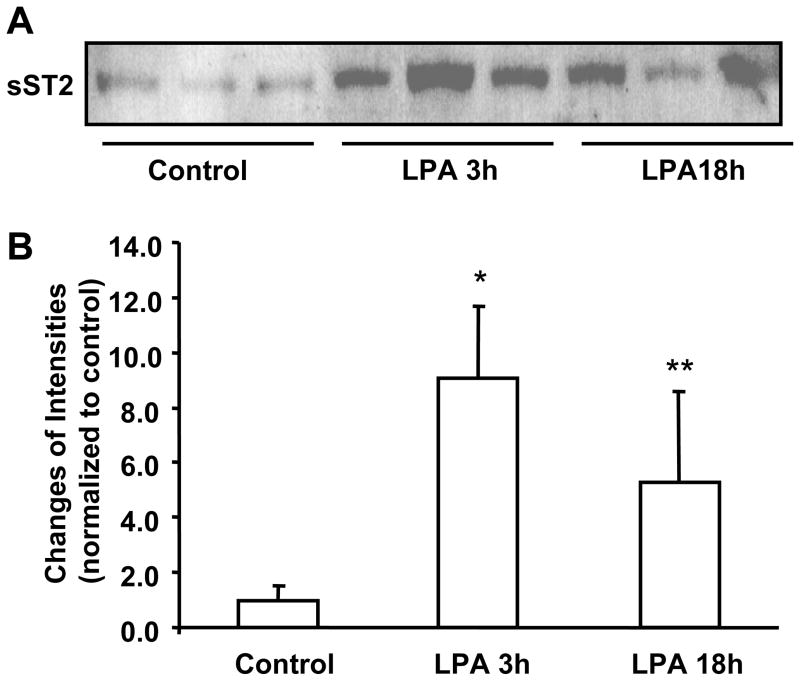
Further, we investigated the effect of LPA on sST2 release in vivo. C57BL/6 mice (8–10 weeks) were challenged with LPA intratracheally and BAL fluids were collected. As shown in Figure 2A and 2B, LPA challenge increased sST2 levels in BAL fluids after 3 h (~ 9.1 fold) and 18 h (~ 5.5 fold). These data indicated that LPA induces sST2 gene expression in pulmonary epithelial cells and that it is also secreted into the extracellular pulmonary fluids.
Figure 2. Intratracheal administration of LPA increases sST2 release in BAL fluids.
A. C57BL/6 mice (3/group) were challenged with LPA (5 μM) BAL fluids (at 3 h and 18 h) from control and LPA-challenged mice were concentrated with MILLIOPORE column and 30 μl of concentrated media were subjected to 10% SDS-PAGE gel and sST2 expression were determined by Western blotting with an antibody to sST2. B. Quantitative analysis of Western blot is shown. *p<0.01 versus control, **p<0.05 versus control.
3.2. Role of LPA receptor-mediated NF-κB and JNK pathways in LPA-induced sST2 expression
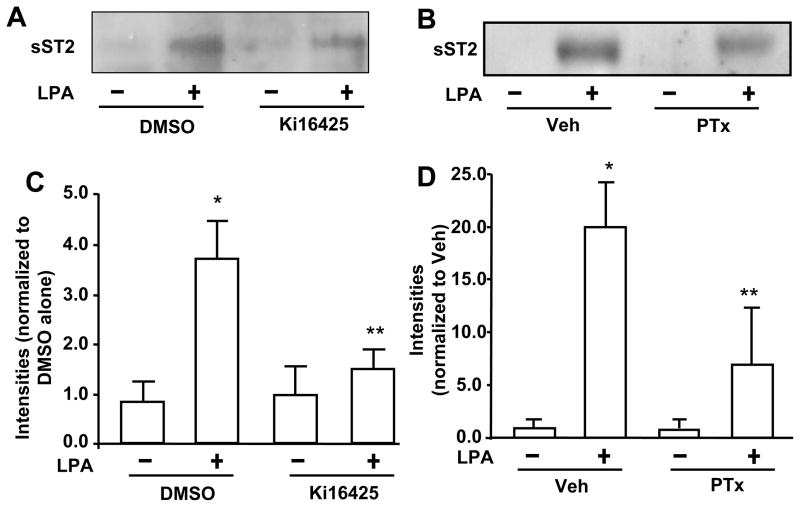
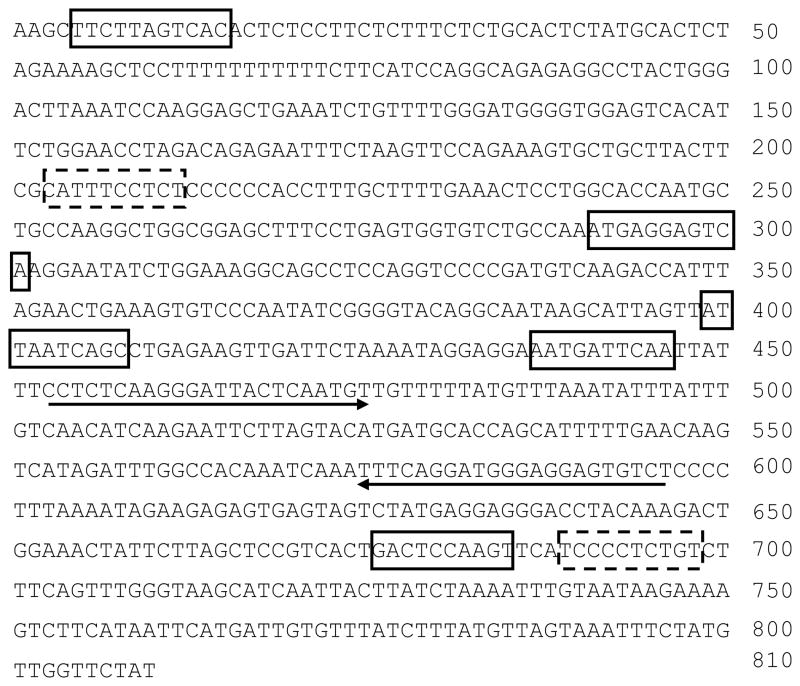
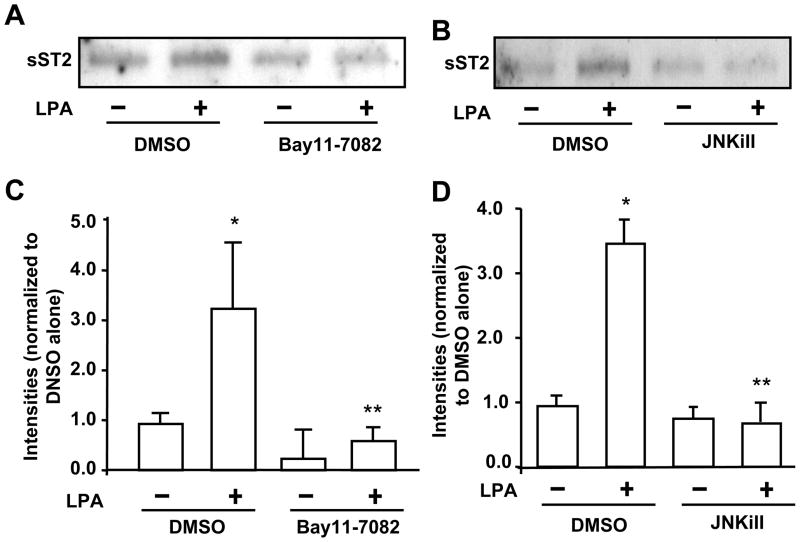
LPA receptors (LPA1–3) have been detected in HBEpCs [32]. In order to determine whether LPA-induced the increase in sST2 release is mediated through the canonical LPA1–3-mediated signaling, HBEpCs were treated with a LPA1 and LPA3 antagonist (Ki16425, 10 μM) or pertussis toxin (PTx) prior to LPA challenge. Ki16425 blocked LPA (1 μM, 3 h)-induced sST2 release (Fig. 3A and 3C), suggesting LPA induced sST2 release through cell surface LPA receptors, at least LPA1 and LPA3. Further, pretreatment with PTx (100 ng/ml, 4 h) attenuated LPA-induced sST2 secretion, indicating that LPA-induced sST2 release was mediated through Gαi-coupled LPA receptors. Ki16425 is solved in DMSO. DMSO itself affected LPA-induced sST2 release (Fig. 3A). Transcription factors NF-κB and JNK/AP-1 mediate LPA-induced gene expression of IL-8 [9–11], COX-2 [33], and IL-13Rα2 [12] in HBEpCs. In silico analysis of transcriptional factor binding sites identified at least two NF-κB and five AP-1 binding sites within human ST2 proximal promoter region in exon 1 (accession number: S74267, Figure 4). Inhibition of NF-κB by Bay11-7082 (Figure 5A and 5C) or inhibition of JNK by JNK inhibitor II (JNKiII) (Figure 5B and 5D) completely blocked LPA-induced sST2 expression, suggesting that activation of these two transcriptional factors by LPA treatment is essential for LPA-induced sST2 expression in HBEpCs.
Figure 3. LPA induces sST2 release through Gαi-coupled LPA receptor.
A. HBEpCs were pretreated with Ki16425 (10 μM) and challenged with LPA (1 μM) for 3 h. The clarified and concentrated culture supernatants were analyzed by 10% SDS-PAGE gel and immunoblotted with anti-sST2 antibody. B. HBEpCs were treated with PTx (100 ng/ml) for 16 h prior to LPA (1 μM, 3h) treatment. Clarified and concentrated culture supernatants were subjected to 10 % SDS-PAGE and analyzed with specific antibody to human ST2. C. Quantitative analysis from three independent experiments of A (mean ± SD) is shown. *p<0.01 versus veh; **p<0.01 versus LPA alone. D. Quantitative analysis from three independent experiments of B is shown (mean ± SD). *p<0.01 versus vehicle cells; **p<0.05 versus LPA alone.
Figure 4. In silico analysis of ST2 proximal promoter region.
DNA sequence of human ST2 proximal promoter region at exon 1 (810 bp, accession number: S74267) were analyzed by TRANSFAC 4.0 database. Two predicated NF-κB binding sites are shown in dashed boxes and five predicated AP-1 binding sites are shown in solid boxes. The sequences used for the design of Realtime PCR primers for Chip analysis are underlined.
Figure 5. LPA-induced the increase in release is through NF-κB and AP-1 pathways.
HBEpCs grown in 6-well plates were pretreated with the NF-κB inhibitor Bay11-7082 (5 μM) (A) or JNK inhibitor (JNKiII 10 μM) (B) for 1 h, and challenged with LPA (1 μM) for 3 h. Media were collected, and then were subjected to 10% SDS-PAGE gel and sST2 expression were determined by Western blotting with an antibody to human sST2. C & D. Quantitative analysis from three independent experiments are depited (mean ± SD). *p<0.01 versus vehicle cells; **p<0.01 versus LPA alone.
3.3. Role of histone acetylation in LPA-induced sST2 gene expression
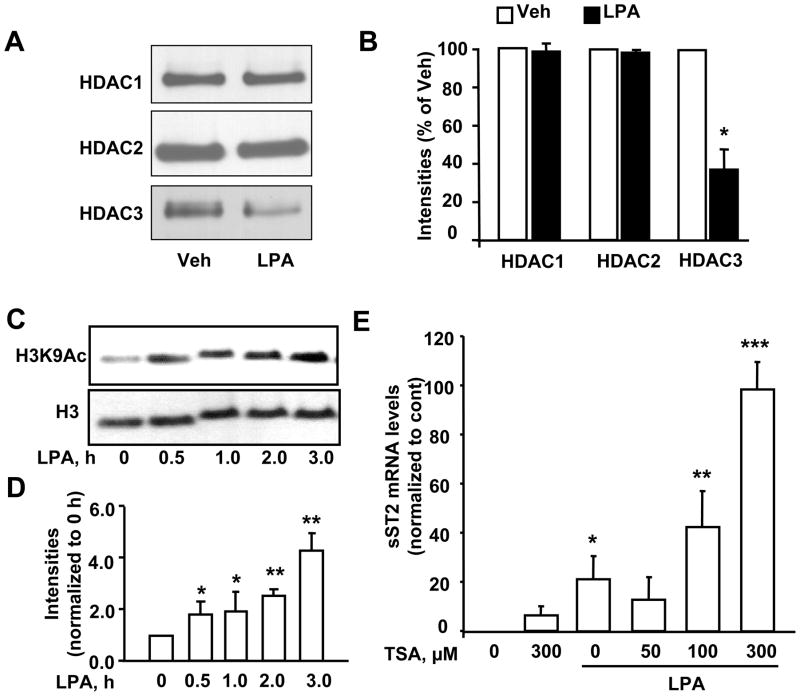
Histones are acetylated and deacetylated in lysine sites and the degree of histone acetylation is known to regulate transcriptional activity. Histone deacetylases (HDACs) catalyze the removal of acetyl groups on the lysine residues of core nucleosomal histones, and inhibition of HDACs increase histone acetylation and gene expressions [34]. LPA treatment of HBEpCs for 3 h had no effects on expression of HDAC1 and 2; however, there was a dramatic reduction in HDAC3 expression (Figure 6A and B). To investigate the effect of LPA on histone acetylation, we determined histone H3 acetylation by Western blotting after LPA treatment at different times. As shown in Figure 6C and D, LPA treatment significantly induced acetylation of histone H3 at lysine 9 at 0.5 h and thereafter increased through 3 h. To further investigate the effect of histone acetylation on LPA-induced sST2 gene expression, trichostatin A (TSA) was used to inhibit HDACs and enhance acetylation of histones. Pretreatment with TSA alone significantly increased sST2 gene expression, while TSA plus LPA further enhanced sST2 gene expression (Figure 6E). These data suggest that LPA increased the sST2 gene expression through the reduction of HDAC3 expression and the increase in histone H3 acetylation.
Figure 6. LPA induces sST2 expression through histone H3 acetylation.
A. HBEpCs were treated with LPA (1 μM) for 3 h. Cell lysates were analyzed by Western blotting with antibodies to HDAC1, HDAC2, and HDAC3. B. Quantitative analysis from three independent experiments is shown (mean ± SD). *p<0.01 versus veh. C. Cells were treated with LPA (1 μM) at different time points and cell lysates were analyzed by immunoblotting with antibodies to acetylated histone H3 at lysine 9 (H3K9Ac) and histone H3. D. Quantitative analysis from three independent experiments is shown (mean ± SD). *p<0.05 versus 0 h; **p<0.01 versus 0 h. E. Cells were pretreated with TSA (50, 100, and 300 μM) prior to LPA (1 μM, 3 h) treatment. Total RNA were extracted and sST2 mRNA levels were detected by Real-time RT-PCR with sST2 primers. Data points represent mean ± SD of three values. *p<0.01 versus veh; **p<0.05 versus LPA alone; ***p<0.01 versus LPA alone.
3.4. LPA induces histone H3 acetylation at sST2 promoter region
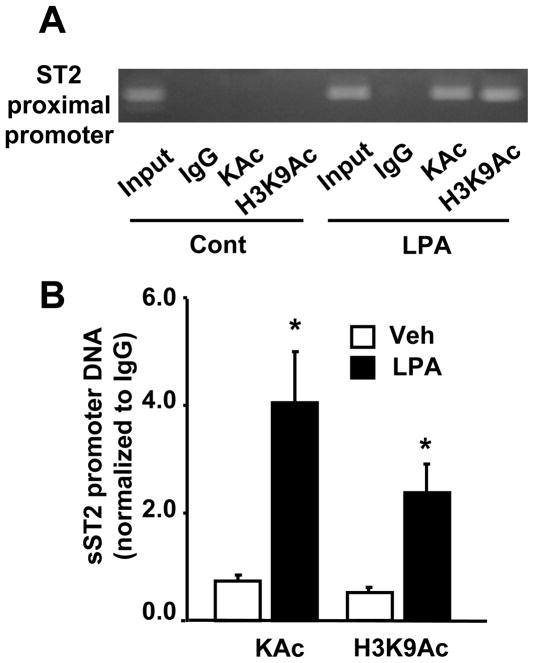
To further investigate the epigenetic regulation of sST2 gene expression, we performed Chip experiments to determine whether histone H3 is acetylated on sST2 promoter region in response to LPA treatment. Antibodies to acetylated lysine (KAc) and acetylated histone H3 at K9 (H3K9Ac) were used to immunoprecipitate activated transcriptional nucleosomal regions and sST2 promoter region was amplified by Realtime PCR. The primers for sST2 promoter were designed based on sST2 proximal promoter region. As shown in Figure 7A and 7B, LPA treatment induced histone acetylation in general and histone H3 at K9 in particular, on sST2 promoter region, suggesting that LPA increased sST2 gene expression through histone H3 acetylation on sST2 promoter region.
Figure 7. LPA induces histone H3 acetylation on the ST2 promoter region.
HBEpCs were treated with LPA (1 μM) for 3 h and then subjected to Chip assay. IgG antibody was used as negative control. ST2 proximal promoter was detected by regular PCR (32 cycles) with primers designed based on human ST2 proximal promoter sequence (accession number: S S74267). Amplified DNA was separated on 1.5 % agarose gel (A). B. After DNA was extracted from chromatin immunoprecipitated complex, levels of ST2 proximal promoter region were determined by Real-time PCR with same primers used in A. Data was normalized to IgG control. Data are the mean ± SD of three values is shown. *p<0.01 versus veh.
3.5. AGK regulates LPS-induced histone acetylation and sST2 gene expression
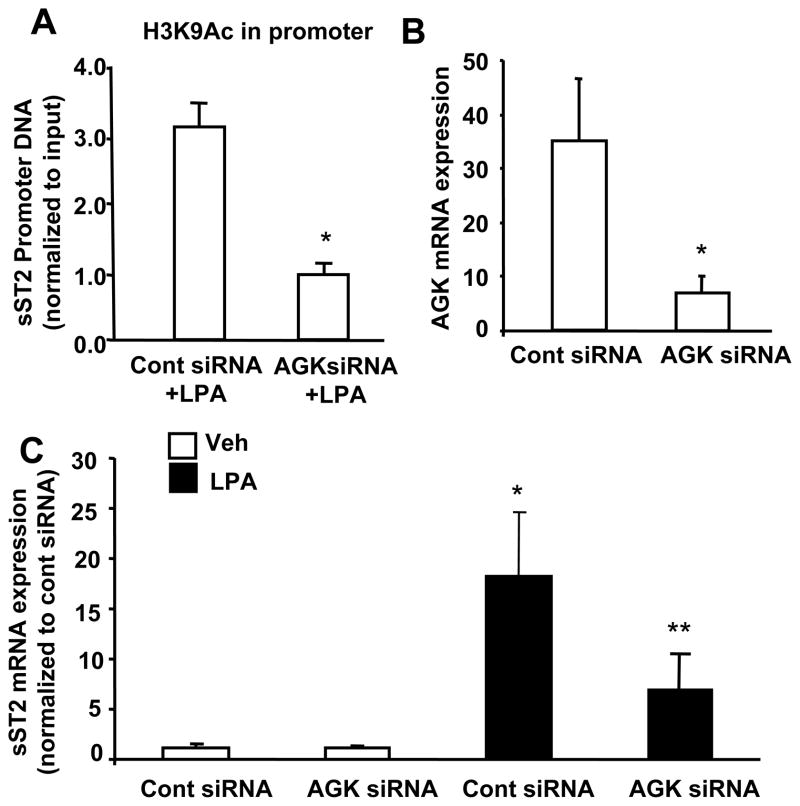
Our previous study had shown that reduction of intracellular LPA levels by down-regulation of acyl glycerol kinase (AGK) attenuated exogenous LPA-induced NF-κB activation and IL-8 expression in HBEpCs [35]. Here, by using Chip experiments, we found that down-regulation of AGK by AGK siRNA transfection (50 nM, 72 h) attenuated LPA-induced histone H3 acetylation on sST2 promoter region (Figure 8A), suggesting a role of intracellular LPA in regulation of histone H3 acetylation and chromatin modification. The effect of AGK siRNA on abrogating AGK expression using real time RT-PCR with human AGK primers has been previously reported [35]. Further, the effect of AGK siRNA on LPA-induced sST2 gene expression was examined. AGK siRNA transfection attenuated LPA-induced sST2 gene expression (Figure 8C). This result is consistent with our previous finding that intracellular LPA regulates exogenous LPA-induced gene expression through activation of NF-κB and AP-1 pathways [35].
Figure 8. Down-regulation of AGK attenuates LPA-induced acetylation of histone H3 and sST2 gene expression.
A. HBEpCs (~40 % confluence) were transfected with AGK siRNA (50 nM) for 72 h, and then treated with LPA (1 μM) for 3 h. Cell lysates were then subjected to Chip assay with an antibody to H3K9Ac. Levels of ST2 proximal promoter region in acetylated H3K9Ac complexes were determined by Real-time PCR. Data was normalized to IgG control. Data are the mean ± SD of three values. *p<0.01 versus control siRNA + LPA. B. After 72 h of AGK siRNA (50 nM) transfection, total RNA were extracted and AGK mRNA levels were examined by Realtime RT-PCR with human AGK primers. Data was normalized to 18S. Data are the mean ± SD of three values. *p<0.01 versus control siRNA. C. HBEpCs (~40 % confluence) were transfected with AGK siRNA (50 nM) for 72 h, and then treated with LPA (1 μM) for 3 h. Total RNA were extracted and sST2 mRNA levels were examined by Realtime RT-PCR with human sST2 primers. Data was normalized to 18S. Data are the mean ± SD of three values. *p<0.01 versus control siRNA; **p<0.05 versus cont siRNA + LPA.
3.6. sST2 protects HBEpCs from LPS-induced airway epithelial barrier disruption
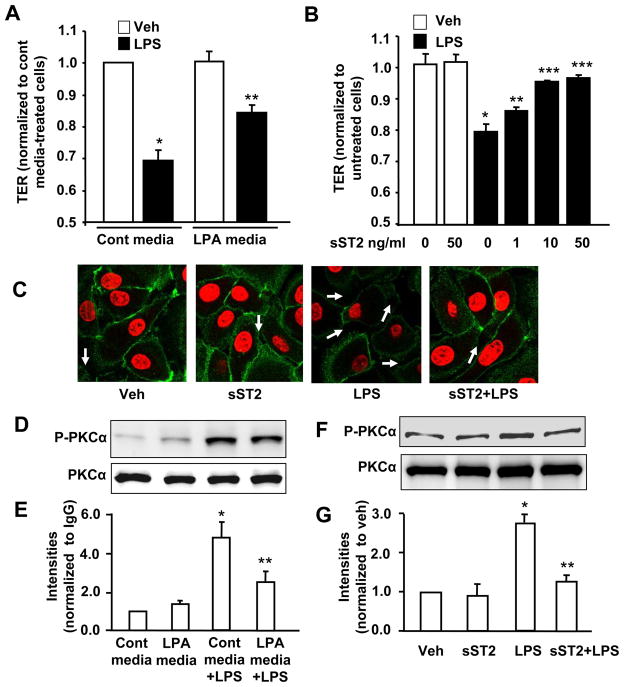
In order to ascertain the physiological role of sST2 in regulation of lung epithelial integrity, we determined the effect of LPA-released sST2 on barrier integrity. HBEpC monolayers were challenged with conditional supernatants from control cell culture or LPA (1 μM, 24 h)-treated cell culture and the transepithelial resistance (TER) was measured [13]. Control cell culture supernatant alone had no effect on basal TER (Fig. 9A). LPS (10 μg/ml) reduced TER in presence of control conditional supernatant, but not in presence of LPA-treated conditional supernatant (Figure 9A). Our previous study has shown that LPA treatment rapidly increased TER [13], however, the data here shows LPA (1 μM, 24 h)-treated conditional supernatant had no effect on changes of TER, suggesting that exogenous LPA has been degraded after 24 h in LPA (1 μM, 24 h)-treated conditional supernatant. LPA half-life in HBEpCs cell culture supernatant is around ~ 20 min [36]. In order to demonstrate the direct protective effect of sST2 on airway epithelial barrier dysfunction, the cells were exposed to increasing concentrations of recombinant human sST2-fc fusion protein following LPS (10 μg/ml) challenge. Recombinant sST2-fc fusion protein alone had no discernable effect on TER, however, it attenuated LPS-induced decreases in TER in a dose-dependent manner (Figure 9B). Immunofluorescence staining showed that LPS (10 μg/ml, 18 h) reduced E-cadherin expression on HBEpC cell surface and increased cell-cell gaps, while pretreatment with sST2-fc fusion protein (10 ng/ml) attenuated these effects of LPS (Figure 9C). We have shown that PKCα was downstream of LPS and inhibition of PKCα attenuated LPS-induced E-cadherin relocalization from cell surface to cytoplasm [13]. Here we found that pretreatment with LPA (1 μM, 24 h) or sST2-fc fusion protein (10 ng/ml, 1 h) attenuated LPS (10 μg/ml, 1 h)-induced phosphorylation of PKCα (Figure 9D-G). These results suggest that sST2 protects against LPS-induced airway epithelial barrier dysfunction.
Figure 9. sST2 offers protection to LPS-induced airway epithelial barrier disruption.
A. HBEpCs grown on ECIS gold electrodes were incubated with conditional media (from control or LPA (1 μM, 24 h)-treated cells) for 1 h, and then challenged with LPS (10 μg/ml) for 6 h. TER measurements were carried out with the ECIS system. Data were normalized to 0 h. *p < 0.01, versus veh; **p < 0.01, versus control media + LPS treatment. B. HBEpCs grown on ECIS gold electrodes were treated with recombinant sST2-fc fusion protein (1, 10, and 50 ng/ml) for 1 h, then challenged with LPS (10 μg/ml) for 6 h. TER values were measured with ECIS system. Data were normalized to 0 h. *p < 0.01, compared to veh; **p < 0.05, versus LPS alone; ***p < 0.01, versus LPS alone. C. HBEpCs grown on glass chamber to ~90–100% confluence were pretreated with sST2-fc fusion protein (10 ng/ml, 1 h) prior to LPS treatment (10 μg/ml, 18 h). Localization of E-cadherin was examined by immunofluorescence staining. Cell-cell gaps were shown by arrows. Shown are represent images. D. HBEpCS were incubated in control conditional media or LPA (1 μM, 24 h)-treated conditional media for 1 h prior to LPS treatment (10 μg/ml, 1 h). Cell lysates were analyzed by Western blotting with antibodies to p-PKCα and PKCα. E. Quantitative analysis from three independent experiments are depited (mean ± SD). *p<0.01 versus control media-incubated cells; **p<0.01 versus control media + LPS. F. HBEpCs were treated with sST2-fc fusion protein (10 ng/ml, 1 h) prior to LPS treatment (10 μg/ml, 1 h). Cell lysates were analyzed by Western blotting with antibodies to p-PKCα and PKCα. G. Quantitative analysis from three independent experiments are depited (mean ± SD). *p<0.01 versus vehicle cells; **p<0.01 versus LPS alone.
4. Discussion
sST2 is a soluble form of IL-1R related protein [15, 21]. Elevated plasma levels of sST2 have been detected in various diseases, including cardiovascular [27–29], asthma [37], and autoimmune diseases [38]. sST2 functions as a decoy receptor for IL-33 and blocks IL-33-induced signals and cellular responses [17]. Recent studies suggest that sST2 attenuates LPS-induced production of cytokines in macrophages [20]. However, the regulation of sST2 expression and its function in airway epithelial cells are still unknown. Here, we report that a bioactive lysophospholipid mediator, LPA increases sST2 gene expression and protein release into extracellular fluid in HBEpCs. LPA-induced sST2 gene expression is principally mediated by activation of transcription factors (NF-κB and AP-1) and acetylation of histone H3 on sST2 promoter region. Further, our studies revealed that intracellular LPA contributes to LPA-induced modification of histone and sST2 gene expression. The data demonstrating the ability of sST2 fusion protein to suppress LPS-induced airway epithelial barrier dysfunction reveal a potential ameliorating role for sST2 in lung injury.
LPA is a bioactive lysophospholipid that induces a wide range of cellular responses through its G-protein-coupled receptors [6, 7, 39]. Our previous studies have shown that LPA is an agonist of human bronchial epithelial cells and induced gene expression of several inflammatory mediators, including IL-8 [9–11], COX-2 [33]. The current study, on the contrary reveals a potential anti-inflammatory role of LPA by its ability to induce sST2 gene expression and release. The underlying mechanisms involved previously shown mediators of LPA activity such as the Gαi-coupled receptor and its downstream transcription factors such as NF-κB and AP-1 [9, 10, 12, 33, 35].
Gene expression is regulated by nuclear histone acetylation. For instance, histone acetylation weakens histone-DNA interaction and thus plays a critical role in transcriptional activation [40]. Two enzyme systems regulate histone acetylation: histone acetyl transferases (HATs) and HDACs [34]. LPA-induced sST2 gene expression is dependent on chromatin modification, especially, acetylation of histone H3 in HBEpCs (Fig. 6). Since HDACs can negatively regulate histone acetylation, we determined the levels of HDAC1, HDAC2 and HDAC3 that are abundant HBEpCs. Our data clearly supports a role for HDAC3 in histone acetylation as its level significantly reduced in LPA treated HBEpCs (Fig. 6A). Further support is gained from the observation that in HBEpCs, LPA challenge induces histone 3 acetylation at Lysine 9 (Fig. 6C). Also, we verified the above by demonstrating that pretreatment of HBEpCs with TSA, an inhibitor of class I and II HDACs also resulted in significant dose dependent increase in LPA induced sST2 transcripts (Fig. 6D). However, Ishdorj et al. showed that LPA reduced histone acetylation through inhibition of HDAC1 activity with a concomitant increase in HAT activity in transformed cell lines (CaOv-3 and I-83) [41]. These opposite effects of LPA on histone acetylation suggest that LPA elicits cell type-specific responses. For instance, LPA had limited effect on phosphorylation of AKT in HBEpCs (data not shown), while LPA induced activation of AKT in I-83 and CaVO-3 cells [42].
Recent studies suggest that in addition to the effects mediated by their cell surface receptors, intracellular lysophospholipids also induce signals and cellular responses [35, 43, 44]. Intracellular sphingosine-1-phosphate (S1P) regulates intracellular calcium concentration [45], phosphorylation of I-κB, p38MAPK, and activation of Rac1 [43]. Hait et al. reported that intracellular S1P interacted with HDAC1 and 2 and associated with acetylation of histone [46]. Here, we demonstrated that intracellular LPA regulates gene expression through histone acetylation (Fig. 6). However, the mechanisms by which intracellular LPA-mediated histone acetylation are not well understood. Hait et al. reported that intracellular LPA had no ability to interact with HDAC1 and 2, while our previous study showed that intracellular LPA, regulated by AGK, mediated phosphorylation of I-κB and p38MAPK in HBEpCs [35]. PPARγ is known as an intracellular receptor for LPA [47]. The effect of LPA on histone acetylation may be through its binding to the nuclear factor, PPARγ, a possibility we are currently investigating. Recent study from Zou et al. shows a role of lipid modification of histone in regulating cellular mRNA expression in lung epithelial cells [48]. The effect of intracellular LPA on histone lipid modification will be investigated in the future.
sST2 gene expression is known to be dependent on GATA-3 binding on ST2 proximal promoter region [49]. We provided here evidence that the transcription factors NF-κB and AP-1 and histone acetylation on ST2 proximal promoter region regulate sST2 gene expression in airway epithelial cells. sST2 is known to reduce IL-33- and LPS-mediated inflammatory responses [17–22]; however, the effect of sST2 on airway epithelial barrier function has not been studied. Our present study is the first report to demonstrate that sST2 has a protective effect against LPS-induced airway epithelial barrier dysfunction.
Our study revealed a novel molecular mechanism underlying LPA induced sST2 expression and release through activation of transcriptional factors and acetylation of histone on sST2 promoter region, This study identified potential molecular targets for developing future therapeutic approaches to combat lung inflammatory diseases.
Highlights.
Our study revealed a novel molecular mechanism underlying LPA induced sST2 expression and release through activation of transcriptional factors and acetylation of histone on sST2 promoter region, This study identified potential molecular targets for developing future therapeutic approaches to combat lung inflammatory diseases.
Acknowledgments
This work was supported by National Institutes of Health R01 grant HL091916 (to YZ), R37 079396 (to VN), P30 DK072506 (to M.M.), and by Cystic Fibrosis Foundation RDP (to M.M.).
Abbreviations
- LPA
lysophosphatidic acid
- sST2
soluble ST2
- HBEpCs
primary human bronchial epithelial cells
- BAL
bronchoalveolar lavage
- siRNA
small interference RNA
- S1P
sphingosine-1-phosphate
- HDAC
histone deacetylase
- TSA
trichostatin A
- TER
transepithelial resistance
- Chip
chromatin immunoprecipitation
Footnotes
The authors declare no conflict interest related to this work.
Publisher's Disclaimer: This is a PDF file of an unedited manuscript that has been accepted for publication. As a service to our customers we are providing this early version of the manuscript. The manuscript will undergo copyediting, typesetting, and review of the resulting proof before it is published in its final citable form. Please note that during the production process errors may be discovered which could affect the content, and all legal disclaimers that apply to the journal pertain.
References
- 1.Aoki J, Taira A, Takanezawa Y, Kishi Y, Hama K, Kishimoto T, Mizuno K, Saku K, Taguchi R, Arai H. J Biol Chem. 2002;277:48737–48744. doi: 10.1074/jbc.M206812200. [DOI] [PubMed] [Google Scholar]
- 2.Georas SN, Berdyshev E, Hubbard W, Gorshkova IA, Usatyuk PV, Saatian B, Myers AC, Williams MA, Xiao HQ, Liu M, Natarajan V. Clin Exp Allergy. 2007;37:311–322. doi: 10.1111/j.1365-2222.2006.02626.x. [DOI] [PubMed] [Google Scholar]
- 3.Tager AM, LaCamera P, Shea BS, Campanella GS, Selman M, Zhao Z, Polosukhin V, Wain J, Karimi-Shah BA, Kim ND, Hart WK, Pardo A, Blackwell TS, Xu Y, Chun J, Luster AD. Nat Med. 2008;14:45–54. doi: 10.1038/nm1685. [DOI] [PubMed] [Google Scholar]
- 4.Xu Y, Shen Z, Wiper DW, Wu M, Morton RE, Elson P, Kennedy AW, Belinson J, Markman M, Casey G. Jama. 1998;280:719–723. doi: 10.1001/jama.280.8.719. [DOI] [PubMed] [Google Scholar]
- 5.Fukushima N, Chun J. Prostaglandins. 2001;64:21–32. doi: 10.1016/s0090-6980(01)00105-8. [DOI] [PubMed] [Google Scholar]
- 6.Mutoh T, Chun J. Subcell Biochem. 2008;49:269–297. doi: 10.1007/978-1-4020-8831-5_10. [DOI] [PubMed] [Google Scholar]
- 7.Zhao Y, Natarajan V. Cell Signal. 2009;21:367–377. doi: 10.1016/j.cellsig.2008.10.010. [DOI] [PMC free article] [PubMed] [Google Scholar]
- 8.Zhao Y, Tong J, He D, Pendyala S, Evgeny B, Chun J, Sperling AI, Natarajan V. Respir Res. 2009;10:114. doi: 10.1186/1465-9921-10-114. [DOI] [PMC free article] [PubMed] [Google Scholar]
- 9.Cummings R, Zhao Y, Jacoby D, Spannhake EW, Ohba M, Garcia JG, Watkins T, He D, Saatian B, Natarajan V. J Biol Chem. 2004;279:41085–41094. doi: 10.1074/jbc.M404045200. [DOI] [PubMed] [Google Scholar]
- 10.Saatian B, Zhao Y, He D, Georas SN, Watkins T, Spannhake EW, Natarajan V. Biochem J. 2006;393:657–668. doi: 10.1042/BJ20050791. [DOI] [PMC free article] [PubMed] [Google Scholar]
- 11.Zhao Y, He D, Saatian B, Watkins T, Spannhake EW, Pyne NJ, Natarajan V. J Biol Chem. 2006;281:19501–19511. doi: 10.1074/jbc.M511224200. [DOI] [PMC free article] [PubMed] [Google Scholar]
- 12.Zhao Y, He D, Zhao J, Wang L, Leff AR, Spannhake EW, Georas S, Natarajan V. J Biol Chem. 2007;282:10172–10179. doi: 10.1074/jbc.M611210200. [DOI] [PMC free article] [PubMed] [Google Scholar]
- 13.He D, Su Y, Usatyuk PV, Spannhake EW, Kogut P, Solway J, Natarajan V, Zhao Y. J Biol Chem. 2009;284:24123–24132. doi: 10.1074/jbc.M109.007393. [DOI] [PMC free article] [PubMed] [Google Scholar]
- 14.Fan H, Zingarelli B, Harris V, Tempel GE, Halushka PV, Cook JA. Mol Med. 2008;14:422–428. doi: 10.2119/2007-00106.Fan. [DOI] [PMC free article] [PubMed] [Google Scholar]
- 15.Gayle MA, Slack JL, Bonnert TP, Renshaw BR, Sonoda G, Taguchi T, Testa JR, Dower SK, Sims JE. J Biol Chem. 1996;271:5784–5789. doi: 10.1074/jbc.271.10.5784. [DOI] [PubMed] [Google Scholar]
- 16.Kumar S, Minnich MD, Young PR. J Biol Chem. 1995;270:27905–27913. doi: 10.1074/jbc.270.46.27905. [DOI] [PubMed] [Google Scholar]
- 17.Hayakawa H, Hayakawa M, Kume A, Tominaga S. J Biol Chem. 2007;282:26369–26380. doi: 10.1074/jbc.M704916200. [DOI] [PubMed] [Google Scholar]
- 18.Oshikawa K, Yanagisawa K, Tominaga S, Sugiyama Y. Biochem Biophys Res Commun. 2002;299:18–24. doi: 10.1016/s0006-291x(02)02578-0. [DOI] [PubMed] [Google Scholar]
- 19.Fagundes CT, Amaral FA, Souza AL, Vieira AT, Xu D, Liew FY, Souza DG, Teixeira MM. J Leukoc Biol. 2007;81:492–499. doi: 10.1189/jlb.0606422. [DOI] [PubMed] [Google Scholar]
- 20.Takezako N, Hayakawa M, Hayakawa H, Aoki S, Yanagisawa K, Endo H, Tominaga S. Biochem Biophys Res Commun. 2006;341:425–432. doi: 10.1016/j.bbrc.2005.12.206. [DOI] [PubMed] [Google Scholar]
- 21.Trajkovic V, Sweet MJ, Xu D. Cytokine Growth Factor Rev. 2004;15:87–95. doi: 10.1016/j.cytogfr.2004.02.004. [DOI] [PubMed] [Google Scholar]
- 22.Yin H, Li XY, Yuan BH, Zhang BB, Hu SL, Gu HB, Jin XB, Zhu JY. Clin Exp Immunol. 2011 doi: 10.1111/j.1365-2249.2011.04326.x. in press. [DOI] [PMC free article] [PubMed] [Google Scholar]
- 23.Tominaga S. FEBS Lett. 1989;258:301–304. doi: 10.1016/0014-5793(89)81679-5. [DOI] [PubMed] [Google Scholar]
- 24.Werenskiold AK, Hoffmann S, Klemenz R. Mol Cell Biol. 1989;9:5207–5214. doi: 10.1128/mcb.9.11.5207. [DOI] [PMC free article] [PubMed] [Google Scholar]
- 25.Tajima S, Oshikawa K, Tominaga S, Sugiyama Y. Chest. 2003;124:1206–1214. doi: 10.1378/chest.124.4.1206. [DOI] [PubMed] [Google Scholar]
- 26.Bartunek J, Delrue L, Van Durme F, Muller O, Casselman F, De Wiest B, Croes R, Verstreken S, Goethals M, de Raedt H, Sarma J, Joseph L, Vanderheyden M, Weinberg EO. J Am Coll Cardiol. 2008;52:2166–2174. doi: 10.1016/j.jacc.2008.09.027. [DOI] [PMC free article] [PubMed] [Google Scholar]
- 27.Shimpo M, Morrow DA, Weinberg EO, Sabatine MS, Murphy SA, Antman EM, Lee RT. Circulation. 2004;109:2186–2190. doi: 10.1161/01.CIR.0000127958.21003.5A. [DOI] [PubMed] [Google Scholar]
- 28.Weinberg EO, Shimpo M, De Keulenaer GW, MacGillivray C, Tominaga S, Solomon SD, Rouleau JL, Lee RT. Circulation. 2002;106:2961–2966. doi: 10.1161/01.CIR.0000038705.69871.D9. [DOI] [PMC free article] [PubMed] [Google Scholar]
- 29.Weinberg EO, Shimpo M, Hurwitz S, Tominaga S, Rouleau JL, Lee RT. Circulation. 2003;107:721–726. doi: 10.1161/01.cir.0000047274.66749.fe. [DOI] [PubMed] [Google Scholar]
- 30.Brunner M, Krenn C, Roth G, Moser B, Dworschak M, Jensen-Jarolim E, Spittler A, Sautner T, Bonaros N, Wolner E, Boltz-Nitulescu G, Ankersmit HJ. Intensive Care Med. 2004;30:1468–1473. doi: 10.1007/s00134-004-2184-x. [DOI] [PubMed] [Google Scholar]
- 31.Shimizu M, Matsuda A, Yanagisawa K, Hirota T, Akahoshi M, Inomata N, Ebe K, Tanaka K, Sugiura H, Nakashima K, Tamari M, Takahashi N, Obara K, Enomoto T, Okayama Y, Gao PS, Huang SK, Tominaga S, Ikezawa Z, Shirakawa T. Hum Mol Genet. 2005;14:2919–2927. doi: 10.1093/hmg/ddi323. [DOI] [PubMed] [Google Scholar]
- 32.Wang L, Cummings R, Zhao Y, Kazlauskas A, Sham JK, Morris A, Georas S, Brindley DN, Natarajan V. J Biol Chem. 2003;278:39931–39940. doi: 10.1074/jbc.M302896200. [DOI] [PubMed] [Google Scholar]
- 33.He D, Natarajan V, Stern R, Gorshkova IA, Solway J, Spannhake EW, Zhao Y. Biochem J. 2008;412:153–162. doi: 10.1042/BJ20071649. [DOI] [PMC free article] [PubMed] [Google Scholar]
- 34.Kuo MH, Allis CD. Bioessays. 1998;20:615–626. doi: 10.1002/(SICI)1521-1878(199808)20:8<615::AID-BIES4>3.0.CO;2-H. [DOI] [PubMed] [Google Scholar]
- 35.Kalari S, Zhao Y, Spannhake EW, Berdyshev EV, Natarajan V. Am J Physiol Lung Cell Mol Physiol. 2009;296:L328–336. doi: 10.1152/ajplung.90431.2008. [DOI] [PMC free article] [PubMed] [Google Scholar]
- 36.Zhao Y, Usatyuk PV, Cummings R, Saatian B, He D, Watkins T, Morris A, Spannhake EW, Brindley DN, Natarajan V. Biochem J. 2005;385:493–502. doi: 10.1042/BJ20041160. [DOI] [PMC free article] [PubMed] [Google Scholar]
- 37.Oshikawa K, Kuroiwa K, Tago K, Iwahana H, Yanagisawa K, Ohno S, Tominaga SI, Sugiyama Y. Am J Respir Crit Care Med. 2001;164:277–281. doi: 10.1164/ajrccm.164.2.2008120. [DOI] [PubMed] [Google Scholar]
- 38.Kuroiwa K, Arai T, Okazaki H, Minota S, Tominaga S. Biochem Biophys Res Commun. 2001;284:1104–1108. doi: 10.1006/bbrc.2001.5090. [DOI] [PubMed] [Google Scholar]
- 39.Takuwa Y, Takuwa N, Sugimoto N. J Biochem. 2002;131:767–771. doi: 10.1093/oxfordjournals.jbchem.a003163. [DOI] [PubMed] [Google Scholar]
- 40.Izzo A, Schneider R. Brief Funct Genomics. 9:429–443. doi: 10.1093/bfgp/elq024. [DOI] [PMC free article] [PubMed] [Google Scholar]
- 41.Ishdorj G, Graham BA, Hu X, Chen J, Johnston JB, Fang X, Gibson SB. J Biol Chem. 2008;283:16818–16829. doi: 10.1074/jbc.M710177200. [DOI] [PMC free article] [PubMed] [Google Scholar]
- 42.Hu X, Haney N, Kropp D, Kabore AF, Johnston JB, Gibson SB. J Biol Chem. 2005;280:9498–9508. doi: 10.1074/jbc.M410455200. [DOI] [PubMed] [Google Scholar]
- 43.Zhao Y, Kalari SK, Usatyuk PV, Gorshkova I, He D, Watkins T, Brindley DN, Sun C, Bittman R, Garcia JG, Berdyshev EV, Natarajan V. J Biol Chem. 2007;282:14165–14177. doi: 10.1074/jbc.M701279200. [DOI] [PMC free article] [PubMed] [Google Scholar]
- 44.Berdyshev EV, Gorshkova IA, Usatyuk P, Zhao Y, Saatian B, Hubbard W, Natarajan V. Cell Signal. 2006;18:1779–1792. doi: 10.1016/j.cellsig.2006.01.018. [DOI] [PubMed] [Google Scholar]
- 45.Meyer zu Heringdorf D, Liliom K, Schaefer M, Danneberg K, Jaggar JH, Tigyi G, Jakobs KH. FEBS Lett. 2003;554:443–449. doi: 10.1016/s0014-5793(03)01219-5. [DOI] [PubMed] [Google Scholar]
- 46.Hait NC, Allegood J, Maceyka M, Strub GM, Harikumar KB, Singh SK, Luo C, Marmorstein R, Kordula T, Milstien S, Spiegel S. Science. 2009;325:1254–1257. doi: 10.1126/science.1176709. [DOI] [PMC free article] [PubMed] [Google Scholar]
- 47.McIntyre TM, Pontsler AV, Silva AR, St Hilaire A, Xu Y, Hinshaw JC, Zimmerman GA, Hama K, Aoki J, Arai H, Prestwich GD. Proc Natl Acad Sci U S A. 2003;100:131–136. doi: 10.1073/pnas.0135855100. [DOI] [PMC free article] [PubMed] [Google Scholar]
- 48.Zou C, Ellis BM, Smith RM, Chen BB, Zhao Y, Mallampalli RK. J Biol Chem. doi: 10.1074/jbc.M111.253385. [DOI] [PMC free article] [PubMed] [Google Scholar]
- 49.Hayakawa M, Yanagisawa K, Aoki S, Hayakawa H, Takezako N, Tominaga S. Biochim Biophys Acta. 2005;1728:53–64. doi: 10.1016/j.bbaexp.2005.01.012. [DOI] [PubMed] [Google Scholar]


