

Abstract
Alzheimer’s Disease (AD) is the most common age-related neurodegenerative disease, affecting an estimated 5.3 million people in the United States. While many factors likely contribute to AD progression, it is widely accepted that AD is driven by the accumulation of β-amyloid (Aβ), a small, fibrillogenic peptide generated by the sequential proteolysis of the amyloid precursor protein by the β- and γ-secretases. Though the underlying causes of Aβ accumulation in sporadic AD are myriad, it is clear that lifestyle and overall health play a significant role. The adipocyte-derived hormone leptin has varied systemic affects, including neuropeptide release and neuroprotection. A recent study by Lieb et al (2009) showed that individuals with low plasma leptin levels are at greater risk of developing AD, through unknown mechanisms. In this report, we show that plasma leptin is a strong negative predictor of Aβ levels in the mouse brain, supporting a protective role for the hormone in AD onset. We also show that the inhibition of Aβ accumulation is due to the downregulation of transcription of the γ-secretase components. On the other hand, β-secretase expression is either unchanged (BACE1) or increased (BACE2). Finally, we show that only presenilin 1 (PS1) is negatively correlated with plasma leptin at the protein level (p<0.0001). These data are intriguing and may highlight a role for leptin in regulating the onset of amyloid pathology and AD.
Keywords: leptin, presenilin, γ-secretase, β-amyloid, Alzheimer’s Disease
1. Introduction
Alzheimer’s Disease (AD), the most common age-related neurodegenerative disease, is a continually growing socio-economic burden in industrialized nations, such as the United States, where the median life expectancy now tops 78 years. While a small number of AD cases are familial, due to well-characterized mutations in the amyloid precursor protein (APP) and presenilin (PS1 and PS2) [1], the majority are sporadic, with no clear etiology.
It is now widely accepted that AD pathology is driven, at least initially, by the accumulation of β-amyloid (Aβ), a small fibrillogenic peptide cleaved from the larger, membrane-bound APP [2]. This peptide rapidly oligomerizes, stimulating many downstream events and ultimately leading to neurodegeneration [3]. The production of Aβ is achieved by the sequential proteolysis of APP by the β- and γ-secretases - both of which have been explored as targets for AD therapeutics. γ-Secretase is a multimeric enzyme complex that completes the conversion of APP C-terminal fragments to Aβ peptides through the actions of its catalytic subunit, presenilin. Transcriptional, translational, and post-translational control of β- and γ-secretase expression and assembly is tightly controlled [4–8]. Aβ accumulation in sporadic AD arises from an imbalance between its production and degradation, though the processes underlying this imbalance are unclear and likely intertwined. It is well-documented that lifestyle and overall health impact disease development and progression, however [9–15].
Leptin is a hormone released from adipose tissue that regulates satiety and energy balance via hypothalamic signaling in the brain and subsequent neuropeptide release [16]. Though the effects on other areas of the brain are less clear, leptin has been reported to improve long-term potentiation in neurons and to be neuroprotective [8, 17, 18], likely via the potentiation of pro-growth and anti-apoptotic signals [19–22]. In addition, leptin has been shown to negatively regulate Aβ production and tau phosphorylation in neuronal cell lines and primary neurons [23, 24]. Intriguingly, a recent paper reported that low plasma leptin is associated with increased AD risk in elderly humans [25], through unknown mechanisms.
In this report, we show that plasma leptin is strongly and negatively correlated with brain Aβ levels and presenilin 1 (PS1) expression in mice. In addition, leptin increases APP C-terminal fragment (CTF) and Aβ accumulation and reduces mRNA expression of γ-secretase components in human neuroglioma cells.
2. Materials and Methods
2.1. Animals
For leptin measurements, 1–2 month old APPΔNLh x PS1P264L knock-in mice (wild-type, n = 37; heterozygous, n = 49; homozygous, n = 21; total, N=107) [26] were fed a control (20% fat, n = 46), western (40% fat, n = 14) or ketogenic (80% fat, n = 47) diet (Research Diets) ad libitum for 1 month. Mice were split approximately equally by gender (M: n = 52; F: n = 55). Animals were euthanized by CO2 asphyxiation followed by decapitation, and the tissues and blood collected. In an independent set of experiments, 6 (n = 19) and 18 (n = 18) month old male APPΔNLh x PS1P264L knock-in mice (homozygous, n = 18; wild-type, n = 19; total, N = 37) were used for body composition analyses, as well as serum analyses. Mice were euthanized by isofluorane anesthesia, followed by cardiac puncture and decapitation.
2.2. Plasma and Serum Measurements
Plasma was obtained from whole blood by low speed centrifugation (1500 × g, 10 minutes). Leptin was measured in plasma using a commercially-available ELISA (Millipore, Billerica; MA), according to manufacturer’s instructions. Serum was obtained from whole blood by allowing it to clot at 4°C overnight followed by centrifugation (3000 × g, 30 minutes). Serum was collected and either analyzed immediately or aliquoted and stored at −80°C. Levels of total cholesterol, HDL cholesterol, LDL cholesterol, triglycerides, and non-esterified fatty acids (NEFA) in sera were measured colorimetrically using commercially available kits (Wako Chemicals; Richmond, VA). Serum adiponectin, leptin, and insulin levels were all evaluated by ELISA in accordance with the manufacturer’s assay protocol (R&D Systems; Minneapolis, MN for adiponectin; R&D Systems for leptin; and Crystal Chem Inc.; Downers Grove IL for insulin). To measure total pools of adiponectin, serum samples were first denatured (boiled in SDS buffer for 5 minutes) to break down large complexes.
2.3. Cell Culture
H4 neuroglioma cells stably overexpressing APPΔNLh were grown in Opti-MEM (Invitrogen; Carlsbad, CA) with 10% fetal bovine serum (HyClone; Logan, UT) and 1% penicillin-streptomycin, supplemented with hygromycin (200 μg/mL) as described [27, 28]. H4 wild-type cells were grown in the absence of hygromycin. SH-SY5Y neuroblastoma cells were grown in Dulbecco’s Modified Eagle’s Medium (DMEM) supplemented with 10% fetal bovine serum and 1% penicillin-streptomycin. Upon reaching confluence, serum was removed and the cells were treated with recombinant human leptin (Sigma-Aldrich; St. Louis, MO) for 24 hours. H4-conditioned media, containing Aβ, were collected, and the cells were lysed in RIPA buffer (1% Triton X-100/0.5% sodium deoxycholate/0.1% SDS/50 mM Tris/150 mM NaCl + Protease Inhibitor Cocktail (Amresco; Solon, OH), pH = 8.0). Two independent experiments were performed.
2.4. Aβ ELISA
Frozen brain tissue was homogenized in 2% SDS with Complete Protease Inhibitor Cocktail using an AHS200 PowerMax homogenizer. Insoluble material was removed by centrifugation (20,800 × g, 30 min., 14°C) and the supernatants frozen until use. Total Aβ was measured by sandwich ELISA as previously described [27]. Briefly, SDS extracts were diluted in AC buffer (0.2M sodium phosphate (pH7), 0.4M NaCl, 2 mM EDTA, 0.4% Block Ace (Serotec; Raleigh, NC), 0.4% BSA, 0.05% CHAPS, 0.05% NaN3) for analysis. A standard curve was prepared from recombinant human Aβ1-42 diluted in AC buffer. Standards and samples were measured at least in duplicate. 384-well plates (Immulon 4HBX; Thermo Scientific; Waltham, MA) were coated with 0.5 μg Ab9/well (against human Aβ1-16) and blocked with Synblock (Serotec) according to the manufacturer’s instructions. After incubation with the samples and standards, Aβ was detected with biotinylated-4G8 (against Aβ17-24; Covance; Princeton, NJ), followed by incubation with 0.1 μg/mL NeutrAvidin-HRP (Pierce Technologies; Rockford, IL). The plate was developed with 3′,3′,5′,5′-tetramethylbenzidine (TMB; Kirkeguard and Perry Laboratories; Gaithersburg, MD) and the reaction stopped with 6% o-phosphoric acid. The absorbance at 450 nm was measured with a BioTek multiwell plate reader. H4 cell culture media was assayed for Aβ40 using a commercially-available ELISA kit (BioSource; Carlsbad, CA). The Aβ42 levels in the media were below detection limits. Data were averaged over 4–5 replicates.
2.5. qRT-PCR
RNA was extracted from leptin-treated wild-type H4 or SH-SY5Y cells using TRIzol® (Invitrogen). RNA from the SH-SY5Y cells was subsequently purified by RNeasy columns (Qiagen; Valencia, CA). Expression of the γ-secretase components was determined by two-step qRT-PCR, using iScript (BioRad; Hercules, CA) reverse transcription, followed by qPCR with PerfeCTa FastMix™ (Quanta; Gaithersburg, MD). The geometric mean of the CT values for 18S rRNA, β-actin, and GAPDH was used as an internal control to calculate and compare relative expression (2−ΔΔCT). Gene specific primer sets were obtained from IDT (Coralville, IA; Table 1). All measurements were performed in triplicate. Data was averaged from 2–3 independent experiments.
Table 1.
qPCR Gene-Specific Primers
| Target Gene | Direction | Sequence |
|---|---|---|
| PS1 | forward | 5′-AAATGGGTGCTTTGTGGTCTCTGC-3′ |
| reverse | 5′-CAGGCTGATGGCTGTTTGTGTGTT-3′ | |
| PS2 | forward | 5′-ATGGACAGCTCATCTACACGCCAT-3′ |
| reverse | 5′-AGAGCACCACCAAGAAGATGGTCA-3′ | |
| PEN2 | forward | 5′-TCTCGCGCAAACGTCCATAACTGA-3′ |
| reverse | 5′-AATGGACACTCGCTCCAGGTTCAT-3′ | |
| Nicastrin | forward | 5′-AGTGCCCAAATGATGGGTTTGGTG-3′ |
| reverse | 5′-TCATAAGCCAAACCATTGCCCAGC-3′ | |
| APH1A | forward | 5′-ATCCGCCAGATGGCCTATGTTTCT-3′ |
| reverse | 5′-AGCAGGATAATGGCTGCTGTCAGA-3′ | |
| APH1B | forward | 5′-TTATGTCTTCACCATCGCCACCGA-3′ |
| reverser | 5′-TTGCCATGAACCAAACAAGGGACG-3′ | |
| BACE1 | forward | 5′-ATGTTGCCACTCTGCCTCATGGTA-3′ |
| reverse | 5′-TGAGCAGGGAGATGTCATCAGCAA-3′ | |
| BACE2 | forward | 5′-TGAGGACCTTGTCACCATCCCAAA-3′ |
| reverse | 5′-TGGCCAAAGCAGCATAAGCAAGTC-3′ | |
| 18S rRNA | forward | 5′-TTAGAGTGTTCAAAGCAGGCCCGA-3′ |
| reverse | 5′-TTGGCAAATGCTTTCGCTCTGGTC-3′ | |
| β-Actin | forward | 5′-ACCAACTGGGACGACATGGAGAAA-3′ |
| reverse | 5′-TAGCACAGCCTGGATAGCAACGTA-3′ | |
| GAPDH | forward | 5′-TCGACAGTCAGCCGCATCTTCTTT-3′ |
| reverse | 5′-ACCAAATCCGTTGACTCCGACCTT-3′ |
2.6. Immunoblots
Protein levels of APP and the γ-secretase components were determined by Western or spot blot, using antibodies directed against APP (CT20) [27], PS1 (Calbiochem; Gibbstown, NJ), PEN2 (Abcam; Cambridge, MA), or APH1A (Pierce; Rockford, IL). The antibody directed at the C-terminus of nicastrin was a kind gift from Dr. Paul Fraser [29]. Immunoreactive bands were visualized with Super Signal West Dura chemiluminescence HRP substrate (Pierce) and exposed to film. Densitometric analyses were performed using Scion Image or Image J. Expression of the γ-secretase components was standardized to β-actin (Sigma-Aldrich) expression in the same lane or spot, respectively. Spot blot measurements were performed in triplicate. PS1, PEN2, nicastrin and APH1 protein levels were analyzed in a subset of mice (N=65 for PS1, PEN2, and APH1; N=16 for nicastrin).
2.7. Body Composition Analysis
Body composition was measured using a Bruker minispec LF90 time domain NMR analyzer (Bruker Optics; Billerica, MA) as described previously [30].
2.8. Statistics
Data were analyzed by linear regression using SPSS® for Windows (Hewlett Packard; Houston, TX). Correlations were analyzed as Pearson product moment for parametric (plasma leptin, brain Aβ) or Spearman rank order for nonparametric (immunoblot) variables. RT-PCR data were analyzed using a Mann-Whitney U nonparametric ANOVA. Aβ secretion values were analyzed by parametric ANOVA followed by Dunnett’s test for multiple comparisons to a control group. The effect of body weight, fat, and muscle on Aβ was analyzed by parametric ANOVA. The effect of leptin administration on plasma leptin was analyzed by a one-tailed, nonparametric, Mann-Whitney test. When necessary, manual adjustment for multiple comparisons was performed using the Holm-Bonferroni procedure. All mice were analyzed together as a single population to maximize power.
3. Results
3.1. Plasma Leptin and Aβ
We made a striking observation during a study examining the effect of high fat diets on Aβ generation in the APPΔNLh x PS1P264L knock-in mouse model of AD: plasma leptin was strongly and negatively correlated with total brain Aβ (Figure 1; R2 = 0.26, p<0.0001, N = 105). This data includes young (2–3 months old) mice of different genotypes, with one or two copies of mutant APP and/or PS1, as well as wild-type controls. In an effort to remove the contribution of endogenous rodent Aβ, we also performed the correlation with the exclusion of animals containing only wild-type rodent APP. This change modestly improved the strength of the observed correlation (R2 = 0.35, p<0.0001, N = 69). These data indicate that leptin has a protective effect on some aspect of Aβ metabolism. While the diets used in this study significantly increased plasma leptin levels (p=0.02), there was no effect on brain Aβ (p=0.66), supporting the conclusion that the correlation observed is driven by plasma leptin and not the variation in diet.
Figure 1. Plasma Leptin Negatively Correlates with Brain Aβ.
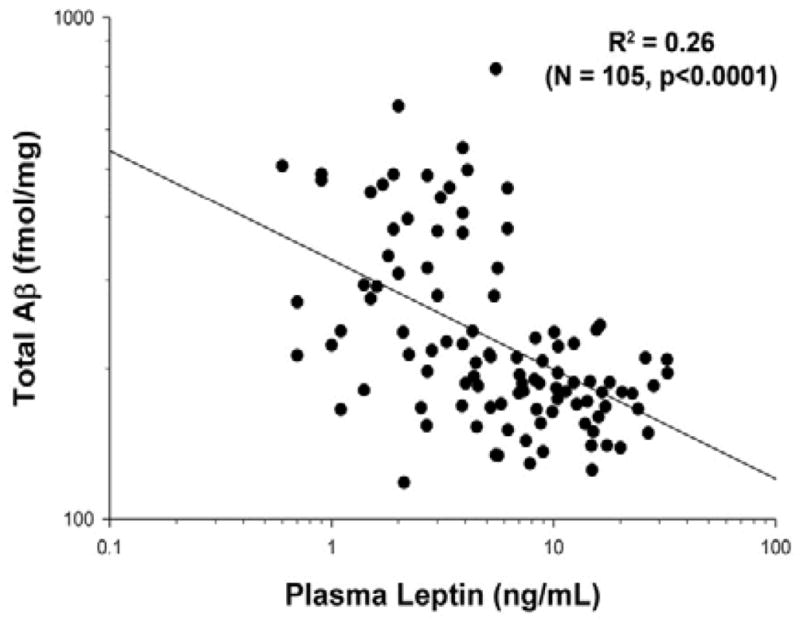
There was a strong negative correlation between plasma leptin and brain Aβ in young (2–3 month-old) APPΔNLh x PS1P264L knock-in mice (N=105; p<0.0001).
Leptin is an adipose-derived hormone that is important for satiety and energy balance and expenditure, including insulin sensitivity and fatty acid uptake into muscle and liver [31, 32]. In addition, circulating levels of leptin are directly influenced by weight and fat mass, which also determine the levels of other adipokines, such as adiponectin. In order to determine whether the observed correlation between plasma leptin and brain Aβ was driven by leptin itself, or by other factors either affecting or affected by leptin, we looked at a separate, small (N=37) cohort of middle aged (6 months) and older (18 months) APP x PS1 knock-in and wild-type mice that were maintained on a control diet (Table 2). The APP x PS1 knock-in mice have significantly elevated Aβ (p<0.0005; consistent with previous reports [26]), triglycerides (p<0.03), non-esterified fatty acids (NEFA; p=0.002), total cholesterol (p<0.0005), high-density lipoprotein (HDL; p=0.025), and low-density lipoprotein (LDL; p<0.0005). Conversely, APP x PS1 mice have significantly reduced serum leptin (p=0.04) and adiponectin (p=0.01), compared with wild-type controls. There was an age-dependent increase in weight (p=0.001), muscle mass (p<0.0005), free fluids (p<0.0005), cholesterol (p=0.003), serum insulin (p=0.004), and Aβ (p<0.0005). There was an age-dependent decrease in triglycerides (p=0.009), NEFA (p<0.0005), and serum adiponectin (p=0.015).
Table 2.
Effect of APP/PS1 Mutations
| Wild-Type | APP/PS1 | |||
|---|---|---|---|---|
|
| ||||
| 6 months | 18 months | 6 months | 18 months | |
| Weight (g)b | 38 ± 1.8 | 47.4 ± 1.9 | 40.8 ± 1.9 | 45.2 ± 1.9 |
| Fat (g) | 7.85 ± 1.37 | 10.1 ± 1.45 | 6.43 ± 1.45 | 9.82 ± 1.45 |
| Muscle (g)b | 25.91 ± 0.74 | 31.37 ± 0.78 | 28.67 ± 0.78 | 30.01 ± 0.78 |
| Free Fluids (g)b | 1.14 ± 0.19 | 1.99 ± 0.2 | 1.2 ± 0.2 | 2.02 ± 0.2 |
| Triglycerides (mg/dL)a,b | 38.1 ± 4.6 | 25.5 ± 4.8 | 49.3 ± 4.6 | 36 ± 5 |
| NEFA (mEq/dL)a,b,c | 1.42 ± 0.09 | 1.04 ± 0.1 | 1.76 ± 0.09 | 1.33 ± 0.1 |
| Cholesterol (mg/dL)a,b | 70.9 ± 7.8 | 91.6 ± 8.1 | 98.8 ± 7.8 | 129.7 ± 8.5 |
| HDL (mg/dL)a | 69 ± 7 | 70.7 ± 7.3 | 86.2 ± 7 | 87.3 ± 7.7 |
| LDL (mg/dL)a | 15 ± 3.7 | 17.4 ± 3.8 | 25.4 ± 3.7 | 35.8 ± 4 |
| Insulin (ng/mL)b | 6.6 ± 2.1 | 14.6 ± 2.3 | 5.8 ± 2.1 | 11.1 ± 2.3 |
| Leptin (ng/mL)a | 3.67 ± 1.52 | 7.59 ± 1.52 | 1.36 ± 1.52 | 3.17 ± 1.63 |
| Adiponectin (ng/mL)a,b | 787 ± 44 | 569 ± 46 | 566 ± 44 | 550 ± 49 |
| Total Aβ (pM)a,b | 1312 ± 76 | 3834 ± 70 | 1732 ± 79 | 81936 ± 9972 |
significant effect of genotype (p≤0.05)
significant effect of age (p≤0.05)
NEFA = non-esterified fatty acids
We next examined whether any of these observed effects were associated with changes in brain Aβ. Weight, fat mass, and muscle mass did not significantly correlate with brain Aβ (p>0.43 in all cases), supporting the hypothesis that body composition is not non-specifically related to the level of brain Aβ. Free fluid content was marginally significant (p=0.05), though the reason for this is unclear. Plasma lipids in the form of triglycerides and NEFA were also not significantly correlated (p>0.5) with Aβ. Similarly, plasma insulin was not correlated with brain Aβ (p=0.21). Consistent with previous reports, cholesterol was strongly correlated with Aβ, particularly total cholesterol and LDL (p<0.0005 for both). These data support a specific role for leptin as a regulator of Aβ in the brain.
3.2. Effect of Leptin on Cells in Culture
In order to determine if leptin has a direct effect on Aβ production in neural cells, we treated APPΔNLh-overexpressing H4 neuroglioma cells with leptin and measured the effect on APP processing and Aβ generation. There was a dose-dependent decrease in the amount of Aβ generated in cells treated with leptin in the physiological range observed in mice (10–50 ng/mL): there was a significant reduction in cells treated with 50 ng/mL leptin (Figure 2A; p=0.024). This was concomitant with accumulation of APP α- and β-C-terminal fragments (Figure 2B). These two events are hallmarks of reduced γ-secretase activity ([33]; i.e. loss of product and accumulation of substrate), and led us to ask the question of how leptin affects this process.
Figure 2. Leptin Treatment Inhibits Aβ Production in Cell Culture.

Leptin reduced the Aβ concentration in conditioned media from APPΔNLh-overexpressing H4 neuroglioma cells after 24 hours of treatment (A; * = p<0.05), concomitant with accumulation of APP C-terminal fragments (CTFα and β: B), indicative of reduced γ-secretase activity. Two independent experiments were performed. A is an average of the two experiments, while B is a representative immunoblot of the results.
γ-Secretase is a multimeric complex, whose four main components (presenilin (PS), nicastrin, PEN2, and APH1) are individually and coordinately regulated, both transcriptionally and post-translationally [4]. Because leptin binds to cell surface receptors, stimulating intracellular signaling and transcriptional regulation [34], we examined the possibility that leptin regulates transcription of γ-secretase components by measuring mRNA expression by quantitative RT-PCR after leptin treatment of wild-type H4 cells. We found that leptin treatment reduced expression of many of the components of the enzyme complex (PS1, PEN2, nicastrin, and APH1B) by ~30–50% (Figure 3; p<03 in all cases). Expression of PS2, another presenilin isoform, was unchanged (p=0.4). We saw the same effect in SH-SY5Y cells, a human neuroblastoma cell line (data not shown). Finally, because recent reports have postulated that leptin regulates Aβ via β-secretase regulation [23], we measured the effect of leptin treatment on BACE1 and BACE2 mRNA expression in H4 cells. Leptin treatment had no effect on the transcription of BACE1 (Figure 3; p=0.3), but led to an increase in the expression of BACE2 (p=0.004). While this is a potentially interesting result, an increase in BACE2 expression due to plasma leptin levels would not account for the decrease in Aβ observed in cells treated with leptin. Together, these data indicate that leptin inhibits expression of γ-secretase components, leading to a reduction of Aβ.
Figure 3. Leptin Treatment Reduces mRNA Levels of γ-Secretase Components in Cell Culture.
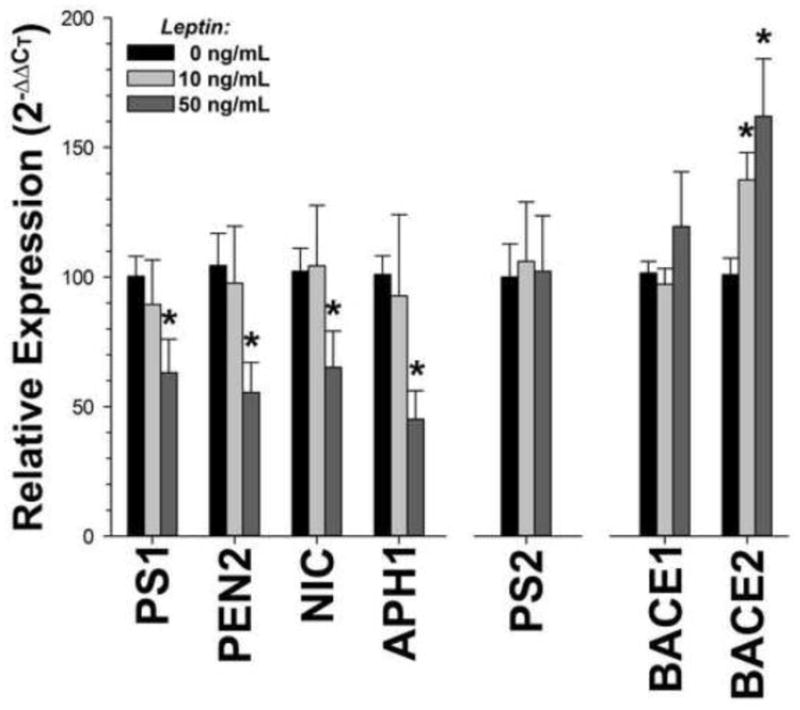
mRNA expression of the γ-secretase components PS1, PEN2, nicastrin, and APH1 were decreased after leptin treatment in wild-type neuronal tissue culture cells. On the contrary, there was an overall increase in the expression of BACE2 (p=0.014), one of the β-secretase enzymes. There was no change in PS2 or BACE1 mRNA expression (p>0.12). The data are an average of 2–3 independent experiments.
3.3. Effect of Leptin on γ-Secretase Expression in the Brain
We next wanted to determine if leptin also affects the γ-secretase components at the protein level, focusing on those components that were affected at the mRNA level. PS1 protein expression was significantly, inversely correlated with plasma leptin (Figure 4A; p<0.0001), demonstrating that this regulation occurs in vivo. Brain expression of PEN2 (p<0.73) and APH1A (p<0.59) were not significantly correlated with plasma leptin, suggesting that leptin does not directly affect expression of these molecules at the protein level. In addition, PS1 expression was positively correlated with brain Aβ (Figure 4B; p<0.004), supporting a causative effect on amyloid accumulation. We also examined a subset of mouse brain samples by Western blot. Interestingly, nicastrin displayed a size shift to a lower molecular weight (Figure 4C) in mice with higher plasma leptin levels (Figure 4D; p=0.03). This change is consistent with the accumulation of the immature, partially deglycosylated form of nicastrin [29], which requires presenilin for its maturation through the endoplasmic reticulum. Similarly, treatment of H4 cells with exogenous leptin induced a shift to the immature form of nicastrin (Figure 4E), though this change did not reach significance (Figure 4F; p>0.09 for all pairwise comparisons). Together, these findings show that leptin is an important regulator of APP processing and Aβ production through its regulation of PS1 transcription. Finally, we performed a validation analysis in a randomly-selected subset of ~50% of the animals. This yielded identical results for the relationships between plasma leptin and Aβ (R2 = 0.33, p<0.0001, N = 57), plasma leptin and PS1 (R2 = 0.21, p<0.0001, N = 51), and PS1 and Aβ (R2 = 0.16, p<0.004, N = 52).
Figure 4. Plasma Leptin Negatively Correlates with PS1 Expression in Brain.

Plasma leptin was strongly and negatively correlated with brain PS1 protein levels (A: N=65; p<0.0001), but not other γ-secretase components (not shown: N=65; PEN2, p<0.727; APH1A, p<0.591). The amount of PS1 protein was positively correlated with brain Aβ (B: N=65; p<0.004). Brain nicastrin (C) displayed a shift to a smaller molecular weight with increasing plasma leptin concentrations (D: N=16; p=0.03), indicating accumulation of an immature form of the protein. Similarly, leptin treatment of H4 cells led to accumulation of the immature form of nicastrin (E), though the change was not significant (F: N=1-; p=0.31).
4. Discussion
The data presented herein support a role for the circulating hormone leptin in the regulation of γ-secretase and, hence, Aβ accumulation in the brain. Our data indicate that leptin transcriptionally regulates PS1 mRNA expression in neuronal cells (Figure 3), thereby reducing PS1 protein levels in the brain (Figure 4A). This regulation appears to be specific to the PS1 isoform of presenilin as there was no change in PS2 expression upon addition of leptin to neuronal cells (Figure 3). These changes likely impact catalytic activity of the γ-secretase complex. Indeed, it has been demonstrated previously that alterations in PS1 protein levels impact formation of stable γ-secretase complexes, ultimately affecting expression and modification of the other components, which in turn regulates γ-secretase activity [4]. Consistent with these reports, we also observed a decrease in mRNA expression of other γ-secretase components, including nicastrin, PEN2, and APH1 (Figure 3), though these changes did not extend to the protein level. In addition, we have observed a leptin-dependent accumulation of immature, partially-glycosylated nicastrin, both in cell culture and mouse brain extracts (Figure 4C,E), indicating that levels of active protein may be affected, even if total protein is not. Based on this data, it is likely that the changes in PEN2, nicastrin, and APH1 mRNA levels are a result of PS1 downregulation and not a direct result of leptin treatment Another possibility is that leptin downregulates the gene expression of the γ-secretase components, but that these changes only affect the steady-state protein level of PS1.
Our findings highlight a potential role for leptin in the etiology of AD. These results have profound implications on the AD field. Currently, there are no widely accepted peripheral biomarkers of AD [35, 36], making pre-diagnosis difficult. The current standard of cognitive testing relies on the detection of existing memory deficits, and may preclude advance preventative strategies. Plasma leptin could predict AD risk several years ahead of the onset of cognitive impairment [25, 37], demonstrating that assessment of plasma leptin in middle-aged and elderly individuals holds some promise in this regard. In addition, leptin provides a novel target for prevention, through replacement therapy, as well as therapeutic treatment of AD.
Leptin has been studied extensively in the context of obesity-linked diabetes, a disease that confers a significantly elevated risk for AD through unknown mechanisms [9, 38, 39]. Because leptin circulates at levels proportional to the amount of adipose tissue, obese individuals have significantly elevated plasma leptin [40]. Under normal circumstances, high levels of leptin should be neuroprotective. However, persistent hyperleptinemia renders the hypothalamus, and likely other areas of the brain, incapable of responding to plasma leptin- a consequence known as leptin resistance [16]. Therefore, diabetic patients are part of a subclass of AD patients that may require unique preventatives and/or therapeutics. Discerning the signaling pathways involved in leptin-mediated PS1 and Aβ regulation may provide a target for these strategies. To this end, an animal model with features of both diseases may help to shed light on these mechanisms.
Finally, another interesting question to address in the future will be the additional ramification(s) of leptin-mediated PS1 regulation. In other words, why is PS1 a target of leptin signaling in non-pathological conditions? While the answer to this question is still unclear, one intriguing possibility is the recently elucidated role for PS1 in autophagy [41, 42]. A hormone, such as leptin, that controls cellular energy homeostasis would likely play a role in starvation-induced protein turnover, and control of presenilin expression is one way to achieve that.
5. Conclusions
In conclusion, plasma leptin directly controls PS1 expression via transcriptional regulation. Downregulation of PS1 subsequently decreases expression of the other γ-secretase components, thereby reducing γ-secretase activity and Aβ generation. Low plasma leptin may therefore contribute to the onset of AD and may provide a novel avenue of research into the mechanisms underlying the disease, as well as biomarker and prevention research.
Highlights.
Plasma leptin is negatively correlated with brain β-amyloid
Leptin treatment reduces β-amyloid in neuronal cells
Leptin treatment inhibits γ-secretase expression in neuronal cells
Plasma leptin in negatively correlated with presenilin 1 expression in the brain
Acknowledgments
We would like to thank Dr. Pete Nelson and Wangxia Wang for the H4 RNA, Chris Holler and Robin Webb for tissue collection, Drs. Fred Schmitt and Elizabeth Head for helpful discussion, Dr. Todd Golde for providing Aβ antibodies, and Dr. Paul Fraser for providing the nicastrin antibody. Supported by NSF (DBI004931), NIH (AG005119, NS058382, NS077482-01 RR020171), The Coins for Alzheimer’s Research Trust, the Alzheimer’s Association (IIRG-10-172905), and Hibernia Nation Bank/Edward G. Schleider Chair.
Footnotes
Publisher's Disclaimer: This is a PDF file of an unedited manuscript that has been accepted for publication. As a service to our customers we are providing this early version of the manuscript. The manuscript will undergo copyediting, typesetting, and review of the resulting proof before it is published in its final citable form. Please note that during the production process errors may be discovered which could affect the content, and all legal disclaimers that apply to the journal pertain.
References
- 1.Goate A, Hardy J. Twenty years of Alzheimer’s disease-causing mutations. Journal of neurochemistry. 2012;120(Suppl 1):3–8. doi: 10.1111/j.1471-4159.2011.07575.x. [DOI] [PubMed] [Google Scholar]
- 2.Querfurth HW, LaFerla FM. Alzheimer’s disease. N Engl J Med. 2010;362:329–344. doi: 10.1056/NEJMra0909142. [DOI] [PubMed] [Google Scholar]
- 3.Niedowicz DM, Nelson PT, Murphy MP. Alzheimer’s disease: pathological mechanisms and recent insights. Curr Neuropharmacol. 2011;9:674–684. doi: 10.2174/157015911798376181. [DOI] [PMC free article] [PubMed] [Google Scholar]
- 4.Spasic D, Annaert W. Building gamma-secretase: the bits and pieces. J Cell Sci. 2008;121:413–420. doi: 10.1242/jcs.015255. [DOI] [PubMed] [Google Scholar]
- 5.Theuns J, Van Broeckhoven C. Transcriptional regulation of Alzheimer’s disease genes: implications for susceptibility. Hum Mol Genet. 2000;9:2383–2394. doi: 10.1093/hmg/9.16.2383. [DOI] [PubMed] [Google Scholar]
- 6.St George-Hyslop P, Fraser PE. Assembly of the presenilin gamma-/epsilon-secretase complex. Journal of neurochemistry. 2012;120(Suppl 1):84–88. doi: 10.1111/j.1471-4159.2011.07505.x. [DOI] [PubMed] [Google Scholar]
- 7.Bourne KZ, Ferrari DC, Lange-Dohna C, Rossner S, Wood TG, Perez-Polo JR. Differential regulation of BACE1 promoter activity by nuclear factor-kappaB in neurons and glia upon exposure to beta-amyloid peptides. J Neurosci Res. 2007;85:1194–1204. doi: 10.1002/jnr.21252. [DOI] [PubMed] [Google Scholar]
- 8.Signore AP, Zhang F, Weng Z, Gao Y, Chen J. Leptin neuroprotection in the CNS: mechanisms and therapeutic potentials. J Neurochem. 2008;106:1977–1990. doi: 10.1111/j.1471-4159.2008.05457.x. [DOI] [PMC free article] [PubMed] [Google Scholar]
- 9.Luchsinger JA, Gustafson DR. Adiposity, Type 2 Diabetes, and Alzheimer’s Disease. J Alzheimers Dis. 2009;16:693–704. doi: 10.3233/JAD-2009-1022. [DOI] [PMC free article] [PubMed] [Google Scholar]
- 10.Kivipelto M, Ngandu T, Fratiglioni L, Viitanen M, Kareholt I, Winblad B, Helkala EL, Tuomilehto J, Soininen H, Nissinen A. Obesity and vascular risk factors at midlife and the risk of dementia and Alzheimer disease. Arch Neurol. 2005;62:1556–1560. doi: 10.1001/archneur.62.10.1556. [DOI] [PubMed] [Google Scholar]
- 11.Ahtiluoto S, Polvikoski T, Peltonen M, Solomon A, Tuomilehto J, Winblad B, Sulkava R, Kivipelto M. Diabetes, Alzheimer disease and vascular dementia: a population-based neuropathologic study. Neurology. 2010;75:1195–1202. doi: 10.1212/WNL.0b013e3181f4d7f8. [DOI] [PubMed] [Google Scholar]
- 12.Cheng D, Noble J, Tang MX, Schupf N, Mayeux R, Luchsinger JA. Type 2 diabetes and late-onset Alzheimer’s disease. Dement Geriatr Cogn Disord. 2011;31:424–430. doi: 10.1159/000324134. [DOI] [PMC free article] [PubMed] [Google Scholar]
- 13.Wang KC, Woung LC, Tsai MT, Liu CC, Su YH, Li CY. Risk of Alzheimer’s disease in relation to diabetes: a population-based cohort study. Neuroepidemiology. 2012;38:237–244. doi: 10.1159/000337428. [DOI] [PubMed] [Google Scholar]
- 14.Luchsinger JA, Mayeux R. Dietary factors and Alzheimer’s disease. Lancet Neurol. 2004;3:579–587. doi: 10.1016/S1474-4422(04)00878-6. [DOI] [PubMed] [Google Scholar]
- 15.Maesako M, Uemura K, Kubota M, Kuzuya A, Sasaki K, Hayashida N, Asada-Utsugi M, Watanabe K, Uemura M, Kihara T, Takahashi R, Shimohama S, Kinoshita A. Exercise Is More Effective than Diet Control in Preventing High Fat Diet-induced beta-Amyloid Deposition and Memory Deficit in Amyloid Precursor Protein Transgenic Mice. The Journal of biological chemistry. 2012;287:23024–23033. doi: 10.1074/jbc.M112.367011. [DOI] [PMC free article] [PubMed] [Google Scholar]
- 16.Myers MG, Cowley MA, Munzberg H. Mechanisms of leptin action and leptin resistance. Annu Rev Physiol. 2008;70:537–556. doi: 10.1146/annurev.physiol.70.113006.100707. [DOI] [PubMed] [Google Scholar]
- 17.Doherty GH, Beccano-Kelly D, Yan SD, Gunn-Moore FJ, Harvey J. Leptin prevents hippocampal synaptic disruption and neuronal cell death induced by amyloid beta. Neurobiology of aging. 2012 doi: 10.1016/j.neurobiolaging.2012.08.003. [DOI] [PubMed] [Google Scholar]
- 18.Fernandez-Martos CM, Gonzalez P, Rodriguez FJ. Acute leptin treatment enhances functional recovery after spinal cord injury. PLoS One. 2012;7:e35594. doi: 10.1371/journal.pone.0035594. [DOI] [PMC free article] [PubMed] [Google Scholar]
- 19.Guo Z, Jiang H, Xu X, Duan W, Mattson MP. Leptin-mediated cell survival signaling in hippocampal neurons mediated by JAK STAT3 and mitochondrial stabilization. J Biol Chem. 2008;283:1754–1763. doi: 10.1074/jbc.M703753200. [DOI] [PubMed] [Google Scholar]
- 20.Hoda MR, Keely SJ, Bertelsen LS, Junger WG, Dharmasena D, Barrett KE. Leptin acts as a mitogenic and antiapoptotic factor for colonic cancer cells. Br J Surg. 2007;94:346–354. doi: 10.1002/bjs.5530. [DOI] [PubMed] [Google Scholar]
- 21.Russo VC, Metaxas S, Kobayashi K, Harris M, Werther GA. Antiapoptotic effects of leptin in human neuroblastoma cells. Endocrinology. 2004;145:4103–4112. doi: 10.1210/en.2003-1767. [DOI] [PubMed] [Google Scholar]
- 22.Somasundar P, Yu AK, Vona-Davis L, McFadden DW. Differential effects of leptin on cancer in vitro. J Surg Res. 2003;113:50–55. doi: 10.1016/s0022-4804(03)00166-5. [DOI] [PubMed] [Google Scholar]
- 23.Fewlass DC, Noboa K, Pi-Sunyer FX, Johnston JM, Yan SD, Tezapsidis N. Obesity-related leptin regulates Alzheimer’s Abeta. FASEB J. 2004;18:1870–1878. doi: 10.1096/fj.04-2572com. [DOI] [PubMed] [Google Scholar]
- 24.Greco SJ, Sarkar S, Johnston JM, Tezapsidis N. Leptin regulates tau phosphorylation and amyloid through AMPK in neuronal cells. Biochem Biophys Res Commun. 2009;380:98–104. doi: 10.1016/j.bbrc.2009.01.041. [DOI] [PMC free article] [PubMed] [Google Scholar]
- 25.Lieb W, Beiser AS, Vasan RS, Tan ZS, Au R, Harris TB, Roubenoff R, Auerbach S, DeCarli C, Wolf PA, Seshadri S. Association of plasma leptin levels with incident Alzheimer disease and MRI measures of brain aging. JAMA. 2009;302:2565–2572. doi: 10.1001/jama.2009.1836. [DOI] [PMC free article] [PubMed] [Google Scholar]
- 26.Murphy MP, Beckett TL, Ding Q, Patel E, Markesbery WR, St Clair DK, LeVine H, 3rd, Keller JN. Abeta solubility and deposition during AD progression and in APPxPS-1 knock-in mice. Neurobiol Dis. 2007;27:301–311. doi: 10.1016/j.nbd.2007.06.002. [DOI] [PubMed] [Google Scholar]
- 27.Kukar T, Murphy MP, Eriksen JL, Sagi SA, Weggen S, Smith TE, Ladd T, Khan MA, Kache R, Beard J, Dodson M, Merit S, Ozols VV, Anastasiadis PZ, Das P, Fauq A, Koo EH, Golde TE. Diverse compounds mimic Alzheimer disease-causing mutations by augmenting Abeta42 production. Nat Med. 2005;11:545–550. doi: 10.1038/nm1235. [DOI] [PubMed] [Google Scholar]
- 28.Murphy MP, Uljon SN, Fraser PE, Fauq A, Lookingbill HA, Findlay KA, Smith TE, Lewis PA, McLendon DC, Wang R, Golde TE. Presenilin 1 regulates pharmacologically distinct gamma-secretase activities. Implications for the role of presenilin in gamma-secretase cleavage. The Journal of biological chemistry. 2000;275:26277–26284. doi: 10.1074/jbc.M002812200. [DOI] [PubMed] [Google Scholar]
- 29.Yang DS, Tandon A, Chen F, Yu G, Yu H, Arawaka S, Hasegawa H, Duthie M, Schmidt SD, Ramabhadran TV, Nixon RA, Mathews PM, Gandy SE, Mount HT, St George-Hyslop P, Fraser PE. Mature glycosylation and trafficking of nicastrin modulate its binding to presenilins. The Journal of biological chemistry. 2002;277:28135–28142. doi: 10.1074/jbc.M110871200. [DOI] [PubMed] [Google Scholar]
- 30.Pistell PJ, Gupta S, Knight AG, Domingue M, Uranga RM, Ingram DK, Kheterpal I, Ruiz C, Keller JN, Bruce-Keller AJ. Metabolic and neurologic consequences of chronic lopinavir/ritonavir administration to C57BL/6 mice. Antiviral Res. 2010;88:334–342. doi: 10.1016/j.antiviral.2010.10.006. [DOI] [PMC free article] [PubMed] [Google Scholar]
- 31.Meier U, Gressner AM. Endocrine regulation of energy metabolism: review of pathobiochemical and clinical chemical aspects of leptin, ghrelin, adiponectin, and resistin. Clin Chem. 2004;50:1511–1525. doi: 10.1373/clinchem.2004.032482. [DOI] [PubMed] [Google Scholar]
- 32.Steinberg GR, Dyck DJ, Calles-Escandon J, Tandon NN, Luiken JJ, Glatz JF, Bonen A. Chronic leptin administration decreases fatty acid uptake and fatty acid transporters in rat skeletal muscle. The Journal of biological chemistry. 2002;277:8854–8860. doi: 10.1074/jbc.M107683200. [DOI] [PubMed] [Google Scholar]
- 33.McCarthy JV, Twomey C, Wujek P. Presenilin-dependent regulated intramembrane proteolysis and gamma-secretase activity. Cell Mol Life Sci. 2009;66:1534–1555. doi: 10.1007/s00018-009-8435-9. [DOI] [PMC free article] [PubMed] [Google Scholar]
- 34.Bjorbaek C, Kahn BB. Leptin signaling in the central nervous system and the periphery. Recent Prog Horm Res. 2004;59:305–331. doi: 10.1210/rp.59.1.305. [DOI] [PubMed] [Google Scholar]
- 35.Mattsson N, Zetterberg H, Hansson O, Andreasen N, Parnetti L, Jonsson M, Herukka SK, van der Flier WM, Blankenstein MA, Ewers M, Rich K, Kaiser E, Verbeek M, Tsolaki M, Mulugeta E, Rosen E, Aarsland D, Visser PJ, Schroder J, Marcusson J, de Leon M, Hampel H, Scheltens P, Pirttila T, Wallin A, Jonhagen ME, Minthon L, Winblad B, Blennow K. CSF biomarkers and incipient Alzheimer disease in patients with mild cognitive impairment. JAMA. 2009;302:385–393. doi: 10.1001/jama.2009.1064. [DOI] [PubMed] [Google Scholar]
- 36.Petersen RC, Trojanowski JQ. Use of Alzheimer disease biomarkers: potentially yes for clinical trials but not yet for clinical practice. JAMA. 2009;302:436–437. doi: 10.1001/jama.2009.1073. [DOI] [PMC free article] [PubMed] [Google Scholar]
- 37.Holden KF, Lindquist K, Tylavsky FA, Rosano C, Harris TB, Yaffe K. Serum leptin level and cognition in the elderly: Findings from the Health ABC Study. Neurobiol Aging. 2009;30:1483–1489. doi: 10.1016/j.neurobiolaging.2007.11.024. [DOI] [PMC free article] [PubMed] [Google Scholar]
- 38.Li ZG, Zhang W, Sima AA. Alzheimer-like changes in rat models of spontaneous diabetes. Diabetes. 2007;56:1817–1824. doi: 10.2337/db07-0171. [DOI] [PubMed] [Google Scholar]
- 39.Roberts RO, Geda YE, Knopman DS, Christianson TJ, Pankratz VS, Boeve BF, Vella A, Rocca WA, Petersen RC. Association of duration and severity of diabetes mellitus with mild cognitive impairment. Arch Neurol. 2008;65:1066–1073. doi: 10.1001/archneur.65.8.1066. [DOI] [PMC free article] [PubMed] [Google Scholar]
- 40.Considine RV, Sinha MK, Heiman ML, Kriauciunas A, Stephens TW, Nyce MR, Ohannesian JP, Marco CC, McKee LJ, Bauer TL, et al. Serum immunoreactive-leptin concentrations in normal-weight and obese humans. N Engl J Med. 1996;334:292–295. doi: 10.1056/NEJM199602013340503. [DOI] [PubMed] [Google Scholar]
- 41.Lee JH, Yu WH, Kumar A, Lee S, Mohan PS, Peterhoff CM, Wolfe DM, Martinez-Vicente M, Massey AC, Sovak G, Uchiyama Y, Westaway D, Cuervo AM, Nixon RA. Lysosomal proteolysis and autophagy require presenilin 1 and are disrupted by Alzheimer-related PS1 mutations. Cell. 2010;141:1146–1158. doi: 10.1016/j.cell.2010.05.008. [DOI] [PMC free article] [PubMed] [Google Scholar]
- 42.Neely KM, Green KN, LaFerla FM. Presenilin is necessary for efficient proteolysis through the autophagy-lysosome system in a gamma-secretase-independent manner. J Neurosci. 2011;31:2781–2791. doi: 10.1523/JNEUROSCI.5156-10.2010. [DOI] [PMC free article] [PubMed] [Google Scholar]