

Abstract
Background/Aims
Plasma fluorescent oxidation products (FLOP) constitute a stable and easily-measured biomarker of cumulative oxidative stress. However, its association with chronic kidney disease (CKD) has not been studied.
Methods
We examined the association of FLOP and CKD in 201 CKD patients and 201 controls without CKD from the community. CKD was defined as estimated glomerular filtration rate (eGFR) <60 ml/min/1.73m2 or presence of albuminuria.
Results
Adjusted median (interquartile range) of FLOP was significantly higher in patients with CKD than in controls [FLOP1 (lipid oxidation products): 215.2 fluorescent intensity (FI)/mL (181.3, 268.7) vs. 156.6 FI/mL (139.6, 177.3), p<0.0001; FLOP2 (DNA oxidation products): 534.8 FI/mL (379.3, 842.4) vs. 269.9 FI/mL (232.4, 410.5), p<0.0001; FLOP3 (protein and phospholipids oxidation products): 51.4 FI/mL (44.4, 66.0) vs. 45.2 FI/mL (38.3, 51.7), p=0.002]. Compared with those with a FLOP level below the 75th percentile, participants with a FLOP level above the 75th percentile had an increased odds of CKD after adjustment for covariables [FLOP1: odds ratio (OR), 13.1, 95% confidence interval (CI), 6.2, 27.6; FLOP2: OR, 5.7, 95% CI, 2.9, 11.1; FLOP3: OR, 2.4, 95% CI, 1.2, 4.7]. Levels of FLOP1, FLOP2, and FLOP3 were related to eGFR (all p-values <0.0001) and log-transformed urine albumin (all p-values <0.005) in multivariable adjusted linear regression models.
Conclusion
These data indicate that elevated FLOP level is associated with CKD status and severity. Future studies are warranted to elucidate its role in the development and progression of CKD.
Keywords: albuminuria, biological markers, case-control study, glomerular filtration rate, kidney diseases, oxidative stress
Introduction
Chronic kidney disease (CKD) is a major clinical and public health issue due to its high prevalence, the progression to end-stage renal disease, and disproportionate risk of cardiovascular disease [1]. Traditional risk factors do not sufficiently predict CKD morbidity and mortality. Recently, it has been suggested that oxidative stress, one of the most potent inducers of endothelial dysfunction and atherosclerosis, is increased in patients with end-stage renal disease [2]. However, the association of oxidative stress with pre-dialysis CKD has not been well studied.
Oxidative stress refers to a state of dysmetabolism in chronic disease characterized by an abundance of oxidized macromolecules, including lipids, carbohydrates, proteins, amino acids, and DNA, that can result in tissue injury and disease through inflammation and endothelial dysfunction pathways [3, 4]. Fluorescent oxidation products (FLOP) result from the interaction of reactive oxygen intermediates and free radicals with macromolecules, and show characteristic fluorescence spectra [5]. Commonly used oxidation markers such as F2-isoprostanes and malondialdehyde reflect only a portion of oxidation – lipid oxidation. FLOP detect oxidation products generated from several pathways including lipid, protein, DNA, and carbohydrate oxidation. The fluorescent method of detecting levels of oxidation products provides a more stable, easily-measured, and sensitive biomarker of cumulative metabolic and oxidative stress relative to existing techniques for the measurement of oxidative stress biomarkers, such as high-pressure liquid chromatography for measuring malondialdehyde and gas chromatography/mass spectrometry for measuring F2-isoprostanes [6]. In addition, plasma FLOP independently predicted risk of subsequent coronary heart disease and other fatal and nonfatal cardiovascular disease events in previous epidemiologic studies [7, 8]. However, the association of FLOP with CKD has not previously been studied. In the present study, we examined the association of FLOP levels and CKD in 201 CKD patients and 201 controls without CKD from the community.
Methods
Study Participants
We recruited 201 CKD patients and 201 controls without CKD in the greater New Orleans, Louisiana area from 2007 to 2010. CKD patients aged 21–74 years were recruited from nephrology and internal medicine clinics via physicians’ referral by trained research staff in the study area. All eligible CKD patients identified in the recruiting clinics were invited to participate in the study. CKD was defined as estimated glomerular filtration rate (eGFR) <60 ml/min/1.73 m2 or presence of albuminuria (≥30 mg/24-hours). Patients were excluded if they had a history of chronic dialysis, kidney transplants, immunotherapy in the past six months, chemotherapy within the past two years, and current clinical trial participation that may have an impact on CKD. Additional exclusion criteria were history of HIV or AIDS and inability or unwillingness to give informed consent. Controls were recruited through mass mailing to residents aged 21–74 years living in the same area according to zip code. The eligibility of controls was assessed by a pre-screening telephone interview and a clinic screening visit. Individuals were included if they had no evidence of CKD (eGFR >60 ml/min/1.73 m2 and no persistent albuminuria). Cases and controls were frequency-matched according to age group (10 years), gender, and race to increase the efficiency of patient recruitment and statistical analysis.
Tulane University Institutional Review Board approved this study. Written documentation of informed consent was obtained at the screening visit from all study participants. Procedures were followed in accordance with ethical standards of Tulane University Institutional Review Board and with the Helsinki Declaration.
Measurements
A standard questionnaire was administered by trained staff at a clinical visit to obtain demographic information (age, gender, race, education), lifestyle risk factors (including cigarette smoking, alcohol drinking, and physical activity), self-reported history of cardiovascular disease, diabetes, hypercholesterolemia, and hypertension, as well as the use of antihypertensive, lipid-lowering, and diabetes medications, and the use of aspirin.
Three blood pressure measurements were obtained at a clinical visit by trained and certified staff according to a common protocol adapted from procedures recommended by the American Heart Association. A standard mercury sphygmomanometer was used, and one of four cuff sizes (pediatric, regular adult, large, or thigh) was chosen on the basis of the circumference of the participant’s arm. Body height and weight were obtained by trained staff and used to calculate body-mass index (body-mass index=weight in kilograms/height2 in meters).
An overnight fasting blood sample was collected to measure plasma glucose, serum cholesterol, serum creatinine, and plasma FLOP. Plasma samples were centrifuged at 3,000 rpm for 45 minutes within five minutes of sample collection. Serum samples were centrifuged at 2,400 rpm for 20 minutes within ten minutes of sample collection. Renal function parameters and a lipid profile were run within 24 hours on a serum sample for each participant. Remaining serum and plasma tubes were frozen at −80°C immediately after centrifugation until further laboratory analysis. A 24-hour urine sample was collected to measure creatinine and albumin.
The procedures for measuring FLOP were adapted from the method of Shimasaki and have been described in detail previously [6, 9]. Briefly, plasma samples were mixed with ethanol/ether, centrifuged for 10 minutes at 3,000 rpm, and supernatant was added to cuvettes for spectrofluorometric reading. Fluorescence was quantified as relative fluorescent intensity units per milliliter of plasma at 360/420 nm wavelength (excitation/emission) for FLOP1, at 320/420 nm for FLOP2, and at 400/475 nm for FLOP3 by a spectrofluorometer (Shimadzu RF-5301 PC). FLOP1 reflects lipid oxidation products that have reacted with proteins, DNA, and carbohydrates, FLOP2 can result from the oxidation of linoleate with DNA in the presence of metals, and FLOP3 can be produced by malondialdehyde reacting with proteins and phospholipids [5].
Plasma glucose was measured using a hexokinase enzymatic method (Roche Diagnostics, Indianapolis, IN, USA). Serum total cholesterol and triglycerides were assayed using an enzymatic procedure on the Hitachi 902 automatic analyzer (Roche Diagnostics, Indianapolis, IN, USA). Serum HDL was quantified by a combined procedure of heparin-calcium precipitation of apo-B-containing lipoproteins and agar-agarose gel electrophoresis of lipoproteins. Low-density lipoprotein (LDL) cholesterol was calculated using the Friedewald equation for individuals with serum triglyceride <400 mg/dL. Serum creatinine was measured using the Roche enzymatic method (Roche–Hitachi P-Module instrument with Roche Creatininase Plus assay, Hoffman-La Roche, Basel, Switzerland). Urine concentrations of albumin and creatinine were measured with a DCA 2000 Analyzer (Bayer AG, Leverkusen, Germany). eGFR was estimated from serum creatinine (SCr), sex, age, and race using the CKD-Epi equation: eGFR = 141 × min(SCr/κ, 1)α × max(SCr/κ, 1)−1.209 × 0.993Age × 1.018 (if female) × 1.159 (if black), where κ is 0.7 and 0.9 and α is −0.329 and −0.411 for females and males, respectively [10].
Statistical Analysis
Basic descriptive statistics were run to describe the demographic and clinical characteristics of the study population. T-tests and chi-squared tests were performed to assess statistical significance of differences in demographic and clinical characteristics according to CKD case or control status.
Inverse transformations were used for plasma FLOP and log transformations were used for urine albumin levels because they were not normally distributed. Multivariable linear regression was used to examine the association between eGFR and inverse-transformed plasma FLOP levels, as well as for log-transformed albumin and inverse-transformed plasma FLOP levels. Age, gender, race, high-school education, current cigarette smoking, weekly alcohol consumption, physical activity (≥ twice per week), body-mass index, LDL-cholesterol, plasma glucose, systolic blood pressure, history of hypertension, diabetes, and cardiovascular disease, and medication use were selected for adjustment in these analyses based on their association with CKD in this study and previously published literature. Pearson correlation coefficients were also calculated to assess the association between eGFR and inverse-transformed plasma FLOP levels, and the association between log-transformed albumin and inverse-transformed plasma FLOP levels. Quantile regression was used to obtain medians and interquartile ranges of plasma FLOP for CKD patients and controls, after adjusting for the aforementioned covariates [11]. The Wald test was used to test differences in the adjusted medians between CKD patients and controls. Multivariable logistic regression was used to obtain adjusted odds ratios comparing the highest quartile of plasma FLOP levels to the lower three quartiles between CKD patients and controls, after adjustment for the aforementioned covariates. Plasma FLOP quartiles were defined based upon plasma FLOP measurements in the control group. All analyses were performed using SAS version 9.2 statistical software (Cary, NC).
Results
The demographic and clinical characteristics of study participants according CKD status are provided in Table 1. Participants with CKD were older, more likely to be male, achieved a lower level of education, were less physically active, and less likely to drink alcohol compared to those without CKD. Those with CKD were more likely to have a medical history of cardiovascular disease, hypertension, diabetes, and hypercholesterolemia, and to be taking medications for these conditions. Mean body-mass index, systolic blood pressure, fasting glucose, urine albumin, and creatinine were significantly higher while LDL-cholesterol and eGFR were lower in CKD patients compared to controls.
Table 1.
Characteristics of 201 Patients with Chronic Kidney Disease and 201 Controls
| Variables | CKD patients (n = 201) | Non-CKD controls (n = 201) | P-value for difference |
|---|---|---|---|
| Age, years | 55.9 ± 9.9 | 52.5 ± 10.0 | 0.0007 |
| Male, % | 55.2 | 45.3 | 0.046 |
| Black, % | 60.7 | 51.2 | 0.056 |
| High-school education, % | 58.5 | 81.6 | <0.0001 |
| Current cigarette smoking, % | 53.7 | 48.8 | 0.32 |
| Weekly alcohol drinking, % | 27.9 | 59.2 | <0.0001 |
| Twice weekly physical activity, % | 53.0 | 72.9 | <0.0001 |
| Body-mass index, kg/m2 | 32.2 ± 7.8 | 28.9 ± 6.4 | <0.0001 |
| Systolic blood pressure, mmHg | 132.2 ± 21.0 | 122.0 ± 14.7 | <0.0001 |
| Diastolic blood pressure, mmHg | 77.2 ± 13.5 | 77.6 ± 9.4 | 0.77 |
| Plasma glucose, mg/dL | 119.9 ± 46.7 | 103.4 ± 35.4 | <0.0001 |
| LDL-cholesterol, mg/dL | 103.3 ± 45.9 | 118.2 ± 30.2 | <0.0001 |
| History of cardiovascular disease, % | 43.7 | 7.0 | <0.0001 |
| History of hypertension, % | 88.1 | 23.9 | <0.0001 |
| History of diabetes, % | 49.3 | 5.5 | <0.0001 |
| History of hypercholesterolemia, % | 65.7 | 30.8 | <0.0001 |
| Anti-hypertensive medication use, % | 79.6 | 15.4 | <0.0001 |
| Diabetes medication use, % | 34.3 | 3.0 | <0.0001 |
| Lipid-lowering medication use, % | 21.9 | 9.0 | 0.003 |
| Aspirin use, % | 34.8 | 8.5 | <0.0001 |
| Serum creatinine, mg/dL | 2.0 ± 1.1 | 0.9 ± 0.2 | <0.0001 |
| eGFR, mL/min/1.73 m2 | 43.3 ± 19.9 | 96.7 ± 16.8 | <0.0001 |
| Urine albumin, mg/24 hrs* | 74.5 (12.3, 417.4) | 5.9 (4.1, 11.4) | <0.0001 |
CKD, chronic kidney disease; eGFR, estimated glomerular filtration rate; LDL-cholesterol, low-density lipoprotein-cholesterol
Median (interquartile range)
The levels of plasma FLOP1, FLOP2, and FLOP3 are significantly related to CKD severity, as indicated by level of eGFR and urine albumin (Table 2, Figure 1a–f). In the multivariable linear regression analyses, inverse-transformed FLOP predicted eGFR (all p<0.0001) and log-transformed urine albumin (all p<0.005). Inverse-transformed plasma levels of FLOP1, FLOP2, and FLOP3 were significantly correlated with eGFR (r=0.58, 0.55, and 0.38, respectively; all p-values <0.0001) and log-transformed urine albumin (r=−0.45, −0.40, and −0.25, respectively; all p-values <0.0001).
Table 2.
Multivariable-Adjusted Regression Coefficients (95% Confidence Intervals) of One Standard Deviation Higher in the Inverse-Transformed Plasma Fluorescent Oxidation Products with Estimated Glomerular Filtration Rate and Log-Transformed Urine Albumin
| FLOP1 Effect size (95% CI), p-value |
FLOP2 Effect size (95% CI), p-value |
FLOP3 Effect size (95% CI), p-value |
||||
|---|---|---|---|---|---|---|
|
| ||||||
| eGFR | Urine Albumin | eGFR | Urine Albumin | eGFR | Urine Albumin | |
| Age-gender-race-adjusted | 18.2 (15.6, 20.8) <0.0001 |
−0.85 (−1.03, −0.67) <0.0001 |
16.8 (14.0, 19.6) <0.0001 |
−0.78 (−0.97, −0.59) <0.0001 |
11.0 (7.9, 14.1) <0.0001 |
−0.46 (−0.66, −0.26) <0.0001 |
| Multivariable-adjusted* | 16.0 (13.4, 18.6) <0.0001 |
−0.67 (−0.84, −0.49) <0.0001 |
14.0 (11.2, 16.8) <0.0001 |
−0.56 (−0.74, −0.37) <0.0001 |
9.7 (6.7, 12.7) <0.0001 |
−0.35 (−0.54, −0.16) 0.0004 |
| Multivariable-adjusted** | 13.6 (11.0, 16.2) <0.0001 |
−0.57 (−0.75, −0.38) <0.0001 |
11.7 (9.0, 14.4) <0.0001 |
−0.45 (−0.64, −0.26) <0.0001 |
8.2 (5.4, 11.1) <0.0001 |
−0.30 (−0.49, −0.11) 0.0022 |
| Multivariable-adjusted*** | 13.8 (11.2, 16.3) <0.0001 |
−0.56 (−0.74, −0.38) <0.0001 |
12.0 (9.2, 14.7) <0.0001 |
−0.46 (−0.65, −0.27) <0.0001 |
8.1 (5.3, 10.9) <0.0001 |
−0.27 (−0.46, −0.08) 0.0048 |
Adjusted for age, gender, race, high-school education, physical activity, current cigarette smoking, weekly alcohol drinking, body-mass index, low-density lipoprotein-cholesterol, serum glucose, systolic blood pressure, and history of cardiovascular disease.
Adjusted for age, gender, race, high-school education, physical activity, current cigarette smoking, weekly alcohol drinking, body-mass index, low-density lipoprotein-cholesterol, history of hypertension, diabetes, and cardiovascular disease.
Adjusted for age, gender, race, high-school education, physical activity, current cigarette smoking, weekly alcohol drinking, body-mass index, low-density lipoprotein-cholesterol, serum glucose, systolic blood pressure, history of cardiovascular disease, anti-hypertensive medication, diabetes medication, lipid-lowering medication, and aspirin.
CI, confidence interval; eGFR, estimated glomerular filtration rate; FLOP, fluorescent oxidation products
Figure 1.
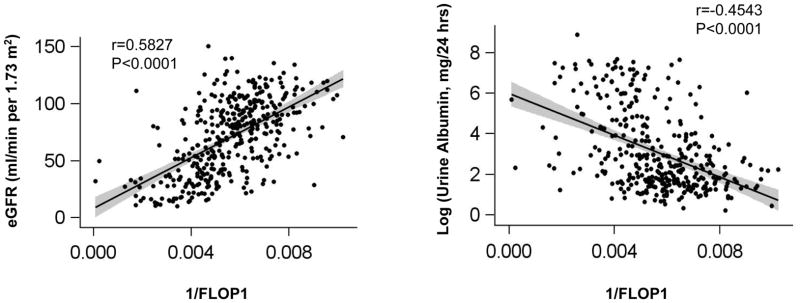
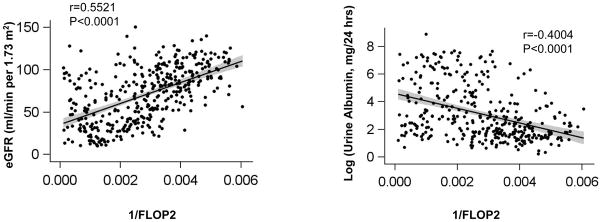
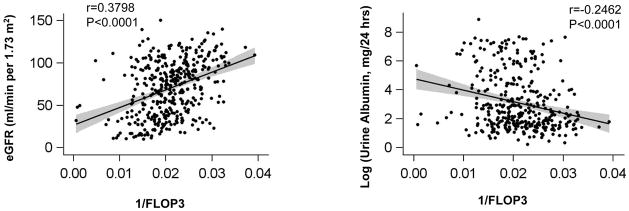
Figure 1a–f. Scatterplots of inverse-transformed levels of plasma fluorescent oxidation products 1, 2, and 3 and estimated glomerular filtration rate (left panels) and log-transformed 24-hour urine albumin levels (right panels) with fitted regression line. Shaded area represents 95% confidence interval.
Plasma levels of FLOP1, FLOP2, and FLOP3 were consistently higher among CKD patients compared to controls (Table 3). After adjustment for age, gender, race, high-school education, physical activity, current cigarette smoking, weekly alcohol drinking, body-mass index, LDL-cholesterol, glucose, systolic blood pressure, history of cardiovascular disease, and use of anti-hypertensive medication, diabetes medication, lipid-lowering agents, and aspirin, the median plasma FLOP levels were statistically significantly higher in CKD patients control to controls for FLOP1, FLOP2, and FLOP3 (all p-values <0.002).
Table 3.
Multivariable-Adjusted Medians (Interquartile Range) of Plasma Fluorescent Oxidation Products According to Case or Control Status
| FLOP1, median (IQR), FI/mL | FLOP2, median (IQR), FI/mL | FLOP3, median (IQR), FI/mL | |||||||
|---|---|---|---|---|---|---|---|---|---|
|
| |||||||||
| Case | Control | p-value | Case | Control | p-value | Case | Control | p-value | |
| Age-gender-race-adjusted | 214.7 (180.1, 266.2) | 157.4 (137.6, 178.4) | <0.0001 | 511.3 (355.9, 909.5) | 268.6 (231.2, 342.5) | <0.0001 | 52.5 (43.7, 64.8) | 44.3 (38.3, 51.1) | <0.0001 |
| Multivariable-adjusted* | 216.9 (182.3, 272.4) | 157.8 (139.7, 177.5) | <0.0001 | 510.7 (358.2, 875.6) | 270.3 (230.4, 376.9) | <0.0001 | 52.5 (44.7, 66.3) | 45.2 (38.2, 52.0) | 0.0001 |
| Multivariable-adjusted** | 216.4 (182.3, 267.4) | 158.2 (139.3, 177.4) | <0.0001 | 506.1 (352.7, 874.0) | 265.4 (230.5, 384.2) | <0.0001 | 52.0 (44.8, 65.1) | 44.6 (38.4, 51.6) | 0.0008 |
| Multivariable-adjusted*** | 215.2 (181.3, 268.7) | 156.6 (139.6, 177.3) | <0.0001 | 534.8 (379.3, 842.4) | 269.9 (232.4, 410.5) | <0.0001 | 51.4 (44.4, 66.0) | 45.2 (38.3, 51.7) | 0.0019 |
Adjusted for age, gender, race, high-school education, physical activity, current cigarette smoking, weekly alcohol drinking, body-mass index, low-density lipoprotein-cholesterol, plasma glucose, systolic blood pressure, and history of cardiovascular disease.
Adjusted for age, gender, race, high-school education, physical activity, current cigarette smoking, weekly alcohol drinking, body-mass index, low-density lipoprotein-cholesterol, history of hypertension, history of diabetes, and history of cardiovascular disease.
Adjusted for age, gender, race, high-school education, physical activity, current cigarette smoking, weekly alcohol drinking, body-mass index, low-density lipoprotein-cholesterol, plasma glucose, systolic blood pressure, history of cardiovascular disease, anti-hypertensive medication, diabetes medication, lipid-lowering medication, and aspirin.
IQR, interquartile range; FLOP, fluorescent oxidation products
Logistic regression analyses demonstrated a strong, significant, and consistent relationship between plasma levels of FLOP1, FLOP2, and FLOP3 and CKD status (Table 4). For example, participants in the top quartile (≥75th percentile) of plasma FLOP1 had a 13-fold increased odds of having CKD relative to those participants with lower levels of plasma FLOP1, after adjusting for age, gender, race, education, physical activity, cigarette smoking, alcohol drinking, body-mass index, LDL-cholesterol, glucose, systolic blood pressure, history of cardiovascular disease, and use of anti-hypertensive medication, diabetes medication, lipid-lowering agents, and aspirin.
Table 4.
Odds Ratios (95% Confidence Intervals) of Chronic Kidney Disease Associated with the Top-Quartile Compared Three Lower Quartiles of Plasma Fluorescent Oxidation Products 1, 2, and 3
| FLOP1 | FLOP2 | FLOP3 | ||||
|---|---|---|---|---|---|---|
|
| ||||||
| OR (95% CI) | p-value | OR (95% CI) | p-value | OR (95% CI) | p-value | |
| Age, gender, and race-adjusted | 10.0 (6.2, 16.1) | <0.0001 | 8.3 (5.1, 13.2) | <0.0001 | 2.5 (1.6, 4.0) | <0.0001 |
| Multivariable-adjusted* | 10.2 (5.6, 18.8) | <0.0001 | 6.7 (3.8, 11.8) | <0.0001 | 2.6 (1.5, 4.6) | 0.001 |
| Multivariable-adjusted** | 10.4 (5.1, 21.4) | <0.0001 | 4.7 (2.5, 8.9) | <0.0001 | 3.1 (1.6, 6.2) | 0.001 |
| Multivariable-adjusted*** | 13.1 (6.2, 27.6) | <0.0001 | 5.7 (2.9, 11.1) | <0.0001 | 2.4 (1.2, 4.7) | 0.0109 |
Adjusted for age, gender, race, high-school education, physical activity, current cigarette smoking, weekly alcohol drinking, body-mass index, low-density lipoprotein-cholesterol, plasma glucose, systolic blood pressure, and history of cardiovascular disease.
Adjusted for age, gender, race, high-school education, physical activity, current cigarette smoking, weekly alcohol drinking, body-mass index, low-density lipoprotein-cholesterol, history of hypertension, history of diabetes, and history of cardiovascular disease.
Adjusted for age, gender, race, high-school education, physical activity, current cigarette smoking, weekly alcohol drinking, body-mass index, low-density lipoprotein-cholesterol, plasma glucose, systolic blood pressure, history of cardiovascular disease, use of anti-hypertensive medication, use of diabetes medication, use of lipid-lowering agents, and aspirin use.
CI, confidence interval; FLOP, fluorescent oxidation products; OR, odds ratio
Discussion
These study findings indicate that plasma levels of FLOP1, FLOP2, and FLOP3 were significantly higher in CKD patients compared to controls without CKD, even after adjustment for traditional risk factors for CKD and other covariates including demographic and behavioral characteristics, clinical and anthropometric measurements, history of related diseases, and medication use. Furthermore, we document a strong dose-response relationship between plasma level of FLOP1, FLOP2, and FLOP3 and degree of kidney impairment using both eGFR and urine albumin as markers.
A few clinical studies have demonstrated an increase in oxidative stress among CKD patients using a myriad of other biomarkers, including malondialdehyde, oxidized lipids, F2-isoprostanes, asymmetric dimethylarginine, advanced glycation end-products, and thiols [12–14]. For instance, one small study detected a graded relationship between CKD status and advanced glycosylation end products among eight subjects with normal renal function (16.8 units/mL), six subjects with elevated serum creatinine and persistent proteinuria (30.2 units/mL), and six ESRD subjects (82.8 units/mL) [12]. In a case-control study of 60 cases with stage 3–5 CKD and 70 healthy controls, levels of carbonyls and F2-isoprostanes were statistically significantly higher among cases than controls [13]. However, these previous oxidative stress studies have mainly been conducted among those with severe kidney disease and renal failure. The present study includes patients with moderate kidney disease, and demonstrates the positive association between FLOP and severity of CKD. As such, oxidative stress may play a role in the etiopathogenesis of CKD. In addition, FLOP has been shown to be stable in samples and reproducible within subjects over time [6, 7, 15]. Furthermore, the measurement of FLOP can be performed on samples that are collected with standard procedures and the laboratory technique is relatively uncomplicated whereas other oxidative stress markers require specific sample preparation and more sophisticated laboratory techniques such as liquid chromatography and mass spectrometry [6, 15]. These features of FLOP suggest it may be a useful marker for CKD risk stratification in clinical settings and for research studies.
The underlying etiology for increased oxidative stress is not fully understood. The proximal tubular cells in the kidney have a direct role in creating damaging oxidative products through the production of hydrogen peroxide in myoglobinuria [16]. A major component of the kidney’s role in determining the degree of systemic oxidative stress is through the retention of oxidative products by the loss of kidney function [17]. Damaged kidneys have decreased antioxidant activity and thereby accumulate oxidative products [18]. Reactive oxygen species have been shown to impact the absorption and excretion of sodium chloride and water in the thick ascending limb of the loop of Henle and the medulla [19]. Deficiency of superoxide dismutase, which metabolizes reactive oxygen species, leads to endothelial dysfunction, enhances afferent arteriole sensitivity to angiotensin II, and promotes remodeling of the renal vasculature [20]. Reactive oxygen species have been shown to directly mediate renal vasoconstriction and blood flow through the kidney [19, 21]. Our study suggests that there is markedly increased oxidative stress in CKD patients compared to controls. Elevated oxidative stress likely induces kidney dysfunction through the endothelial dysfunction and inflammation pathways.
Even though randomized clinical trials of antioxidant vitamins have not demonstrated a beneficial effect on cardiovascular disease in women [22], N-acetylcysteine and α-tocopherol (vitamin E) have both been shown to reduce cardiovascular disease events in end-stage renal disease patients in randomized clinical trials [23, 24]. Recently, bardoxolone methyl, a newly developed anti-oxidant inflammation modulator, showed some evidence of improving eGFR among diabetic CKD patients in a clinical trial [25]. These studies corroborate the theory that oxidative stress is involved with CKD pathology, and that targeting oxidative stress pathways could delay or reverse CKD progression. As new anti-oxidant medications continue to become available, plasma FLOP level could be tested as a marker to guide treatment and monitor therapeutic effects. Furthermore, clinical interventions which decrease FLOP levels may improve renal function.
There are several noteworthy strengths of this study. Our study is the first to find that plasma FLOP was significantly increased in patients with CKD. In addition, we discovered a dose-response relationship between plasma level of FLOP and the severity of CKD as measured by both eGFR and albuminuria. This association was independent of multiple CKD covariables for CKD that were carefully collected during the study. Furthermore, given the diverse study population, these results are generalizable for both men and women, and both African-Americans and Caucasians.
There are a few potential limitations of this study. Due to the observational nature of this study, there is the potential for residual confounding. However, we carefully collected and adjusted for multiple lifestyle factors, lipid markers, and other known risk factors for CKD. Secondly, the cross-sectional design limits the ability to infer causality between FLOP level and CKD. Future studies that prospectively identify CKD outcomes associated with baseline plasma level of FLOP are warranted. Lastly, FLOP is a non-specific biomarker of oxidative stress and depicts oxidation of proteins, lipids, and DNA. However, FLOP provides a better indication of cumulative oxidative damage than those that measure a single macromolecule.
In summary, this study indicates that oxidative stress is associated with CKD status and severity. Future studies are warranted to elucidate its role in the development and progression of CKD.
Acknowledgments
Support: This study was supported by a grant (P20-RR017659) from the National Center for Research Resources, National Institutes of Health, Bethesda, Maryland and partially supported by a Clinical and Translational Clinical Research Center grant from the Louisiana Board of Regents RC/EEP Fund.
Footnotes
Disclosure statement: The authors declare no conflict of interest.
References
- 1.Hemmelgarn BR, Manns BJ, Lloyd A, James MT, Klarenbach S, Quinn RR, Wiebe N, Tonelli M for the Alberta Kidney Disease Network. Relation between kidney function, proteinuria, and adverse outcomes. JAMA. 2010;303:423–429. doi: 10.1001/jama.2010.39. [DOI] [PubMed] [Google Scholar]
- 2.Schnabel R, Blankenberg S. Oxidative stress in cardiovascular disease: Successful translation from bench to bedside? Circulation. 2007;116:1338–1340. doi: 10.1161/CIRCULATIONAHA.107.728394. [DOI] [PubMed] [Google Scholar]
- 3.Papa S, Skulachev VP. Reactive oxygen species, mitochondria, apoptosis and aging. Mol Cell Biochem. 1997 Sep;174(1–2):305–19. [PubMed] [Google Scholar]
- 4.Marnett LJ, Riggins JN, West JD. Endogenous generation of reactive oxidants and electrophiles and their reactions with DNA and protein. J Clin Invest. 2003 Mar;111(5):583–93. doi: 10.1172/JCI18022. [DOI] [PMC free article] [PubMed] [Google Scholar]
- 5.Frankel EN. Lipid oxidation. Dundee, Scotland: The Oily Press Ltd; 1998. [Google Scholar]
- 6.Wu T, Rifai N, Roberts LJ, Willett WC, Rimm EB. Stability of measurements of biomarkers of oxidative stress in blood over 36 hours. Cancer Epidemiol Biomarkers Prev. 2004;13:1399–1402. [PubMed] [Google Scholar]
- 7.Wu T, Rifai N, Willett WC, Rimm EB. Plasma fluorescent oxidation products: Independent predictors of coronary heart disease in men. Am J Epidemiol. 2007;166:544–551. doi: 10.1093/aje/kwm120. [DOI] [PubMed] [Google Scholar]
- 8.Mezzetti A, Zuliani G, Romano F, Costantini F, Pierdomenico SD, Cuccurullo F, Fellin R the Associazione Medica Sabin. Vitamin E lipid peroxide plasma levels predict the risk of cardiovascular events in a group of healthy very old people. J Am Geriatr Soc. 2001 May;49(5):533–7. doi: 10.1046/j.1532-5415.2001.49110.x. [DOI] [PubMed] [Google Scholar]
- 9.Shimasaki H. Assay of fluorescent lipid peroxidation products. Methods Enzymol. 1994;233:338–46. doi: 10.1016/s0076-6879(94)33039-5. [DOI] [PubMed] [Google Scholar]
- 10.Levey AS, Coresh J, Greene T, Stevens LA, Zhang YL, Hendriksen S, Kusek JW, Van Lente F. Chronic Kidney Disease Epidemiology Collaboration: Using standardized serum creatinine values in the modification of diet in renal disease study equation for estimating glomerular filtration rate. Ann Intern Med. 2006 Aug 15;145(4):247–54. doi: 10.7326/0003-4819-145-4-200608150-00004. [DOI] [PubMed] [Google Scholar]
- 11.McGreevy KM, Lipsitz SR, Linder JA, Rimm E, Hoel DG. Using median regression to obtain adjusted estimates of central tendency for skewed laboratory and epidemiologic data. Clin Chem. 2009 Jan;55(1):165–9. doi: 10.1373/clinchem.2008.106260. [DOI] [PubMed] [Google Scholar]
- 12.Makita Z, Radoff S, Rayfield EJ, Yang Z, Skolnik E, Delaney V, Friedman EA, Cerami A, Vlassara H. Advanced glycosylation end products in patients with diabetic nephropathy. N Engl J Med. 1991 Sep 19;325(12):836–42. doi: 10.1056/NEJM199109193251202. [DOI] [PubMed] [Google Scholar]
- 13.Oberg BP, McMenamin E, Lucas FL, McMonagle E, Morrow J, Ikizler TA, Himmelfarb J. Increased prevalence of oxidant stress and inflammation in patients with moderate to severe chronic kidney disease. Kidney Int. 2004 Mar;65(3):1009–16. doi: 10.1111/j.1523-1755.2004.00465.x. [DOI] [PubMed] [Google Scholar]
- 14.Simmons EM, Langone A, Sezer MT, Vella JP, Recupero P, Morrow JD, Himmelfarb J. Effect of renal transplantation on biomarkers of inflammation and oxidative stress in end-stage renal disease patients. Transplantation. 2005 Apr 27;79(8):914–9. doi: 10.1097/01.tp.0000157773.96534.29. [DOI] [PubMed] [Google Scholar]
- 15.Okamura DM, Himmelfarb J. Tipping the redox balance of oxidative stress in fibrogenic pathways in chronic kidney disease. Pediatr Nephrol. 2009 Dec;24(12):2309–19. doi: 10.1007/s00467-009-1199-5. [DOI] [PubMed] [Google Scholar]
- 16.Zager RA, Burkhart K. Myoglobin toxicity in proximal human kidney cells: Roles of Fe, Ca2+, H2O2, and terminal mitochondrial electron transport. Kidney Int. 1997 Mar;51(3):728–38. doi: 10.1038/ki.1997.104. [DOI] [PubMed] [Google Scholar]
- 17.Himmelfarb J. Relevance of oxidative pathways in the pathophysiology of chronic kidney disease. Cardiol Clin. 2005 Aug;23(3):319–30. doi: 10.1016/j.ccl.2005.03.005. [DOI] [PubMed] [Google Scholar]
- 18.Cvetkovic T, Vlahovic P, Pavlovic D, Kocic G, Jevtovic T, Djordjevic VB. Low catalase activity in rats with ureteral ligation: Relation to lipid peroxidation. Exp Nephrol. 1998 Jan-Feb;6(1):74–7. doi: 10.1159/000020507. [DOI] [PubMed] [Google Scholar]
- 19.Zou AP, Li N, Cowley AW. Production and actions of superoxide in the renal medulla. Hypertension. 2001 Feb;37(2 Part 2):547–53. doi: 10.1161/01.hyp.37.2.547. [DOI] [PubMed] [Google Scholar]
- 20.Carlstrom M, Lai EY, Ma Z, Steege A, Patzak A, Eriksson UJ, Lundberg JO, Wilcox CS, Persson EG. Superoxide dismutase 1 limits renal microvascular remodeling and attenuates arteriole and blood pressure responses to angiotensin II via modulation of nitric oxide bioavailability. Hypertension. 2010 Nov;56(5):907–13. doi: 10.1161/HYPERTENSIONAHA.110.159301. [DOI] [PMC free article] [PubMed] [Google Scholar]
- 21.Just A, Olson AJ, Whitten CL, Arendshorst WJ. Superoxide mediates acute renal vasoconstriction produced by angiotensin II and catecholamines by a mechanism independent of nitric oxide. Am J Physiol Heart Circ Physiol. 2007 Jan;292(1):H83–92. doi: 10.1152/ajpheart.00715.2006. [DOI] [PubMed] [Google Scholar]
- 22.Cook NR, Albert CM, Gaziano JM, Zaharris E, MacFadyen J, Danielson E, Buring JE, Manson JE. A randomized factorial trial of vitamins C and E and beta carotene in the secondary prevention of cardiovascular events in women: Results from the women’s antioxidant cardiovascular study. Arch Intern Med. 2007 Aug 13–27;167(15):1610–8. doi: 10.1001/archinte.167.15.1610. [DOI] [PMC free article] [PubMed] [Google Scholar]
- 23.Boaz M, Smetana S, Weinstein T, Matas Z, Gafter U, Iaina A, Knecht A, Weissgarten Y, Brunner D, Fainaru M, Green MS. Secondary prevention with antioxidants of cardiovascular disease in endstage renal disease (SPACE): Randomised placebo-controlled trial. Lancet. 2000 Oct 7;356(9237):1213–8. doi: 10.1016/s0140-6736(00)02783-5. [DOI] [PubMed] [Google Scholar]
- 24.Tepel M, van der Giet M, Statz M, Jankowski J, Zidek W. The antioxidant acetylcysteine reduces cardiovascular events in patients with end-stage renal failure: A randomized, controlled trial. Circulation. 2003 Feb 25;107(7):992–5. doi: 10.1161/01.cir.0000050628.11305.30. [DOI] [PubMed] [Google Scholar]
- 25.Pergola PE, Raskin P, Toto RD, Meyer CJ, Huff JW, Grossman EB, Krauth M, Ruiz S, Audhya P, Christ-Schmidt H, Wittes J, Warnock DG for the BEAM Study Investigators. Bardoxolone methyl and kidney function in CKD with type 2 diabetes. N Engl J Med. 2011 Jul 28;365(4):327–36. doi: 10.1056/NEJMoa1105351. [DOI] [PubMed] [Google Scholar]