

Abstract
Interest is increasing in developing fluorescent ligands for characterization of adenosine receptors (ARs), which hold a promise of usefulness in the drug discovery process. The size of a strategically labeled AR ligand can be greatly increased after the attachment of a fluorophore. The choice of dye moiety (e.g. Alexa Fluor 488), attachment point and linker length can alter the selectivity and potency of the parent molecule. Fluorescent derivatives of adenosine agonists and antagonists (e.g. XAC and other heterocyclic antagonist scaffolds) have been synthesized and characterized pharmacologically. Some are useful AR probes for flow cytometry, fluorescence correlation spectroscopy, fluorescence microscopy, fluorescence polarization, fluorescence resonance energy transfer, and scanning confocal microscopy. Thus, the approach of fluorescent labeled GPCR ligands, including those for ARs, is a growing dynamic research field.
Keywords: purine, G protein-coupled receptor, fluorescence, membrane proteins, binding, screening
Fluorescent ligands have been used since the 60’s, however they have been used mainly as histological stains.1 The first report on fluorescent labeling with a selective small molecule ligand of a G protein-coupled receptor (GPCR) targeted the β-adrenergic receptors in 1976.2 In this case, an antagonist propranolol was conjugated to a 9-aminoacridine fluorophore to generate 9-AAP, which was then used to label β-receptors in rat cerebellum. Many other fluorescent GPCR ligands have followed. Thus, receptor-selective fluorescent ligands are useful tools for studying receptor physiology or pathophysiology on the cellular or even subcellular level. These fluorescent ligands provide a better understanding of receptor location, function and regulation.3,4 Moreover, when using fluorescent dyes with different spectral characteristics (multilabeling), receptor colocalization can be detected.5
Fluorescent ligands have been increasingly investigated for use in drug discovery to replace the radioligands, which have served as pharmacological tools for decades.6,7 Recently, the expense, health risks, and disposal issues that radioligands pose have increased the need to develop more efficient techniques. Fluorescent methods solve many of these issues associated with radioactivity, in addition to providing other advantages. Fluorescence allows the real-time visualization of the labeled receptor, and therefore dynamic changes like agonist-stimulated receptor internalization, endocytosis and recycling can be followed.8 Several fluorescent techniques are used in drug discovery, such as scanning confocal microscopy (SCM), fluorescence polarization (FP), fluorescence correlation spectroscopy (FCS), fluorescence resonance energy transfer (FRET) and flow cytometry (FCM).9,10 They allow the development of novel techniques using selective fluorescent ligands, which are comparable, and sometimes even superior, to the methods utilizing radioligands at the cellular or subcellular level.
There are three major design considerations for each target receptor, ligand class, and mode of use of the fluorescent conjugate: the choice of proper pharmacophore, fluorophore and the optimization of the linker length between them. A variety of wavelengths, molecular weights, polarity, charge, quantum yield, and stability of the fluorescent signal are available in chemically functionalized fluorescent dyes. The proper fluorophore requires suitable properties of fluorescence intensity, photobleaching and absorption and emission maxima for the fluorescence method chosen. In general, dyes with the lowest photobleaching rate and the highest fluorescence intensity are preferred. Nowadays, fluorophores with emission in the near infrared spectrum (NIR) are preferred, e.g. BODIPY 630/650 or Cy5, since their fluorescence emission can be clearly distinguished from the emission of the amino acids of living cells (autofluorescence). It is also preferred to choose dyes with high Stokes-shift (difference between the absorption and emission maxima), since the excitation light cannot interfere with the fluorescence emission giving false values. There are several other considerations, e.g. the membrane permeability (in whole cell assays) and the fluorescence lifetime (in FP) of the dye moiety. There is not a general dye useful in all fluorescent experiments, and therefore there is a need to develop alternative dyes. Additionally, a careful choice of the fluorophore for each type of experiment is indispensable. It is also essential to properly choose a pharmacophore that is potent, selective and functionalized for coupling with a linker. The length and chemical properties of this linker determine the position of the fluorophore when bound to the receptor. Moreover, the choice of dye moiety, attachment point and linker length can greatly alter the selectivity and potency of the parent pharmacophore moiety, even to the degree of reversing receptor subtype selectivity. Molecular modeling informed by the recent elucidation of GPCR X-ray structures is of increasing utility in both explaining empirical observations with new fluorescent ligands and in predicting a likely structural approach for the design of new fluorescent conjugates.
There are several comprehensive reviews about selective fluorescent ligands of different receptor families,11,12,13 including GPCRs,14,15 which are the largest single protein class of pharmaceutical targets. A protocol to study GPCR binding with fluorescent ligands in SCM studies and FCS experiments was reported by Briddon et al.16 In considering the growing number of published fluorescent ligands for each type of receptor, it is necessary to review each GPCR family and their related fluorescent ligands. Herein, this paper reviews the fluorescent ligands selectively designed for adenosine receptors (ARs).
ARs represent a pharmaceutically important class of GPCRs involved in nearly every physiological system in the body.17 The four subtypes include: A1 and A3 ARs, which inhibit production of adenosine cyclic 3',5'-monophosphate (cAMP), and A2A and A2B ARs, which stimulate the production of cAMP. Nearly all known AR agonists are nucleoside derivatives, and many classes of planar heterocycles, such as naturally occurring alkylxanthines, serve as AR antagonists.
First fluorescent AR ligands
The first examples of fluorescent AR ligands were compounds 1, 2, 37 and 38 (structures in Table 1 and Figure 1, receptor affinity in Table 2) synthesized by Jacobson et al. in 1987.18 Strategically functionalized congeners of known GPCR agonists and antagonists were explored as a general approach to molecular probes for the receptors.19 Among the amine derivatives designed as antagonist probes of the ARs, a xanthine amine congener (XAC) was devised by chain attachment of a 1,3-dialkylxanthine through a substituted 8-phenyl ring having an electron donating para-ether substituent. Agonist (N6-modified adenosines) and antagonist (C8-modified alkylxanthines) ligands with high affinities were coupled to chemically-reactive fluorescent dye derivatives (fluorescein isothiocyanate - FITC and 7-nitrobenzofurazan-4-yl - NBD) with retention, in some cases, of high A1AR affinity. This demonstrated the feasibility of using a tethering approach for AR fluorescent ligands. Conjugation of the functionalized congeners with biotin provided an additional strategy for receptor-labeling.20 A subsequent study focused on the A2AAR and revealed that a C2-modified adenosine derivative of FITC (FITC-APEC, 3) could be used as a tracer in binding experiments in bovine brain membranes from the striatal region high in A2AAR.21
Table 1.
Structures of fluorescent adenosine receptor (AR) ligands. In this table, the conjugates are structurally divided into three moieties to fulfill pharmacological, covalent linking, and fluorescent functions (see Figure 1 for structures of fluorophores and Table 2 for references).
| No. | Compound Namea | Pharmacophore | Linker | Fluorophore |
|---|---|---|---|---|
| 1 | FITC-ADAC | 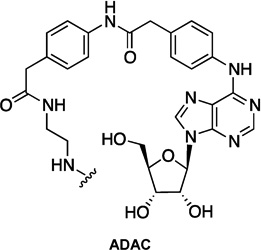 |
- | FITC |
| 2 | NBD-ADAC | NBD | ||
| 3 | FITC-APEC | 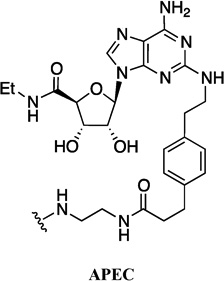 |
- | FITC |
| 4 | Alexa488- APEC (salt form) |
Alexa Fluor 488 5/6 mixed isomers |
||
| 5 | MRS5424 | Alexa Fluor 532 | ||
| 6 | Dansyl-NECA (n=3) |
 |
(CH2)3NH | Dansyl |
| 7 | Dansyl-NECA (n=4)b |
(CH2)4NH | ||
| 8 | Dansyl-NECA (n=6) |
(CH2)6NH | ||
| 9 | Dansyl-NECA (n=8) |
(CH2)8NH | ||
| 10 | Dansyl-NECA (n=10) |
(CH2)10NH | ||
| 11 | Dansyl-NECA (n=12) |
(CH2)12NH | ||
| 12 | ABEA-AO-dansyl (8) |
(CH2)4NHCO(CH2)7NH | ||
| 13 | AUEA-dansyl (10) | (CH2)11NH | ||
| 14 | NBD-NECA (n=2) | (CH2)2NH | NBD | |
| 15 | NBD-NECA (n=4) | (CH2)4NH | ||
| 16 | NBD-NECA (n=6) | (CH2)6NH | ||
| 17 | NBD-NECA (n=8) | (CH2)8NH | ||
| 18 | NBD-NECA (n=10) | (CH2)10NH | ||
| 19 | APrEA-X-BY630 | (CH2)3NH | Bodipy 630/650-X | |
| 20 | ABEA-X-BY630 | (CH2)4NH | ||
| 21 | APEA-X-BY630 | (CH2)5NH | ||
| 22 | AOEA-X-BY630 | (CH2)8NH | ||
| 23 | ADOEA-X-BY630 | ((CH2)2O)2(CH2)2NH | ||
| 24 | NECA-Bodipy- 630/650 (n=2) |
(CH2)2NH | Bodipy-630/650 | |
| 25 | NECA-Bodipy- 630/650 (n=3) |
(CH2)3NH | ||
| 26 | NECA-Bodipy- 630/650 (n=4) |
(CH2)4NH | ||
| 27 | NECA-Bodipy- 630/650 (n=8) |
(CH2)8NH | ||
| 28 | NECA-Bodipy- 630/650 (n=11) |
(CH2)11NH | ||
| 29 | NECA-Bodipy- 630/650 (PEG n=2) |
CH2(CH2OCH2)2CH2NH | ||
| 30 | NECA-Bodipy- 630/650 (PEG n=3) |
CH2(CH2OCH2)3CH2NH | ||
| 31 | ABEA-BYLF | (CH2)4NH | Bodipy FL | |
| 32 | ABEA-X-BYLF | (CH2)4NHCO(CH2)5NH | ||
| 33 | ABEA-X-Texas Red |
(CH2)4NH | Texas Red | |
| 34 | ABEA-Cy5 | Cy5 | ||
| 35 | ABEA-EVOBlue30 | EVOBlue 30 | ||
| 36 | ABA-X-BY630 | 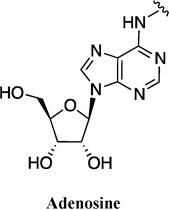 |
(CH2)4NH | Bodipy 630/650-X |
| 37 | FITC-XAC |  |
- | FITC |
| 38 | FITC-Gly3-XAC | CONHCH2 | ||
| 39 | XAC-X-BY630 | - | Bodipy 630/650-X | |
| 40 | XAC-X-Texas Red | - | Texas Red | |
| 41 | XAC-Cy5 | Cy5 | ||
| 42 | XAC-AEAO-BYFL | CO(CH2)6CONH(CH2)2NH | Bodipy FL | |
| 43 | XAC-EVOBlue30 | - | EVOBlue 30 | |
| 44 | XAC-Dansyl | Dansyl | ||
| 45 | XAC-AO-Dansyl | CO(CH2)7NH | ||
| 46 | XAC-AHH-Dansyl | CO(CH2)5NHCO(CH2)5NH | ||
| 47 | TQO-C8-X- BODIPY630 |
 |
CO(CH2)2CONH(CH2)8NH | Bodipy 630/650-X |
| 48 | TQO-PEG-X- BODIPY630 |
CO(CH2)2CONH((CH2)2O)2(CH2)2NH | ||
| 49 | TQO-PEG-X- BODIPY-TR |
Bodipy-TR | ||
| 50 | TQO-PEG-Cy5 | Cy5 | ||
| 51 | TQO-PEG-TAMRA | Tamra 5/6-X mixed isomers |
||
| 52 | TQO-extPEG- TAMRA |
5-Tamra-PEG | ||
| 53 | MRS5346 | 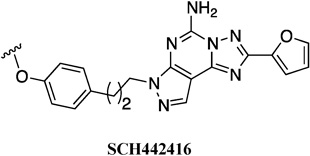 |
CH2CONH(CH2)2NH | Alexa Fluor 488 5-isomer |
| 54 | MRS5418 | CH2CONH((CH2)2NH)2 | Bodipy650/665-X | |
| 55 | MRS5347 | CH2CONH(CH2)2 | Tamra | |
| 56 | MRS5449 |  |
CO(CH2)3 | Alexa Fluor 488 azide 5-isomer |
| 57 | PTP-FITC (1) |  |
NH | FITC |
| 58 | PTP-FITC (2) | (CH2)3NH | ||
| 59 | PTP-FITC (3) | (CH2)4NH | ||
| 60 | PTP-FITC (4) | (CH2)5NH | ||
| 61 | PTP-FITC (5) | ((CH2)2O)2(CH2)2NH | ||
| 62 | PTP-FITC (6) | (CH2)3O((CH2)2O)2(CH2)3NH | ||
| 63 | MRS5218 | 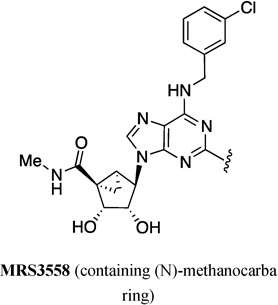 |
C≡C(CH2)2CONH(CH2)2NH | Cy5 |
| 64 | MRS5243 | C≡C(CH2)4 | Squaraine- Rotaxane |
|
| 65 | MRS5238 | C≡C(CH2)4 | Alexa Fluor 488 azide |
|
| 66 | MRS5704 | C≡C | 4-Pyrene | |
| 67 | MRS5783 | C≡C | 1-Pyrene | |
| 68 | MRS5421 |  |
||
| 69 | MRS5422 | |||
| 70 | MRS5397 | 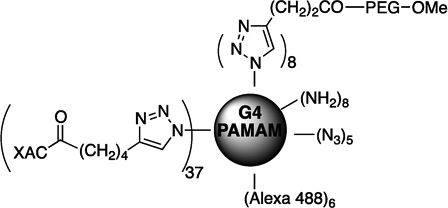 |
||
| 71 | MRS5399 | 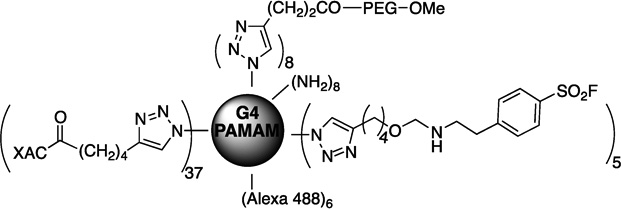 |
||
| 72 | MRS5303 |  |
||
abbreviations: ABA: N6-(aminobutyl)adenosine; ABEA: N6-(4-aminobutyl)-5′-ethylamino-5′-oxo-5′-deoxyadenosine; ADAC: adenosine amine congener; ADOEA: N6-(8-amino-3,6-dioxaoctyl)-5′-ethylamino-5′-oxo-5′-deoxyadenosine; AEAO: 8-(2-aminoethylamino)-8-oxooctanoyl; AHH: 6-(6-aminohexanamido)hexanoyl; AO: 8-aminooctanoyl; AOEA: N6-(8-aminooctyl)-5′-ethylamino-5′-oxo-5′-deoxyadenosine; APEA: N6-(5-aminopentyl)-5′-ethylamino-5′-oxo-5′-deoxyadenosine; APrEA: N6-(3-aminopropyl)-5′-ethylamino-5′-oxo-5′-deoxyadenosine; APEC: 2-[(2-aminoethylamino)carbonylethyl-phenylethylamino]-5′-ethylcarboxamidoadenosine; AUEA: N6-(11-aminoundecyl)-5′-ethylamino-5′-oxo-5′-deoxyadenosine; CGS15943: 9-chloro-2-(2-furanyl)-[1,2,4]triazolo[1,5-c]quinazolin-5-amine; (N)-methanocarba: [3.1.0]bicyclohexane; NECA: 5'-N-ethylcarboxamidoadenosine; PAMAM: polyamidoamine; PTP: pyrazolo[4,3-e][1,2,4]triazolo[1,5-c]pyrimidin-5-amine; QD: quantum dot; SCH442416: 2-(2-furanyl)-7-[3-(4-methoxyphenyl)propyl]-7H-pyrazolo[4,3-e][1,2,4]triazolo[1,5-c]pyrimidin-5-amine; TQO: [1,2,4]-triazolo[4,3-a]quinoxalin-1-one; TQZ: [1,2,4]-triazolo[1,5-c]quinazolin-5-amine; XAC: xanthine amine congener.
structure is same as ABEA-dansyl.36
Figure 1.

Structures of fluorophores. Abbreviations: FITC: fluorescein isothiocyanate; NBD: 7-nitrobenzofurazan-4-yl; NIR: near infrared.
Table 2.
Binding affinities of fluorescent AR ligands at different AR subtypes.
| Compound No. | A1 | A2A | A3 | Ref. |
|---|---|---|---|---|
|
-log (KD or Ki)a (or %inhibb) |
-log (KD or Ki)a (or %inhibb) |
-log (KD or Ki)a (or %inhibb) |
||
| 1 | 8.14c and 8.54d | [18] | ||
| 2 | 8.36c and 8.79d | [18] | ||
| 3 | 7.95e | [21] | ||
| 4 | NI | 6.82 | 6.61 | [35] |
| 6f | 7.37 | 5.36 | 5.74 | [22] |
| 7f | 7.15 | 5.02 | 5.69 | [22] |
| 8f | 7.56 | 5.36 | 5.44 | [22] |
| 9f | 6.95 | <5 | 6.59 | [22] |
| 10f | 6.63 | <5 | 5.95 | [22] |
| 11f | 5.46 | <5 | 5.60 | [22] |
| 12g | NI | [36] | ||
| 13g | 4.97 | [36] | ||
| 14 | <5 | 5.17 | 7.25 | [23] |
| 15 | <5 | <5 | 6.41 | [23] |
| 16 | <5 | 5.21 | 7.62 | [23] |
| 17 | 5.45 | 5.29 | 8.13 | [23] |
| 18 | 5.19 | 5.21 | 7.55 | [23] |
| 19g | 6.61 | [24] | ||
| 20g | 6.80 | [24] | ||
| 21g | 6.01 | [36] | ||
| 22g | 6.15 | [36] | ||
| 23g | 6.19 | [36] | ||
| 24h | 7.84 | [37] | ||
| 25h | 7.79 | [37] | ||
| 26h | 7.79 | [37] | ||
| 27h | 7.85 | [37] | ||
| 28h | 7.89 | [37] | ||
| 29h | 7.75 | [37] | ||
| 31g | NI | [36] | ||
| 34g | NI | [36] | ||
| 36g | 6.65 | [24] | ||
| 37 | 6.90c and 8.03d | [18] | ||
| 38 | 7.01c and 7.77d | [18] | ||
| 39g | 7.42 | [36] | ||
| 40g | 5.72 | [36] | ||
| 41g | 5.59 | [36] | ||
| 42g | NI | [36] | ||
| 43g | 5.27 | [36] | ||
| 44g | 6.71 | [36] | ||
| 45g | 6.91 | [36] | ||
| 46g | 6.87 | [36] | ||
| 47i | 7.78 | [38] | ||
| 48i | 6.56 | 9.36 | [38] | |
| 49i | 6.78 | 8.47 | [38] | |
| 50i | 6.83 | [38] | ||
| 51i | 7.53 | [38] | ||
| 52i | 8.25 | [38] | ||
| 53 | (20%) | 6.95 | (4%) | [41] |
| 54 | (58%) | 7.82 | (28%) | [41] |
| 55 | (7%) | 6.44 | (24%) | [41] |
| 56 | 7.06 | 7.13 | 8.19 | [6] |
| 57 | 5.02 | 6.03 | 6.10 | [6] |
| 58 | (5%) | 5.60 | 5.62 | [6] |
| 59 | (7%) | 6.33 | 6.14 | [6] |
| 60 | (9%) | 5.75 | 5.25 | [6] |
| 61 | (0%) | (30%) | 5.02 | [6] |
| 62 | (0%) | 5.22 | 5.14 | [6] |
| 63 | (36%) | 5.32 | 7.76 | [45] |
| 64 | (0%) | (2%) | 6.62 | [43] |
| 65 | (0%) | (23%) | 6.38 | [43] |
| 66 | (8%) | 5.50 | 7.16 | [44] |
| 67 | (11%) | (4%) | 6.18 | [44] |
| 68 | 8.16 | [48] | ||
| 69 | 8.43 | 7.69 | [48] | |
| 70 | 7.69 | 8.38 | 8.20 | [48] |
| 71 | 7.53 | 8.26 | 8.10 | [48] |
| 72 | 6.92 | [49] |
Potencies were measured at human (h) ARs, unless noted.
NI: no inhibition at concentrations up to 0.1 mM.
Ki values were measured in competition radioligand binding assays conducted on membrane preparations.
percent inhibition at 10 µM.
measured in rat brain.
measured in bovine brain.
measured in bovine striatal membranes.
measured in rat cerebral cortex, striatal, and testis membrane preparations on A1, A2A and A3AR, respectively.
KD values were determined in competition radioligand binding assays conducted on whole cells using [3H]DPCPX.
KD refers to the antagonist dissociation constant of XAC and the values were obtained in CHO-A1-SPAP cells from the antagonism of the SPAP responses to a range of different agonists in the presence of 3 mM of forskolin
KD values were measured by the shift of NECA-mediated inhibition of forskolin-stimulated CRE-SPAP responses.
Another early example of fluorescent AR ligands is from Macchia et al.22,23 In 1998, a series of fluorescent derivatives of the widely used potent AR agonist 5'-N-ethylcarboxamidoadenosine (NECA) were synthesized by the insertion of dansyl-aminoalkyl moieties to the N6-position with linear alkyl spacers of increasing carbon chain length (6–11).22 Compound 8 was used to visualize the A1AR in the rat cerebellar cortex by fluorescence microscopy (FM). However, the use of dansyl derivatives was limited due to the short excitation wavelength of the fluorophore (340 nm). To overcome this problem, five fluorescent derivatives were synthesized by the attachment of a fluorescent NBD moiety (excitation at 535 nm) to an AR agonist pharmacophore (14–18).23 The fluorescent derivatives showed high affinity toward hA3AR (Table 2). The most potent NBD derivative in the series 17 (500 nM, incubation for 120 min at 22 °C) was used to label A3ARs expressed in CHO cells (CHO-A3AR cells) using FM, and it selectively and specifically labeled the receptor on the membrane surface.
The above compounds 6–18 in the Macchia et al. study were the first examples of fluorescent AR ligands in which the choice of the fluorescent dye largely influenced the AR subtype selectivity.22,23 For example, the dansyl-derivatives (6–11) showed modest selectivity toward the A1AR, while the NBD ligands (14–18) were selective for the A3AR. This study also demonstrated a dependence of the AR potency on the length of the linker between the dye and the pharmacophore.
BODIPY 630/650-X derivative AR agonists
Middleton et al. added five red-emitting BODIPY 630/650-X labeled derivatives of adenosine and NECA to the growing list of fluorescent AR ligands (36, 19–22).24 BODIPY630/650 was chosen due to its high fluorescent intensity, low photobleaching rate and the fact that a relatively small amount of dye is in triplet state.25 "X" refers to an epsilon-aminocaproyl linker. Similarly to Macchia et al., a commercially available fluorescent dye was introduced at the N6-position through linkers of different lengths. In whole cell binding assays using the high affinity A1AR antagonist [3H]DPCPX, the binding affinities of 19, 20 and 36 were similar (pKD=6.61, 6.80 and 6.65, respectively) (Table 2). However, in [3H]cAMP accumulation assays these compounds displayed different potencies at the A1AR (pEC50=9.16, 8.47 and 8.29, respectively). ABEA-X-BY630 (20) displayed high potency at Gi-protein coupled A1AR and A3AR (pEC50=8.47 and 8.57, respectively) and lower potency at Gs-coupled A2AAR and A2BAR (pEC50=6.76 and 5.69, respectively). These results clearly demonstrated the dependence of functional potency on the linker structure, which was not evident in the binding affinity.
Compounds 36 and 19–22 were used to microscopically visualize ligand-receptor interactions.24 The binding of these fluorescent compounds was specific and restricted to the cell membrane of CHO-A1AR cells (100 nM, 5 min, 22 °C). Furthermore, co-localization assays were included, using CHO cells expressing an A1AR fused on its C-terminus to Topaz (Tpz) fluorescent protein (CHO-A1AR-Tpz cells). The authors showed that the intensity of fluorescent labeling was dependent on the linker length, with compounds 20 and 21 showing the highest and 22 showing the lowest levels of receptor binding (chains of 3, 4 and 8 atoms, respectively) in agreement with the affinity values.
It is clear that GPCRs, including ARs, are not uniformly distributed over the cell surface but are localized in membrane microdomains such as caveolae and lipid-rafts.26 The exact function of these domains is not clear yet, but they do have an important role in signaling, desensitization and intracellular trafficking. Middleton et al. used FCS,27 with positioning to the upper cell membrane to allow the differentiation and quantification of fast-diffusing fluorescent ligand from these receptor-ligand complexes with slower diffusion, on the single cell level. Labeling by ABEA-X-BY630 (20) was studied in a small area (~0.1 µm2) of the plasma membrane of CHO-A1AR cells.24 Two populations of agonist-receptor complexes were revealed to differ in their diffusion characteristics (40% in a faster and 60 % in a slower diffusing form with τD2= 9.5 ms and τD3=267 ms, respectively). The density of both complexes in the membrane was decreased in the presence of 100 nM DPCPX.
The binding of ABEA-X-BY630 (20) to the A3AR was characterized by Cordeaux et al.28 SCM studies were performed with recording of the membrane labeling by the BODIPY-derivative and simultaneous imaging of the subsequent increase in intracellular calcium (100 nM, 30 min, using Ca2+-indicator Fluo4). The A3AR was not uniformly distributed between individual cells, which further stressed the importance of performing single cell measurements. The nonfluorescent, selective A3AR antagonist MRS1220 (1 µM) blocked both ABEA-X-BY630 (20) binding and [Ca2+] transients. This confirmed the A3AR-mediated nature of the effects, while pertussis toxin (100 ng/ml) blocked only [Ca2+] transients, confirming the role of Gi proteins. Ligand binding was also quantified at the single cell level using FCS. Two agonist-occupied A3AR components were detected with differing diffusion characteristics (τD2=5.9 ms and τD3=131 ms). The majority of agonist-A3AR complexes (75%) existed in the slower diffusing form (τD3), which was inhibited by both antagonist MRS1220 and agonist NECA, while faster diffusing forms (τD2) were less affected by the agonist. Therefore, it was suggested, based on the cubic ternary complex model, that τD3 could reflect the agonist-R* complex (whereas R* represents activated conformation of the receptor), while τD2 could arise from the agonist-R complex (where R is the receptor in a resting conformation).28
Another fluorescent agonist synthesized by Middleton et al., ABA-X-BY630 (36), was used by Briddon et al. to visualize the A1AR by SCM (10–200 nM, 10 min, 22 °C) with clear concentration- and time-dependent membrane labeling.29 Compound 36 was used to quantify ligand binding to the A1AR with FCS to identify two slowly diffusing species (τD2= 8 ms and τD2= 233 ms) in addition to a fast moving free ligand. The two slower moving components represented two membrane-localized complexes of ABA-X-BY630 with the A1AR, since both were sensitive to the potent and somewhat selective A1AR antagonist DPCPX (100 nM). It was suggested that the slower moving species represent receptor diffusion within the membrane domain, and the fast-moving component possibly represents the movement of the membrane domain itself, in which the receptor resides.
Therefore, the fluorescent agonist ABA-X-BY630 (36) proved to be useful to better understand the kinetics of ligand-receptor complexes of A1ARs. Furthermore, May et al. showed that ABA-X-BY630 (36) can also be an effective tool to investigate more complex systems such as AR homodimers or allosteric interactions.30,31
The majority of the known ligands of the ARs mediate their action through the endogenous ligand binding site (orthosteric binding site), however ARs also contain topographically distinct binding sites (allosteric binding sites). Over the recent years, drug design targeting allosteric binding sites on GPCRs has gained momentum in drug discovery due to its numerous advantages including the magnification of the signaling profile of an endogenous agonist in a site-specific or event-specific manner. May et al. used ABA-X-BY630 (36) to study the effect of A1AR allosteric enhancer PD81,723 and A3AR allosteric inhibitor VUF5455 on agonist-AR interactions.30 CHO-A1AR and CHO-A3AR cells were exposed to ABA-X-BY630 (36) (30 nM), and the dissociation rates from A1AR and A3AR were measured after the fluorescent ligand was removed. Cells were perfused by HBSS in a custom-made, temperature-controlled perfusion system, in the presence or absence of PD81,723 or VUF5455, and the cell fluorescence by SCM was measured (37 °C). At the A1AR, the dissociation of ABA-X-BY630 (36) was significantly faster in the absence (koff= 1.95 min−1) compared with the presence of PD81,723 (koff=0.80 min−1) and VUF5455(koff=1.48 min−1). In contrast, rate of dissociation of ABA-X-BY630 (36) from A3AR was slower in the absence (koff=0.78 min−1) than in the presence of the allosteric inhibitors VUF5455 (koff=3.15 min−1) and PD81,723 (koff=2.46 min−1). An allosteric mechanism of action has previously not been identified for PD81,723 at the A3AR or VUF5455 at the A1AR. Furthermore, the marked enhancement in fluorescent agonist dissociation by VUF5455 in living cells contrasts previous observations from broken cell preparations and emphasizes the need to study the allosteric regulation of agonist binding in living cells.30
The same method was useful in investigating ligand binding at A3AR homodimers.31 Measurement of the dissociation kinetics of ABA-X-BY630 (36) from the A1AR and A3AR has provided evidence for allosteric interactions between the AR orthosteric binding sites across the dimeric interface of A3AR homodimers/oligomers. To distinguish interactions on the monomeric receptor from cooperative interactions resulting from receptor-receptor interactions, the authors used the coexpression of a nonbinding receptor variant (A3(N250)ARYFP) with the GFP-tagged native receptor (A3ARGFP). In contrast to the A1AR, highly cooperative interactions between competitive orthosteric ligands were observed at the A3ARs. At the A3AR, XAC, NECA and adenosine mediated a >9-fold enhancement in the dissociation rate of ABA-X-BY630 (36), which was inhibited by the presence of non-ligand binding A3AR mutant A3(N250)ARYFP. This result suggested that in CHO-A3AR cells, the observed allosteric interactions between ABA-XBY630 (36) and different AR agonists/antagonists are mediated across an A3AR homomeric complex.
BODIPY-630/650-X derivative AR antagonist: XAC-X-BY630
In addition to the above-mentioned agonists, a fluorescent antagonist, XAC-X-BY630 (39) was synthesized by Briddon et al. and was used for visualization and in FCS experiments on the A1AR 32. XAC 19 was conjugated through its chain-terminal amino group to a spacer and fluorescent group without losing the ability to bind potently at the ARs. To synthesize the fluorescent antagonist XAC-X-BY630 (39), the primary alkylamine of XAC was acylated with the succinimydyl ester BODIPY 630/650-X-SE, incorporating a six-atom linker between fluorophore and parent ligand. XAC-X-BY630 (39) was a competitive antagonist of A1AR-mediated inhibition of cAMP accumulation (pKb= 6.4) and stimulation of inositol phosphate accumulation (pKb=6.5). Both radioligand-binding and functional assays indicated a 10-fold lower affinity of XAC-X-BY630 (39) for A1AR than XAC itself. This is another example of the attachment of a bulky fluorophore altering the receptor binding properties of the AR ligands. Specific binding of the fluorescent antagonist to CHO-A1AR cell membrane was visualized using SCM with wild-type CHO-A1AR or CHO-A1AR-Tpz cells. FCS analysis of XAC-X-BY630 (39) binding to CHO-A1AR cells revealed three components (τD1=62 µs, τD2=17 ms and τD3=320 ms). τD1 represented the free fast-diffusing ligand, τD2 resulted from the diffusion of ligand-receptor complexes (since it was similar to the diffusion time observed for the fluorescent A1AR-Topaz fusion protein - 15 ms - and being that the number of receptor-ligand complexes was concentration-dependent and inhibited by DPCPX) and τD3 possibly corresponded to the nonspecific binding as it was insensitive to the A1AR antagonist DPCPX.32
XAC-X-BY630 (39) was also used to quantify antagonist-A3AR complexes by Corriden et al.33 Confocal imaging showed clear membrane labeling of CHO-A3ARYFP cells following incubation with the fluorescent antagonist 39 (25 nM, 10 min, 22°C), which was substantially reduced by the A3AR-selective antagonist MRS1220 (100 nM). FCS experiments using CHO-A3AR cells incubated with XAC-X-BY630 (39) (1–10 nM, 10 min, 22°C) revealed both fast-(τD2) and slow-moving (τD3) complexes at the cell membrane, with average diffusion coefficients of 1.58 µm2/s and 0.081 µm2/s, respectively. At concentrations of XAC-X-BY630 (39) ranging from 1–10 nM the amount of τD3, but not τD2, increased in a concentration-dependent manner. However, both species represent antagonist-receptor complexes, since the binding of both τD2 and τD3, following addition of XAC-X-BY630 (32), was significantly reduced when cells were pre-incubated with A3AR antagonist MRS1220 (300 nM). This study showed that as with agonist-A3AR complexes, antagonist-A3AR complexes exist in both fast- and slow-moving forms in the cell membrane.
Study of receptor internalization
In order to study agonist-induced changes of the A2AAR, Brand et al. coupled Alexa Fluor 488 dye to APEC34 and found that the product, conjugate 4, binds to the hA2AAR (Ki=149 nM) and hA3AR (Ki=240 nM) but not appreciably to hA1 and hA2B ARs (Table 2).35 Using Alexa488-APEC (4) and cyan fluorescent protein (CFP)- or FLAG-tagged A2AAR, the authors provided evidence that human A2AAR expressed in both CHO and HEK293 cells internalize upon agonist stimulation via clathrin-coated pit endocytosis promoting a localization of the receptor in Rab5-positive early endosomes (Figure 2). This was confirmed by the fact that hyperosmolaric sucrose (which blocks clathrin-coated vesicle formation) also blocked CFP-tagged A2AAR (A2A-CFP) uptake, and that A2A receptors were co-localized with clathrin and Rab5.
Figure 2.

- Living CHO cells transiently transfected with adenosine A2A-CFP receptors were observed using SCM 10–60 min post stimulation with Alexa488-APEC.
- The bar graph shows a quantification of HEK293 cells expressing a FLAG-A2A receptor showing predominantly cytosolic, membranous and cytosolic, or predominantly membranous receptor labeling. Three hundred cells per condition were manually counted.
- Alexa488-binding is abolished in the presence of 10 µM ZM 241,385.
- Agonist (2 µM NECA)-induced A2A-CFP receptor internalization is blocked in the presence of hyperosmolaric sucrose.
Study of the effects of the fluorophore and the linker on the pharmacological properties
The effects at the A1AR of linker length and the choice of the fluorophore were further studied by Baker et al.36 Various previously described or novel fluorescent derivatives of AR agonist NECA and AR antagonist XAC were modified with different length linkers to fluorescent dyes. The dyes used were boron-dipyrromethene (BODIPY) 630/650-X, Cy5, EVOBlue30, dansyl, BODIPY FL and Texas Red, which covered the entire visible spectra. It was evident that the addition of EVOBlue 30 (35, 43) and Cy5 (34, 41) to NECA or XAC, Texas Red to NECA (33), and BODIPY-FL to XAC (42) resulted in loss of affinity (determined in [3H]DPCPX whole cell binding assay). However, XAC-X-Texas Red (40) had a 30-fold lower binding affinity than XAC (logKD= −5.72) (Table 2), and BODIPY-FL derivatives of NECA (31, 32) also had reduced potency (logIC50=−6.03 and −6.57, respectively, determined in CRE-based reporter gene assay), but none of them were useful for membrane labeling in SCM experiments. The addition of the smaller dansyl fluorophore to the parent molecules NECA and XAC resulted in functionally active molecules with lower affinities (7, 12, 13, 44, 45, 46) (Table 2), but they were not suitable for SCM studies due to their weak fluorescence in aqueous solution. In contrast, the addition of BODIPY630/650-X fluorophore maintained the pharmacological properties of both the XAC and NECA (39, 19–22) (Table 2), and was also useful for membrane labeling using SCM. With the lengthening of the linker between the NECA and the BODIPY630/650-X fluorophore (19–22 n=3–8), the agonist efficacy of the molecule decreased. To further study this phenomenon, Dale et al synthesized seven new BODIPY630/650-derivatives of NECA with shorter linkers, missing the aminohexanoyl linker (“X”) and found enhanced potencies, with 25 as the most potent (n=3).37 In contrast, increasing the carbon chain between the dansyl moiety and the NECA from C4 to C11 (9, 12, 13) resulted in an increase in agonist potency of 10-fold (logIC50=−5.95, −6.64 and −7.08, respectively). The authors suggest that this observation may provide a clue to the orientation of the fluorophore within the receptor binding pocket, since both XAC-X-BY630 (39) and XAC-dansyl conjugates (7, 12, 13) show a marked quenching in aqueous medium. Based on this observation, the above-mentioned behavior could be explained as the BODIPY 630/650-X fluorophore is placed within the transmembrane lipid environment of the A1AR binding site without interfering with the agonist action even with shorter linkers, whereas the dansyl fluorophore may need to exit the binding pocket into the extracellular aqueous medium on a longer linker to avoid unfavorable interactions with the surrounding lipid environment. This study further stressed the fact that the pharmacological and spectral properties of newly synthesized fluorophore-tagged AR ligands need to be characterized carefully as there can be a marked difference compared to the parent AR ligand and fluorophore.
In a similar study, Vernall et al. recently introduced a series of fluorescent ligands containing different linkers and fluorophores and based on a [1,2,4]triazolo[4,3-a]quinoxalin-1-one (TQO) antagonist pharmacophore.38 All of these congeners and their respective fluorescent conjugates were able to antagonize NECA-mediated agonist responses at the human (h) A3AR. The conjugates with BODIPY630/650-X (48) and BODIPYTR-X (49) displayed the highest affinities (pKD 9.36 and 8.47, respectively) (Table 2). The binding affinities of the fluorescent derivatives varied 300-fold, further proving that both the fluorophore and the linker have a major influence on the pharmacology of the conjugate. A TQO scaffold was chosen because it was present in selective A3AR antagonists, and with modifications of the 4-amino group (i.e. attachment of bulky functional groups), the degree of subtype selectivity could be tuned.39,40 Compound 48 proved to be a highly potent (pKD=9.36) and selective competitive antagonist at the A3AR (>650-fold selective over A1 and A2B ARs) (Table 2). The authors suggested that the PEG-linker, in addition to the BODIPY-630/650-X dye, must be contributing in a favorable way to the binding affinity, which was significantly higher than the corresponding congener and the C8-linked BODIPY-630/650-X conjugate (47). The decrease in A3AR-affinity upon changing the fluorophore from BODIPY-630/650-X to Cy5 (50) or TAMRA (51), even with an extended PEG-linker (52), also supports this hypothesis. The BODIPY-630/650-X (48) and the BODIPY-TR-X (49) derivatives were able to label receptors in CHO-A3AR membranes, but not CHO-A1 cells under the same conditions, in a manner that was blocked by MRS1220 pretreatment. Compound 48 was also specifically co-localized with the A3AR in HEK293 cells expressing the A2BAR and sigSNAP-tagged A3AR.
Fluorescent AR ligands as tracers in ligand binding assays
As mentioned above, there is a compelling need to switch from radioactivity to fluorescence, not only in receptor pharmacology studies, but in ligand binding assays. In order to overcome this problem, two differing methods were recently introduced: one on membrane fragments7 and another on intact cells.6 Kecskès et al. used an Alexa Fluor 488-tagged A2AAR antagonist MRS5346 (53) in a newly developed ligand binding assay that uses fluorescence polarization (FP) with A2A-HEK293 cell membranes.7,41 The same study also reported a TAMRA derivative MRS5347 (55) and a BODIPY 650/665-X derivative MRS5418 (54) synthesized by Kumar et al.41 Conjugates 54 and 55 were designed for FM, and the structure was based on a pyrazolo[4,3-e][1,2,4]triazolo[1,5-c]pyrimidine-5-amine (PTP) scaffold that promotes high affinity and selectivity as antagonists for the A2AAR.41 MRS5346 (53) (20 nM) proved to be a suitable FP probe using HEK293-A2AAR membranes (150 µg/ml protein/ml).7 Based on association and dissociation kinetic parameters, a KD value of 16.5 nM was determined. Using 20 nM MRS5346 as a tracer, and similar conditions to those in a radioligand binding assay (60 min incubation at 30 °C), Ki values of known AR agonists and antagonists were determined in a competition binding assay (Figure 3A). There was a high correlation to the Ki values from radioligand binding, proving that fluorescent ligands are comparable to radioligands in binding assays (Table 3A).
Figure 3.

- Fluorescence binding assay using the Alexa Fluor 488-tagged A2AAR antagonist MRS5346 52 (20 nM) as a tracer, HEK-A2AAR membranes and FP (60 min incubation at 30 °C).
- FMC binding assay using potent and selective fluorescent A3AR antagonist MRS5449 (5 nM) on intact CHO-A3AR cells (90 min incubation at 37 °C). Reproduced from Kozma et al. with permission.6 Antagonists showed similar binding affinity as determined in radioligand binding assay using cell membranes. However, agonists show altered affinity toward A3ARs on intact cells, which may be due to multiple agonist binding sites of the receptor.
Table 3.
Comparison of Ki values of known AR ligands determined using fluorescence binding assays. A. with Alexa Fluor 488-tagged A2AAR antagonist MRS5346 52 (20 nM) as a tracer (HEK-A2AAR membranes and FP, 60 min incubation at 30 °C. Reproduced from Kecskés et al. with permission.7 B. FMC binding assay using potent and selective fluorescent A3AR antagonist MRS5449 (5 nM) on intact CHO-A3AR cells (90 min incubation at 37 °C). Reproduced from Kozma et al. with permission.6 The values determined using a radioligand binding assay were generally in agreement.
| A. | ||
|---|---|---|
| Compound | Ki (nM) – FP | Ki (nM) – radioligand |
| Agonists | ||
| NECA | 21.2 ± 3.4 | 20 |
| CGS21680 | 27.3 ± 7.2 | 27 |
| CPA | 814 ± 170 | 794 |
| Cl-IB-MECA | 3720 ± 870 | 5360 |
| Antagonists | ||
| XAC | 3.7 ± 0.87 | 1 |
| SCH442416 | 11.1 ± 1.14 | 4.1 |
| SCH58261 | 1.9 ± 0.66 | 0.6 |
| ZM241385 | 1.3 ± 0.86 | 1.6 |
| Theophylline | 2030 ± 1790 | 1700 |
| Caffeine | 2480 ± 450 | 9560 |
| DPCPX | 630 ± 170 | 129 |
| B. | ||
|---|---|---|
| Compound | Ki (nM) – FCM | Ki (nM) – radioligand |
| Agonists | ||
| CPA | 1490±230 | 72 |
| CGS21680 | 1580±190 | 67 |
| Cl-IB-MECA | 27.7±6.3 | 1.4 |
| IB-MECA | 10.9±1.9 | 1.8 |
| NECA | 149±13 | 25 |
| Antagonists | ||
| DPCPX | 1320±60 | 3980 |
| ZM241385 | 300±27 | 743 |
| MRS1220 | 3.46±0.8 | 0.65 |
| PSB-10b | 9.54±2.2 | 0.441 |
| XAC | 19.9±1.8 | 13.8 |
| CGS15943 | 16.1±6.2 | 35 |
| Theophylline | 29,400±1400 | 22,300 |
In order to study ARs in their native environments, Kozma et al. recently introduced a ligand binding assay using FCM and intact CHO-A3AR cells, with the Alexa Fluor488-tagged A3AR antagonist MRS5449 (56).6 The fluorescence binding of 56 with a triazolo[1,5-c]quinazoline-5-yl)amine (TQZ) scaffold was compared to the fluorescein-conjugates having different, but shorter linkers (57–62) and a similar heterocyclic core consisting of PTP. In addition to having a higher radioligand binding affinity (Ki=6.4 nM) (Table 2), MRS5449 (56) displayed a brighter fluorescent signal in FCM experiments. MRS5449 (56) clearly labeled the receptor in CHO-A3AR cell membrane in FM experiments, which was blocked by the addition of MRS1220 (10 µM). An equilibrium binding constant (KD) determined in a saturation binding experiment (5.15 nM) was comparable to one determined in kinetic experiments (6.65 nM). MRS5449 (56, 5 nM) was used in competitive binding assays as a tracer to determine Ki values of known AR ligands, and the pharmacological parameters of antagonists, as expected, corresponded to those previously seen (Figure 3B, Table 3B). However, agonists behaved differently with intact cells, probably as a result of multiple agonist binding states of the A3AR dependent on guanine nucleotides. Also, a 90-min incubation at 37 °C was used with intact cells, in contrast to the radioligand binding or the FP method, which uses a 30 °C incubation on broken cell membranes.
Molecular modeling studies with both ligands (53 and 56) showed an extra functionality of the Alexa Fluor 488 dye in that it has stabilizing interactions with extracellular loops when bound to the receptor.6,41
Recently, Stoddart et al. introduced a live cell high-content screening assay that uses XAC-X-BY630 (39, CA200645, 25 nM) and confocal imaging plate reader to determine binding affinities of ligands on A1 and -A3ARs.42 To test if this method could distinguish small molecules with low affinity, they deconstructed a high-affinity A3AR antagonist into smaller fragments which were tested for their ability to displace CA200645 binding at concentrations of up to 10 mM. They also screened a library of low molecular weight fragments (“Rule of Three” Fragment Library (Maybridge, UK)), and identified a hit with submicromolar binding affinity (KD). This study demonstrated that high-throughput fragment screening can be carried out on living cells, and can be sensitive enough to determine low binding affinities on A3AR.
Other fluorescent AR agonists
It has been shown that the replacement of the conformationally flexible ribose tetrahydrofuryl group in adenosine with a rigid bicyclo[3.1.0]hexane (methanocarba) ring system in an isomeric form that enforces a North (N) envelope conformation, increases both the binding affinity and selectivity of adenosine derivatives as A3AR agonists. There are several examples of fluorescent labeling of these (N)-methanocarba adenosine 5’-ethyluronamide derivatives. This scaffold contains known A3AR-enhancing modifications, i.e., 2-(arylethynyl)adenine and N6-methyl or N6-(3-substituted-benzyl) and they are nanomolar full agonists of hA3AR and highly selective. MRS 5243 (64, squaraine-Rotaxane derivative, structure of fluorophore not disclosed) and MRS 5238 (65, Alexa Fluor 488 derivative) were synthesized by Tosh et al., and showed high selectivity but moderate affinity to the hA3AR (Ki=239 and 416 nM, respectively, Table 2).43 In a recent study, the same author introduced the pyrene derivatives MRS 5704 (66, 1-pyrene) and MRS5783 (67, 4-pyrene).44 It was notable, that the affinity of the pyrene adducts depended on the position of substitution (Ki=68.3 and 660 nM, respectively) (Table 2). The most potent fluorescent ligand in the (N)-methanocarba series A3AR agonists to date is MRS 5218 (63, Cy5 derivative) (Ki=17.2 nM),45 which also showed high selectivity towards the A3AR.
Recently, an Alexa Fluor 532-tagged A2AAR agonist (MRS5424, 5) was introduced as a FRET-probe.46 The authors investigated GPCR dimerization (association of A2AARs and D2 dopamine receptor) by the diminished FRET signal between 5 and the A2ARCFP construct by D2R with a bound agonist (quinpirole). Gollos and her co-workers also synthesized fluorescent AR ligands using functionalized BODIPY dyes with various functional groups (Br, I, NH2, SH, OH) attached via alkyl spacers of different lengths to the fluorophore and coupled with different alkyl spacer lengths to 2-thioadenosine47
Beyond the conventional fluorescent small molecules
In addition to the fluorescent small molecule ligands for studying ARs, GPCR ligand-dendrimer (GLiDe) conjugates, using potent AR antagonist XAC, were also tagged using Alexa Fluor 488 (70: MRS5397 and 71: MRS5399), near infrared (NIR) dye 700 (69: MRS5422) and NIR dye 800 (68: MRS5421).48 The AR antagonist XAC was appended with an alkyne group on an extended C8 substituent for coupling by Cu(I)-catalyzed click chemistry to azide-derivatized G4 (fourth-generation) polyamidoamine (PAMAM) dendrimers to form triazoles. The GLiDe conjugates have displayed different quantitative and qualitative pharmacological properties in comparison to those of the monomeric ligands. PAMAM dendrimer conjugates of AR agonists with fluroescent labeling were also reported.54
In contrast to the conventional commercially available fluorescent dyes, Das et al. used quantum dots (QDs) as covalently coupled fluorophores for the A2AAR antagonist CGS21680 (72: MRS5303).49 A Ki value of 118 nM was achieved, but it was necessary to place a polyanion (half-generation PAMAM dendrimer fragment) within the linker anchoring the pharmacophore.
Conclusions
In conclusion, there is an increasing interest in developing fluorescent AR ligands. In contrast to fluorescence-tagged proteins, the molecular weight of an AR ligand can be greatly increased after the attachment of a fluorescent dye. Therefore, in order to retain the selectivity and potency of the original ligand, there are several factors to take into account while designing them. This includes the choice of the parent molecule in addition to the careful choice of a fluorophore prior to the synthesis. It was shown that dyes (e.g. Alexa Fluor 488) can give extra functionality to the newly synthesized fluorescent molecule6 and can alter the selectivity profile of the parent molecule.22,23,38 Also, the proper linker length is essential in a new fluorescent AR ligand. There are several examples showing differences in affinity between fluorescent derivatives with short and long linkers, with a magnitude change of 10-fold or more.36,38
The fact that some of the above-mentioned fluorescent compounds are commercially available (e.g. derivatives of agonist NECA and antagonist XAC and even A2AAR and A3AR ligand binding assay kits using fluorescent derivatives of high affinity AR antagonists) clearly shows the importance of fluorescent AR ligand development.50,51,52,53 All these facts and developments prove to illustrate that this research field is dynamic and fulfills an important research need. These ligands promise to supplant the use of radioligands for drug screening and provide extra dimensions of probing receptors that simple competitive radioligands do not provide.
Acknowledgements
Support from the NIDDK Intramural Research program is acknowledged. EK thanks the Hungarian-American Enterprise Scholarship Foundation (HAESF) for financial support. The work coordinated by SM was carried out with financial support from the University of Padova, Italy, and the Italian Ministry for University and Research (MIUR), Rome, Italy.
Abbreviations
- AR
adenosine receptor
- cAMP
cyclic adenosine 3',5'-monophosphate
- CFP
cyan fluorescent protein
- CHO
Chinese hamster ovary
- DPCPX
8-cyclopentyl-1,3-dipropylxanthine
- FCM
flow cytometry
- FCS
fluorescence correlation spectroscopy
- FITC
fluorescein isothiocyanate
- FLAG
DYKDDDDK (octapeptide)
- FM
fluorescence microscopy
- FP
fluorescence polarization
- FRET
fluorescence resonance energy transfer
- GPCR
G protein-coupled receptor
- HBSS
Hank's buffered salt solution
- NECA
1-(6-amino-9H-purin-9-yl)-1-deoxy-N-ethyl-β-D-ribofuranuronamide
- NIR
near infrared
- MRS1220
N-[9-chloro-2-(2-furanyl)[1,2,4]triazolo[1,5-c]quinazolin-5-yl]benzeneacetamide
- NBD
7-nitrobenzofurazan-4-yl
- PAMAM
polyamidoamine
- PTP
pyrazolo[4,3-e][1,2,4]triazolo[1,5-c]pyrimidin-5-amine
- SCM
scanning confocal microscopy
- TQO
[1,2,4]triazolo[4,3-a]quinoxalin-1-one
- TQZ
[1,2,4]triazolo[1,5-c]quinazolin-5-amine
- XAC
8-[4-[[[[(2-aminoethyl)amino]carbonyl]methyl)oxy]phenyl]-1,3-dipropylxanthine
Footnotes
Publisher's Disclaimer: This is a PDF file of an unedited manuscript that has been accepted for publication. As a service to our customers we are providing this early version of the manuscript. The manuscript will undergo copyediting, typesetting, and review of the resulting proof before it is published in its final citable form. Please note that during the production process errors may be discovered which could affect the content, and all legal disclaimers that apply to the journal pertain.
References
- 1.Falck B, Hillarp NA, Thieme G, Torp AJ. Histochem. Cytochem. 1962;10:348. [Google Scholar]
- 2.Melamed E, Lahav M, Atlas D. Experientia. 1976;32:1387. doi: 10.1007/BF01937390. [DOI] [PubMed] [Google Scholar]
- 3.Mackenzie JF, Daly CJ, Pediani JD, McGrath JC. J. Pharmacol. Exp. Ther. 2000;294:434. [PubMed] [Google Scholar]
- 4.Baker JG, Adams LA, Salchow K, Mistry SN, Middleton RJ, Hill SJ, Kellam BJ. Med. Chem. 2011;54:6874. doi: 10.1021/jm2008562. [DOI] [PMC free article] [PubMed] [Google Scholar]
- 5.Rose RH, Briddon SJ, Hill SJ. Br. J. Pharmacol. 2012;165:1789. doi: 10.1111/j.1476-5381.2011.01640.x. [DOI] [PMC free article] [PubMed] [Google Scholar]
- 6.Kozma E, Santhosh TK, Federico S, Phan K, Balasubramanian R, Gao ZG, Paoletta S, Moro S, Spalluto G, Jacobson KA. Biochem. Pharmacol. 2012;83:1552. doi: 10.1016/j.bcp.2012.02.019. [DOI] [PMC free article] [PubMed] [Google Scholar]
- 7.Kecskés M, Kumar TS, Yoo L, Gao Z-G, Jacobson KA. Biochem. Pharmacol. 2010;80:506. doi: 10.1016/j.bcp.2010.04.027. [DOI] [PMC free article] [PubMed] [Google Scholar]
- 8.Gironacci MM, Adamo HP, Corradi G, Santos RA, Ortiz P, Carretero OA. Hypertension. 2011;58:176. doi: 10.1161/HYPERTENSIONAHA.111.173344. [DOI] [PMC free article] [PubMed] [Google Scholar]
- 9.Schwille P. Cell Biochem. Biophys. 2001;34:383. doi: 10.1385/CBB:34:3:383. [DOI] [PubMed] [Google Scholar]
- 10.Lea WA, Simeonov A. Expert Opin. Drug Discov. 2011;6:17. doi: 10.1517/17460441.2011.537322. [DOI] [PMC free article] [PubMed] [Google Scholar]
- 11.Baindur N, Triggle DJ. Drug Dev. Res. 1994;33:373. [Google Scholar]
- 12.Baindur N, Triggle DJ. Med. Res. Rev. 1994;14:591. doi: 10.1002/med.2610140603. [DOI] [PubMed] [Google Scholar]
- 13.Daly CJ, McGrath JC. Pharmacol. Ther. 2003;100:101. doi: 10.1016/j.pharmthera.2003.08.001. [DOI] [PubMed] [Google Scholar]
- 14.Middleton RJ, Kellam B. Curr. Opin. Chem. Biol. 2005;9:517. doi: 10.1016/j.cbpa.2005.08.016. [DOI] [PubMed] [Google Scholar]
- 15.Kuder K, Kiec-Kononowicz K. Curr. Med. Chem. 2008;15:2132. doi: 10.2174/092986708785747599. [DOI] [PubMed] [Google Scholar]
- 16.Briddon SJ, Kellam B, Hill SJ. Methods Mol. Biol. 2011;746:211. doi: 10.1007/978-1-61779-126-0_11. [DOI] [PubMed] [Google Scholar]
- 17.Fredholm BB, IJzerman AP, Jacobson KA, Linden J, Müller C. Pharmacol. Rev. 2011;63:1. doi: 10.1124/pr.110.003285. [DOI] [PMC free article] [PubMed] [Google Scholar]
- 18.Jacobson KA, Ukena D, Padgett W, Kirk KL, Daly JW. Biochem. Pharmacol. 1987;36:1697. doi: 10.1016/0006-2952(87)90056-6. [DOI] [PMC free article] [PubMed] [Google Scholar]
- 19.Jacobson KA. Bioconjugate Chem. 2009;20:1816. doi: 10.1021/bc9000596. [DOI] [PMC free article] [PubMed] [Google Scholar]
- 20.Jacobson KA. Methods Enzymol. 1990;184:668. doi: 10.1016/0076-6879(90)84333-c. [DOI] [PMC free article] [PubMed] [Google Scholar]
- 21.McCabe RT, Skolnick P, Jacobson KA. J. Fluoresc. 1992;2 doi: 10.1007/BF00865279. [DOI] [PMC free article] [PubMed] [Google Scholar]
- 22.Macchia M, Salvetti F, Barontini S, Calvani F, Gesi M, Hamdan M, Lucacchini A, Pellegrini A, Soldani P, Martini C. Bioorg. Med. Chem. Lett. 1998;8:3223. doi: 10.1016/s0960-894x(98)00582-4. [DOI] [PubMed] [Google Scholar]
- 23.Macchia M, Salvetti F, Bertini S, Di Bussolo V, Gattuso L, Gesi M, Hamdan M, Klotz KN, Laragione T, Lucacchini A, Minutolo F, Nencetti S, Papi C, Tuscano D, Martini C. Bioorg. Med. Chem. Lett. 2001;11:3023. doi: 10.1016/s0960-894x(01)00610-2. [DOI] [PubMed] [Google Scholar]
- 24.Middleton RJ, Briddon SJ, Cordeaux Y, Yates AS, Dale CL, George MW, Baker JG, Hill SJ, Kellam B. J Med. Chem. 2007;50:782. doi: 10.1021/jm061279i. [DOI] [PubMed] [Google Scholar]
- 25.Buschmann V, Weston KD, Sauer M. Bioconjugate Chem. 2003;14:195. doi: 10.1021/bc025600x. [DOI] [PubMed] [Google Scholar]
- 26.Gines S, Ciruela F, Burgueno J, Casado V, Canela EI, Mallol J, Lluis C, Franco R. Mol. Pharmacol. 2001;59:1314. [PubMed] [Google Scholar]
- 27.Pramanik A, Rigler R. In: Fluorescence Correlation Spectroscopy: Theory and Applications. Rigler R, Elson ES, editors. Heidelberg: Springer; 2001. pp. 101–129. [Google Scholar]
- 28.Cordeaux Y, Briddon SJ, Alexander SPH, Kellam B, Hill SJ. FASEB J. 2008;22:850. doi: 10.1096/fj.07-8180com. [DOI] [PubMed] [Google Scholar]
- 29.Briddon SJ, Middleton RJ, Yates AS, George MW, Kellam B, Hill SJ. Faraday Discuss. 2004;126:197. doi: 10.1039/b307407b. [DOI] [PubMed] [Google Scholar]
- 30.May LT, Self TJ, Briddon SJ, Hill SJ. Mol. Pharmacol. 2010;78:511. doi: 10.1124/mol.110.064493. [DOI] [PMC free article] [PubMed] [Google Scholar]
- 31.May LT, Bridge LJ, Stoddart LA, Briddon SJ, Hill SJ. FASEB J. 2011;25:3465. doi: 10.1096/fj.11-186296. [DOI] [PMC free article] [PubMed] [Google Scholar]
- 32.Briddon SJ, Middleton RJ, Cordeaux Y, Flavin FM, Weinstein JA, George MW, Kellam B, Hill SJ. Proc. Nat. Acad. Sci. USA. 2004;101:4673. doi: 10.1073/pnas.0400420101. [DOI] [PMC free article] [PubMed] [Google Scholar]
- 33.Corriden R, Stoddart L, Hill S, Briddon S. Abstract of Papers. London: British Pharmacological Society Winter Meeting; 2009. Abstract 086P. Proceedings of the British Pharmacological Society at http://www.pA2online.org/abstracts/Vol7Issue4abst086P.pdf. [Google Scholar]
- 34.Jacobson KA, Barrington WW, Pannell LK, Jarvis MF, Ji XD, Williams M, Hutchison AJ, Stiles GL. J. Mol. Recognit. 1989;2:170. doi: 10.1002/jmr.300020406. [DOI] [PMC free article] [PubMed] [Google Scholar]
- 35.Brand F, Klutz AM, Jacobson KA, Fredholm BB, Schulte G. Eur. J. Pharmacol. 2008;590:36. doi: 10.1016/j.ejphar.2008.05.036. [DOI] [PMC free article] [PubMed] [Google Scholar]
- 36.Baker JG, Middleton R, Adams L, May LT, Briddon SJ, Kellam B, Hill SJ. Br. J. Pharmacol. 2010;159:772. doi: 10.1111/j.1476-5381.2009.00488.x. [DOI] [PMC free article] [PubMed] [Google Scholar]
- 37.Dale CL, Hill SJ, Kellam B. Med. Chem. Commun. 2012;3:333–338. [Google Scholar]
- 38.Vernall AJ, Stoddart LA, Briddon SJ, Hill SJ, Kellam BJ. Med. Chem. 2012;55:1771. doi: 10.1021/jm201722y. [DOI] [PubMed] [Google Scholar]
- 39.Lenzi O, Colotta V, Catarzi D, Varano F, Cecchi L, Filacchioni G, Martini C, Trincavelli L, Lucacchini AJ. Med. Chem. 2000;43:1158. doi: 10.1021/jm991096e. [DOI] [PubMed] [Google Scholar]
- 40.Colotta V, Catarzi D, Varano F, Lenzi O, Filacchioni G, Martini C, Trincavelli L, Ciampi O, Traini C, Pugliese AM, Pedata F, Morizzo E, Moro S. Bioorg. Med. Chem. 2008;16:6086. doi: 10.1016/j.bmc.2008.04.039. [DOI] [PubMed] [Google Scholar]
- 41.Santhosh TK, Mishra S, Deflorian F, Yoo LS, Phan K, Kecskés M, Szabo A, Shinkre B, Gao ZG, Trenkle W, Jacobson KA. Bioorg. Med. Chem. Lett. 2011;21:2740. doi: 10.1016/j.bmcl.2010.11.082. [DOI] [PMC free article] [PubMed] [Google Scholar]
- 42.Stoddart LA, Vernall AJ, Denman JL, Briddon SJ, Kellam B, Hill SJ. Chem. Biol. 2012;19:1105–1115. doi: 10.1016/j.chembiol.2012.07.014. [DOI] [PMC free article] [PubMed] [Google Scholar]
- 43.Tosh DK, Chinn M, Yoo LS, Kang DW, Luecke H, Gao ZG, Jacobson KA. Bioorg. Med. Chem. 2010;18:508. doi: 10.1016/j.bmc.2009.12.018. [DOI] [PMC free article] [PubMed] [Google Scholar]
- 44.Tosh DK, Deflorian F, Phan K, Gao ZG, Wan TC, Gizewski E, Auchampach JA, Jacobson KA. J. Med. Chem. 2012;55:4847. doi: 10.1021/jm300396n. [DOI] [PMC free article] [PubMed] [Google Scholar]
- 45.Tosh DK, Chinn M, Ivanov AA, Klutz AM, Gao ZG, Jacobson KA. J. Med. Chem. 2009;52:7580. doi: 10.1021/jm900426g. [DOI] [PMC free article] [PubMed] [Google Scholar]
- 46.Fernàndez-Dueñas V, Gòmez-Soler M, Jacobson KA, Kumar ST, Fuxe K, Borroto-Escuela DO, Ciruela FJ. Neurochem. 2012;23:373. doi: 10.1111/j.1471-4159.2012.07956.x. [DOI] [PMC free article] [PubMed] [Google Scholar]
- 47.Gollos S, El-Tayeb A, Heisig F, Behrenswerth A, Freudenthal SJ, Müller C. Purinergic Signal. 2012;8:142. [Google Scholar]
- 48.Kecskés A, Tosh DK, Wei Q, Gao ZG, Jacobson KA. Bioconjugate Chem. 2011;22:1115. doi: 10.1021/bc1005812. [DOI] [PMC free article] [PubMed] [Google Scholar]
- 49.Das A, Sanjayan GJ, Kecskés M, Yoo L, Gao Z-G, Jacobson KA. J. Nanobiotechnology. 2010;8:11. doi: 10.1186/1477-3155-8-11. [DOI] [PMC free article] [PubMed] [Google Scholar]
- 50. http://www.cellaura.com/product/index.html.
- 51. http://www.htrf.com/adenosine-a3-receptor-ligand-binding-assay.
- 52. http://www.htrf.com/china/adenosine-a2a-receptor-ligand-binding-assay.
- 53. available from hppt://nimh-repository.rti.org.
- 54.Klutz AM, Gao ZG, Lloyd J, Shainberg A, Jacobson KA. Enhanced A3 adenosine receptor selectivity of multivalent nucleoside-dendrimer conjugates. J. Nanobiotechnol. 2008;6:12. doi: 10.1186/1477-3155-6-12. [DOI] [PMC free article] [PubMed] [Google Scholar]