To the Editors:
Google’s search engine (Google Inc, Mountain View, CA; http://www.google.com) has emerged as a ubiquitous tool of Internet users. In 2009, Google commanded a 65% share of the roughly 130 billion online searches performed in the United States.1 The website Google Flu Trends monitors search data of flurelated terms to localize outbreaks 7–10 days earlier than traditional systems.2, 3 Other infectious disease diagnoses, such as avian influenza and West Nile virus, have demonstrated high correlation with Google search volume.2, 3 In August 2008, Google introduced Insights for Search (http://www.google.com/insights/search), which provides normalized, relative search volume for selected terms over specific time ranges and geographic regions. We hypothesized that chronic noninfectious diseases with known variations in seasonal incidence (such as diabetes mellitus, blood pressure, myocardial infarction, and nephrolithiasis) would show seasonal variations in number of searches.
On February 10, 2010, we queried Google Insights for Search with the following terms: “diabetes,” “high blood pressure + hypertension,” “low blood pressure + hypotension,” “heart attack + myocardial infarction,” and “kidney stones.” A new query was generated for each set of terms, and restricted to searches done in the United States from February 2005 to January 2010. This produced 261 weeks of normalized search volume, which we divided into monthly intervals. Values greater than 3 standard deviations from the mean were excluded because they were likely driven by a nonmedical search (eg, “heart attack” after Michael Jackson’s June 2009 death). Google Insights for Search provides the probability that a random user searched for a particular term from a specific location and time. Output is normalized on a scale of 0–100 and does not provide absolute search volume. We used ANOVA to assess differences within the variables.
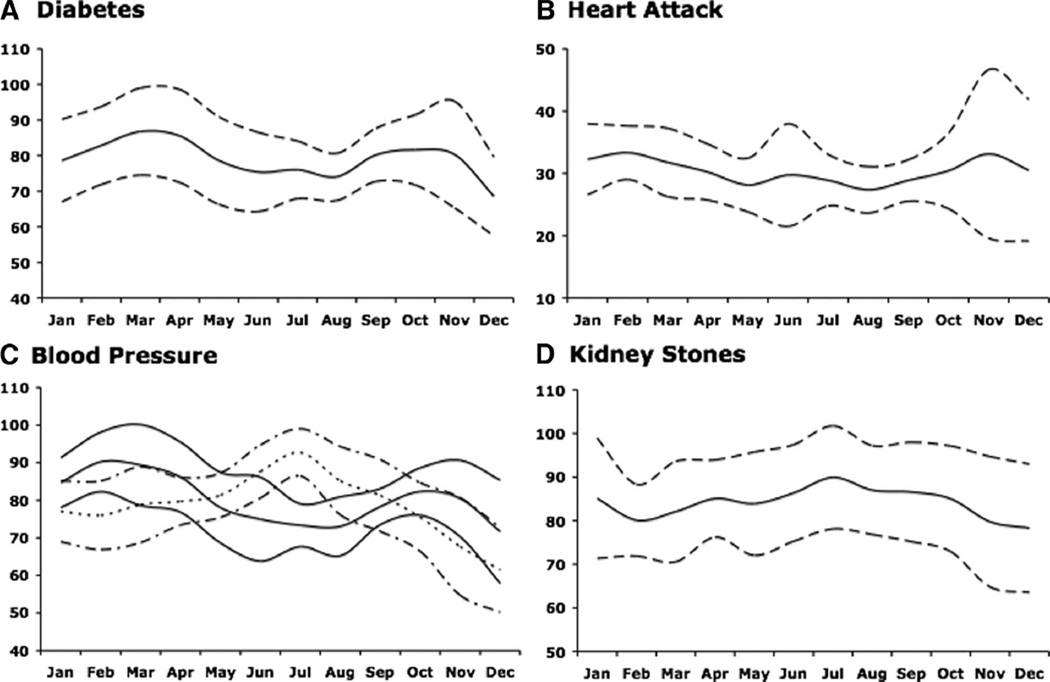
Of 1305 disease-weeks of data, 1300 were included for analysis. Each search term showed seasonal variation (Fig.). “Diabetes” had a sinusoidal pattern with a peak in March and a trough in August. “High blood pressure + hypertension” peaked during colder months, while “low blood pressure + hypotension” peaked in the summer. “Heart attack + myocardial infarction” peaked in the winter months and declined in the summer. “Kidney stones” peaked in the summer months. Each search term’s relative volume decreased in December, likely corresponding to increased online shopping during the holiday season.4
FIGURE.
Use of Google Insights for Search to monitor medical conditions with known seasonal variation in the United States from February 2005 to January 2010. A, Diabetes. B, Heart attack. C, High blood pressure (solid lines) and low blood pressure (dashed lines). D, Kidney stones. The y-axis represents relative search volume and the x-axis represents the cumulative monthly totals.
We searched a readily available, public-use Web site that processes millions of individual health-related searches to derive an ecologic surrogate of disease burden. The technology has been applied to infectious diseases,2 but to our knowledge has not been used to track other conditions. Each disease we studied showed a plausible seasonal variation. Diabetes incidence and hemoglobin A1c levels are known to peak in March, potentially relating to the inactivity of winter.5 The mechanism for blood pressure elevation in winter is uncertain, but has been hypothesized to involve cold-weather sympathetic-nervous-system activation, catecholamine release, and increased peripheral vascular resistance.6 This may also contribute to the increased cardiovascular morbidity seen in winter months.7 Nephrolithiasis is thought to be more common in summer due to elevated temperatures, dehydration, and increased sun exposure.8
Google Insights for Search provides robust, immediate, and free temporal and geographic data from billions of search queries. It is most effective in areas with widespread Internet use. Online search volume can provide useful information for epidemiologic study and medical research.
REFERENCES
- 1. [Accessed March 7, 2010];Monthly U.S. Search Engine Rankings. 2009 Available at: http://www.comscore.com/Press_Events/Press_Releases?year=1218&keywords=&location=0&searchBtn=Search.
- 2.Carneiro HA, Mylonakis E. Google trends: a web-based tool for real-time surveillance of disease outbreaks. Clin Infect Dis. 2009;49:1557–1564. doi: 10.1086/630200. [DOI] [PubMed] [Google Scholar]
- 3.Ginsberg J, Mohebbi MH, Patel RS, Brammer L, Smolinski MS, Brilliant L. Detecting influenza epidemics using search engine query data. Nature. 2009;457:1012–1014. doi: 10.1038/nature07634. [DOI] [PubMed] [Google Scholar]
- 4. [Accessed March 7, 2010];The 2009 U.S. digital year in review: a recap of the year in digital marketing. 2010 Available at: http://www.comscore.com/digital09.
- 5.Tseng CL, Brimacombe M, Xie M, et al. Seasonal patterns in monthly hemoglobin A1c values. Am J Epidemiol. 2005;161:565–574. doi: 10.1093/aje/kwi071. [DOI] [PubMed] [Google Scholar]
- 6.Alperovitch A, Lacombe JM, Hanon O, et al. Relationship between blood pressure and outdoor temperature in a large sample of elderly individuals: the Three-City study. Arch Intern Med. 2009;169:75–80. doi: 10.1001/archinternmed.2008.512. [DOI] [PubMed] [Google Scholar]
- 7.Manfredini R, Manfredini F, Boari B, et al. Seasonal and weekly patterns of hospital admissions for nonfatal and fatal myocardial infarction. Am J Emerg Med. 2009;27:1097–1103. doi: 10.1016/j.ajem.2008.08.009. [DOI] [PubMed] [Google Scholar]
- 8.Soucie JM, Coates RJ, McClellan W, Austin H, Thun M. Relation between geographic variability in kidney stones prevalence and risk factors for stones. Am J Epidemiol. 1996;143:487–495. doi: 10.1093/oxfordjournals.aje.a008769. [DOI] [PubMed] [Google Scholar]


