Abstract

We map the complete plasmonic spectrum of silver nanodisks by electron energy loss spectroscopy and show that the mode which couples strongest to the electron beam has radial symmetry with no net dipole moment. Therefore, this mode does not couple to light and has escaped from observation in optical experiments. This radial breathing mode has the character of an extended two-dimensional surface plasmon with a wavenumber determined by the circular disk confinement. Its strong near fields can impact the hybridization in coupled plasmonic nanoparticles as well as couplings with nearby quantum emitters.
Keywords: Plasmonics, nanoparticles, nanodisk, electron beam lithography, electron energy loss spectroscopy, breathing mode
Surface plasmons are collective electron oscillations at the interface of a metal and a dielectric that are coupled to an evanescent optical field. In metal nanostructures, these fields are resonantly enhanced and confined to nanoscale volumes.1,2 This makes plasmonic modes attractive building blocks for introducing nanoscale light management to nano and quantum optics and for applications as novel light sources,3 photovoltaics,4 and sensor devices.5,6 The spatial and spectral characteristics of plasmon modes can be tailored by shaping the structure geometry. For example, when morphing a spherical into an ellipsoidal particle, the lifting of the resonance degeneracy gives rise to three respectively blue- and red-shifted resonances along the three main axes. Combining mutually close nanoparticles can split the resonances further by plasmon hybridization and generates strongly confined fields in the gaps between the particles.7 The spectral properties of plasmonic modes were extensively investigated by optical spectroscopy, in particular on the single particle level by scattered light detection.8 Besides radiative modes, so-called dark modes, that is, excitations with low or zero net dipole moment, were identified via Fano resonances.9 The spatial field profile was imaged with near field optical microscopy10 and, more recently with cathodoluminescence, photo electron emission, and electron energy loss spectroscopy (EELS) in combination with transmission electron microscopy.11 This enabled the high-resolution imaging of the plasmon modes of triangular nanoparticles,11 nanorods,12−14 and nanocubes15 and to probe quantum effects in nanospheres.16 In EELS experiments dark multipolar plasmon modes in particle ensembles as dimers, trimers, and more complex structures were directly imaged.17,18
In the following we map the complete plasmonic mode spectrum of a single nanodisk, which constitutes a standard geometry for lithographically fabricated plasmonic systems. Despite its geometric simplicity, this system exhibits a surprisingly rich spectrum with a variety of clearly resolved peaks. Besides the well-known dipole and multipolar plasmon modes (which are dark for sufficiently small particles), we reveal additional dark modes, termed “breathing modes” due to their symmetric charge distribution. We show that within the full modal spectrum of the nanodisk the breathing modes couple strongest to the electron beam.
We fabricated silver nanodisks, 200 nm in diameter and 30 nm high, by electron beam lithography in a RAITH e-line system with a poly(methylmetacrylate) resist on 30 nm thick silicon nitride membranes.19 Due to its bandgap of about 5 eV this substrate enables the direct study of plasmonic excitations without additional signal from the supporting film in the visible up to the UV range. Electron energy loss (EEL) measurements were performed in a scanning transmission electron microscope (FEI Tecnai F20) with a monochromated 200 keV electron probe of 0.12 eV energy width (full-width-at-half-maximum). Transmitted electrons were collected within a semiangle of 9.19 mrad, and loss spectra were acquired at each pixel (size 5.6 nm) within an area of 257 × 207 nm with an exposure time of 0.2 s. EEL spectra were measured with a High Resolution Gatan Imaging Filter equipped with CCD camera of 2048 × 2048 pixels and an energy dispersion of 0.01 eV/channel (Supporting Information).20 For comparison with theory we performed simulations with the MNPBEM toolbox21 that relies on the boundary element method approach.22
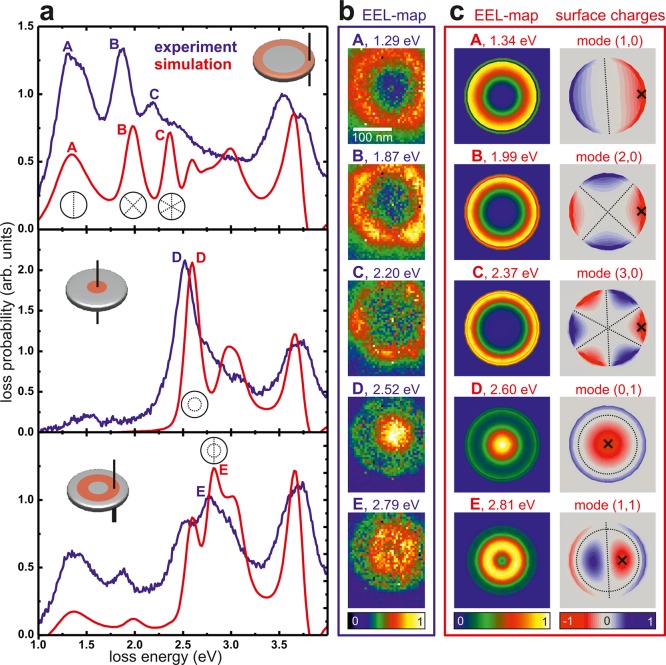
The experimental EEL spectra are plotted by the blue curves in Figure 1a. Taking advantage of the high spatial resolution of the electron microscope we measure the EEL for specific positions on the nanodisks, starting in the top panel with a beam position close to the disk edge. For improved signal-to-noise ratio, all spectra acquired along the disk circumference were integrated, as indicated by the red ring in the image inset. We observe a series of distinct loss peaks that agree well with the calculated EEL spectrum (red curve) assuming an electron beam position within the ring area and considering the experimental spectral resolution. We note that the slight differences in measured and simulated mode peak energies might arise due to deviations between modeled and actual values of the disk geometry and the used dielectric function of silver.23 The EEL maps in Figure 1b were extracted from the measured data set by applying an energy window of Epeak ± 0.05 eV, where Epeak is the maximum energy of the mode peaks in the spectra. For the modes A to C we observe the maximum energy loss close to the disk edge, with a stronger confinement for higher energy peaks. This corresponds to a strong localization of the plasmonic density of states projected in the direction of the electron trajectory, that is, perpendicular to the substrate.24,25 The calculated EEL maps in Figure 1c agree well with the experimental results. To correctly assign the observed mode patterns, we simulate the charge distribution in the nanodisk for each peak energy, assuming a fixed position of the electron beam, as marked by the cross in the surface charge maps in Figure 1c. We find that the charge distributions for modes A, B, and C are those of a dipole, quadrupole, and hexapole, respectively. We note that the symmetry of the charge maps assuming one electron beam position is necessarily lost in the EEL maps where the beam is scanned over the sample, averaging thus all azimuthal orientations of the mode pattern.
Figure 1.
Full modal spectrum of a silver nanodisk with 200 nm diameter and 30 nm thickness on a 30 nm thick silicon nitride membrane. (a) Experimental (blue) and simulated (red) EEL spectra from the particle edge (top), center (middle), and the region around half radial distance (bottom), as indicated in red on the disk sketches. Letters A–E mark distinct loss peaks for comparison with the EEL maps in b and c. The dotted lines in the insets assigned to the loss peaks sketch the radial and circular node lines of the respective modes. The experimental spectra share the same (arbitrary) loss probability scale, as do the simulated spectra. (b) Experimental EEL maps (257 × 207 nm) for energy intervals Epeak ± 0.05 eV. (c) Simulated EEL maps (left) and simulated surface charge distributions (right) generated by assuming the electron beam positions marked by the cross.
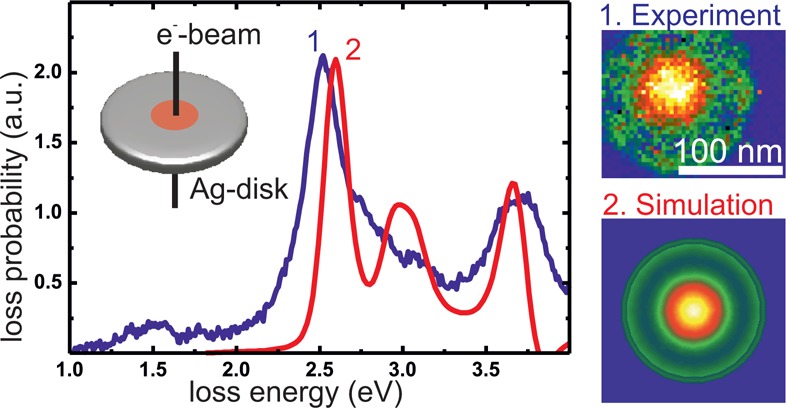
Considering the energy loss close to the disk center we observe another peak dominating the spectrum, labeled D in the middle panel in Figure 1a, again in very good agreement between experiment (blue) and simulation (red). Modes A–C are not observed here, as their mode density is zero in the middle of the disk where mode D is maximum, as illustrated by both the experimental (Figure 1b) and simulated (Figure 1c) EEL maps. The charge map reveals a maximum in the middle of the particle and a radially oscillating mode pattern with a circular node. This corresponds to a plasmonic breathing mode analogous to acoustic vibrations. As sketched in the charge map this mode is characterized by one circular node line and the absence of any radial node line characteristic for the multipoles discussed above. Accordingly we assign a mode index (0,1) to mode D, while dipole, quadrupole, and hexapole are described by (1,0), (2,0), and (3,0), respectively, as sketched in Figure 1c and the insets in Figure 1a. Remarkably, the breathing mode shows by far the highest loss signal and thus the largest mode density of all modes observed on the nanodisk. We interpret this finding as a direct consequence of the distinct breathing mode field pattern, showing a strong localization around the disk center. Positioning the electron beam at half the disk radius recovers partly the dipolar and quadrupolar modes but, more importantly, unveils another new mode E. The EEL maps and the charge pattern in Figure 1 make it clear that we deal with a (1,1) mode, akin of a combination of dipole and breathing mode. The charge pattern evolution as a function of energy for the different considered electron beam positions is available as movies in the Supporting Information.
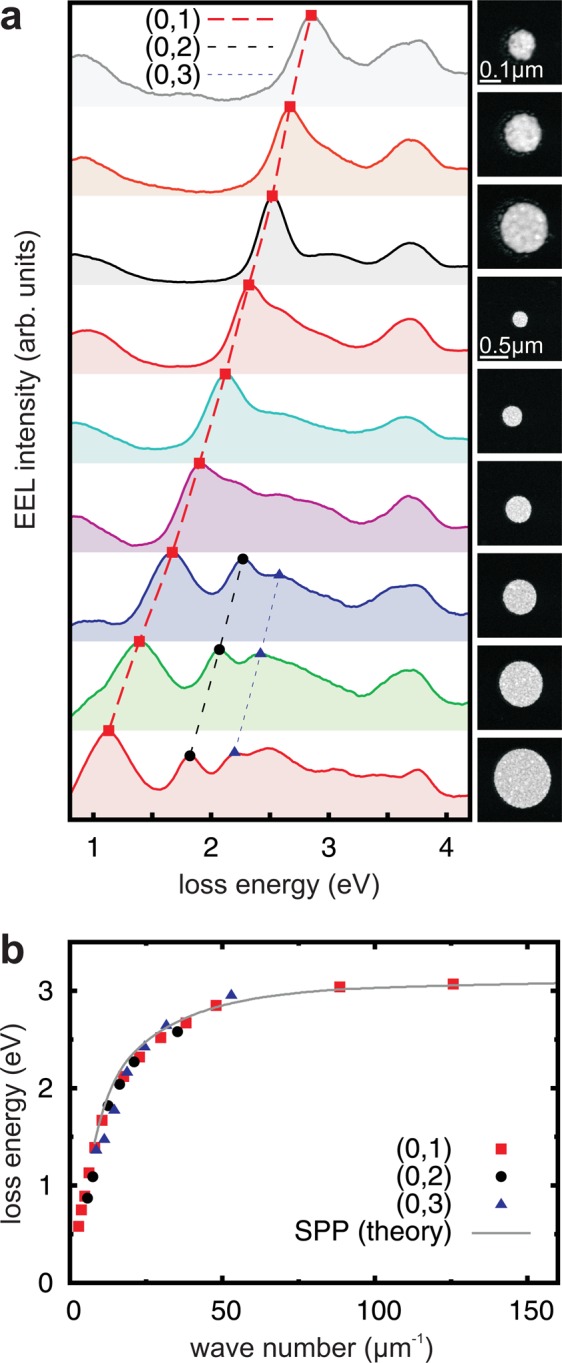
For a more detailed study of the breathing modes we fabricated nanodisks with diameters varying from 50 to 2200 nm, with a scaling factor of 1.3 between each particle size, and acquired EEL spectra from the disk centers (Figure 2a, not all spectra shown for sake of clarity). Additional peaks appear in the spectra of larger disks, allowing us to identify the higher order breathing modes (0,2) and (0,3), as sketched in the figure. We observe a monotonous shift of these mode peaks to higher energies for decreasing disk diameters. Motivated by the breathing mode pattern as illustrated in Figure 1 we describe these modes as standing plasmon waves due to the confinement of radially propagating plasmons by the disk edges. In this model the plasmon wavelength λSP matches the particle diameter d, as evident from the charge distribution along a disk diameter. Accordingly, we deduce a dispersion relation by plotting the frequency values ω (deduced from the peak positions in Figure 2a) as a function of the wavenumber kSP = 2nπ/λSP = 2nπ/d (n = 1, 2, ...)26 in Figure 2b. We find that the peaks of all three breathing modes collapse into a single curve that approaches asymptotically an energy of about 3 eV. This curve agrees perfectly well with the calculated dispersion of the antisymmetric surface plasmon mode of a 30 nm silver film on 30 nm silicon nitride (antisymmetric with respect to the surface parallel components of the magnetic field on the two sides of the silver film), as plotted by the solid line (Figure 2b; Supporting Information). This strongly corroborates our model of breathing modes as a distinct set of plasmonic excitations.
Figure 2.

Plasmonic breathing mode dispersion of silver nanodisks. (a) Experimental EEL spectra measured in the center of 30 nm thick silver discs with diameters between 130 to 1000 nm, as depicted in the electron microscope images to the right. The spectra were smoothed by averaging EEL counts over an energy-width of 0.1 eV. The dashed lines follow the spectral position of three breathing modes. (b) Dispersion relation of the breathing modes including data from 13 disks with diameters from 50 to 2200 nm. The loss energy is derived from the measured peak energies, the wavenumber k is obtained from the particle diameter d via k = 2nπ/d (n = 1, 2, 3). The line plots the calculated surface plasmon dispersion at the silver/silicon nitride interface of a 30 nm silver/30 nm silicon nitride multilayer.
In addition, we observe in all spectra a peak at 3.7 eV corresponding to an energy loss homogeneously distributed on the particle that can be attributed to bulk plasmon excitation. Another peak spectrally close to the bulk plasmon was observed only in the edge region of the disk at about 3.6 eV (compare spectra in Figure 1a). This observation coincides with theoretical predictions of an edge mode,27 however, further investigations are needed for clarification.
In summary, we have applied EELS to fully characterize the plasmonic mode spectrum of silver nanodisks, revealing plasmonic breathing modes. These modes correspond to radially propagating surface plasmons on the disk/substrate interface with fields concentrated around the disk center. As optically dark excitations, breathing modes have escaped optical detection so far but show the strongest coupling to the electron beam within the whole mode spectrum. Their correspondingly strong near fields might impact plasmon hybridization and the coupling to nearby quantum emitters, so that the inclusion of breathing modes to achieve a correct description of the full modal spectrum of plasmonic nanodisks is important. This addresses, for example, plasmonic biosensor geometries where unaccounted dark modes can seriously jeopardize the radiative signal.
Acknowledgments
This work was supported by the Austria Science Fund (FWF) Project No. P21800-N20, Project No. P24511-N24, and the Graz Centre for Electron Microscopy (ZFE).
Supporting Information Available
Experimental procedures and annotations to the simulation of the surface charge distribution (including movies showing the spectral evolution) and to the numerical calculation of the surface plasmon dispersion relation. This material is available free of charge via the Internet at http://pubs.acs.org.
The authors declare no competing financial interest.
Supplementary Material
References
- Barnes W.; Dereux A.; Ebbesen T. Nature 2003, 424, 824–830. [DOI] [PubMed] [Google Scholar]
- Schuller J.; Barnard E.; Cai W.; Jun Y.; White J.; Brongersma M. Nat. Mater. 2010, 9, 193–204. [DOI] [PubMed] [Google Scholar]
- Okamoto K.; Niki I.; Shvartser A.; Narukawa Y.; Mukai T.; Scherer A. Nat. Mater. 2004, 3, 601–605. [DOI] [PubMed] [Google Scholar]
- Atwater H.; Polman A. Nat. Mater. 2010, 9, 205–213. [DOI] [PubMed] [Google Scholar]
- Lal S.; Link S.; Halas N. Nat. Photonics 2007, 1, 641–648. [Google Scholar]
- Anker J.; Hall W.; Lyandres O.; Shah N.; Zhao J.; Van Duyne R. Nat. Mater. 2008, 7, 442–453. [DOI] [PubMed] [Google Scholar]
- Prodan E.; Radloff C.; Halas N. J.; Nordlander P. Science 2003, 302, 419–422. [DOI] [PubMed] [Google Scholar]
- Sherry L.; Jin R.; Mirkin C.; Schatz G.; Van Duyne R. Nano Lett. 2006, 6, 2060–2065. [DOI] [PubMed] [Google Scholar]
- Verellen N.; Sonnefraud Y.; Sobhani H.; Hao F.; Moshchalkov V. V.; Dorpe P. V.; Nordlander P.; Maier S. A. Nano Lett. 2009, 9, 1663–1667. [DOI] [PubMed] [Google Scholar]
- Krenn J. R.; Dereux A.; Weeber J. C.; Bourillot E.; Lacroute Y.; Goudonnet J. P.; Schider G.; Gotschy W.; Leitner A.; Aussenegg F. R.; Girard C. Phys. Rev. Lett. 1999, 82, 2590–2593. [Google Scholar]
- Nelayah J.; Kociak M.; Stephan O.; Garcia de Abajo F. J.; Tence M.; Henrard L.; Taverna D.; Pastoriza-Santos I.; Liz-Marzan L. M.; Colliex C. Nat. Phys. 2007, 3, 348–353. [DOI] [PubMed] [Google Scholar]
- Schaffer B.; Hohenester U.; Trügler A.; Hofer F. Phys. Rev. B 2009, 79, 041401–041405. [Google Scholar]
- Rossouw D.; Couillard M.; Vickery J.; Kumacheva E.; Botton G. A. Nano Lett. 2011, 11, 1499–1504. [DOI] [PubMed] [Google Scholar]
- Nicoletti O.; Wubs M.; Mortensen N. A.; Sigle W.; van Aken P. A.; Midgley P. A. Opt. Express 2011, 19, 15371–15379. [DOI] [PubMed] [Google Scholar]
- Mazzucco S.; Geuquet N.; Ye J.; Stéphan O.; Van Roy W.; Van Dorpe P.; Henrard L.; Kociak M. Nano Lett. 2012, 12, 1288–1294. [DOI] [PubMed] [Google Scholar]
- Scholl J. A.; Koh A. L.; Dionne J. A. Nature 2012, 483, 421–427. [DOI] [PubMed] [Google Scholar]
- Chu M.-W.; Myroshnychenko V.; Chen C.; Deng J.-P.; Mou C.-Y.; de Abajo F. G. Nano Lett. 2009, 9, 399–404. [DOI] [PubMed] [Google Scholar]
- Koh A.; Fernández-Domnguez A.; McComb D.; Maier S.; Yang J. Nano Lett. 2011, 11, 1323–1330. [DOI] [PubMed] [Google Scholar]
- Koh A. L.; McComb D. W.; Maier S. A.; Low H. Y.; Yang J. K. W. J. Vac. Sci. Technol., B 2010, 28, C6O45–C6O49. [Google Scholar]
- Jeanguillaume C.; Colliex C. Ultramicroscopy 1989, 28, 252–257. [Google Scholar]
- Hohenester U.; Trügler A. Comput. Phys. Commun. 2012, 183, 370–381. [Google Scholar]
- Garcia de Abajo F. J.; Howie A. Phys. Rev. B 2002, 65, 115418–115435. [Google Scholar]
- Johnson P. B.; Christy R. W. Phys. Rev. B 1972, 6, 4370–4379. [Google Scholar]
- Garcia de Abajo F. J.; Kociak M. Phys. Rev. Lett. 2008, 100, 106804–106808. [DOI] [PubMed] [Google Scholar]
- Hohenester U.; Ditlbacher H.; Krenn J. R. Phys. Rev. Lett. 2009, 103, 106801–106805. [DOI] [PubMed] [Google Scholar]
- Schider G.; Krenn J. R.; Hohenau A.; Ditlbacher H.; Leitner A.; Aussenegg F. R.; Schaich W. L.; Puscasu I.; Monacelli B.; Boreman G. Phys. Rev. B 2003, 68, 155427–155431. [Google Scholar]
- Aizpurua J.; Rivacoba A.; Apell S. P. Phys. Rev. B 1996, 54, 2901–2909. [DOI] [PubMed] [Google Scholar]
Associated Data
This section collects any data citations, data availability statements, or supplementary materials included in this article.


