

Abstract
Microfluidic technology allows the manipulation of mass-limited samples and when used with cultured cells, enables control of the extracellular microenvironment, making it well suited for studying neurons and their response to environmental perturbations. While matrix-assisted laser desorption/ionization (MALDI) mass spectrometry (MS) provides for off-line coupling to microfluidic devices for characterizing small-volume extracellular releasates, performing quantitative studies with MALDI is challenging. Here we describe a label-free absolute quantitation approach for microfluidic devices. We optimize device fabrication to prevent analyte losses before measurement and then incorporate a substrate that collects the analytes as they flow through a collection channel. Following collection, the channel is interrogated using MS imaging. Rather than quantifying the sample present via MS peak height, the length of the channel containing appreciable analyte signal is used as a measure of analyte amount. A linear relationship between peptide amount and band length is suggested by modeling the adsorption process and this relationship is validated using two neuropeptides, acidic peptide (AP) and α-bag cell peptide [1-9] (αBCP). The variance of length measurement, defined as the ratio of standard error to mean value, is as low as 3% between devices. The limit of detection (LOD) of our system is 600 fmol for AP and 400 fmol for αBCP. Using appropriate calibrations, we determined that an individual Aplysia bag cell neuron secretes 0.15 ± 0.03 pmol of AP and 0.13 ± 0.06 pmol of αBCP after being stimulated with elevated KCl. This quantitation approach is robust, does not require labeling, and is well suited for miniaturized off-line characterization from microfluidic devices.
Introduction
Microfluidics has made significant contributions to analytical chemistry since the technology was first introduced.1,2 The small volumes of microfluidic devices enable handling of mass-limited samples with minimal reagent consumption, control of local microenvironments, and integration of multiple processing steps into a single system. Consequently, microfluidics has been extensively used to investigate low-amount analytes3-6 and to provide promising platforms that mimic in vivo environments for cell-based biological studies.7-9
One of the challenges in this field has been the integration of microfluidic devices with information-rich detection modalities. As a detection scheme, mass spectrometry (MS) can unambiguously identify multiple analytes simultaneously from a small-volume biological sample without prior preselection. In particular, matrix-assisted laser desorption/ionization (MALDI) MS offers several advantages, such as tolerance to salts and other contaminants and spectra that are easy to interpret, making it quite useful for proteomic and peptidomic studies, including investigations of nervous system tissues.10-12 Microfluidic systems can be readily interfaced with MALDI offline, either by depositing eluents from the device onto a MALDI target13 or by directly using a substrate as the target.14-16 With the development of MALDI MS imaging, spatial information can be added to the characterization process by allowing measurements of biomolecular distributions across samples.17,18 Previously, we demonstrated MALDI imaging from a poly(dimethylsiloxane) (PDMS) device comprised of a reservoir for accommodating cells and a derivatized surface for collecting secreted materials.19 Direct imaging of the surface revealed areas in the device containing both known and unknown analytes, without prior knowledge of their exact locations. Here, we adapt that earlier device to achieve improved accuracy and precision.
Although we are interested in obtaining qualitative information on the molecules present in a sample, it can also be important to know their quantity. However, MALDI is not considered quantitative because peak heights are not always directly related to the amount of analyte present.20 The reasons for the disconnect between peak heights and analyte amounts include uneven distributions of analytes within matrix crystals, varied ionization efficiencies that depend on the molecular structure and environment, and ion suppression effects, especially from complex mixtures.21,22 One solution is to use stable isotopic labeling, which overcomes several of the challenges of direct quantitation with MS.23,24 For absolute quantitation, an internal standard that incorporates a heavy isotope (e.g., 2H, 13C, 15N, or 18O) is added for each corresponding analyte and accurate measurements are done by comparing the intensity or area of paired peaks. For relative quantitation, peptides in two samples are differentially labeled with a distinguishable mass difference between two isotopic forms and are then combined for comparison. Stable isotopes can be incorporated into peptide molecules either through metabolic labeling25 or by attachment with isotopic tags.26 Owing to the development of a number of novel labeling schemes,24,27,28 significant progress has been made in quantitative MS; it has been applied in the analysis of various biomolecules,29-32 enabling measurement of contents from single cells.33 However, using stable isotopic labeling within microfluidic devices presents several challenges: labeling adds multiple steps to the sample preparation process, organic labeling reagents may not be compatible with PDMS and are toxic to live cells, and finally, the labeling reactions inevitably dilute the mass-limited samples. Therefore, a more amenable and simple quantitation strategy is needed for PDMS devices.
Here we modify an approach used in many diagnostic tests in which the length of color change along a strip is related to the amount of analyte. We combine this with off-line MALDI MS to demonstrate that the adsorption length in a microfluidic channel is proportional to analyte amount. Because the ability of a surface to adsorb an analyte is fixed per unit length, the larger the quantity of sample, the longer the section of channel it will cover. This approach is label-free. We have adapted our prior device for such measurements,19 improving its design and implementing a more controlled solution flow. Calibration curves obtained with multiple standards show the expected linear relationship between length and amount; a model of the adsorption process supports the linear nature of length-to-amount for multiple analytes. We demonstrate the ability to measure peptide release from a small number of Aplysia bag cell neurons, a well-characterized neurosecretory model,34,35 and are able to extract absolute quantitative information for the released peptides.
Experimental
Materials and reagents
Unless stated otherwise, organic solvents were from Fisher Scientific (Fair Lawn, NJ) and all the other chemicals from Sigma-Aldrich (St. Louis, MO). The PDMS prepolymer kit, Sylgard 184, was purchased from Dow Corning (Midland, MI). Silicon wafers were obtained from WRS Materials (Spring City, PA); 2-[methoxy(polyethyleneoxy)propyl]trimethoxysilane (OEG, 90%) was from Gelest, Inc. (Morrisville, PA) and used as received. Negative photoresist SU-8 2050 and developer were obtained from MicroChem Corp. (Newtown, MA). Positive photoresist AZ 5214-E and developer were from AZ Electronic Materials Corp. (Somerville, NJ). Acidic peptide (AP) was synthesized at the Roy J. Carver Biotechnology Center (University of Illinois at Urbana-Champaign). α-bag cell peptide [1-9] (αBCP, 80%) was purchased from American Peptide Company, Inc. (Sunnyvale, CA). Angiotensin II (Ang II), (5-L-Isoleucine) [tyrosyl-3,5-3H(N)] (specific activity = 50 Ci/mmol, concentration 1 mCi/mL) was from American Radiolabeled Chemicals, Inc. (Saint Louis, MO). Ultima Gold LLT liquid scintillation solution was purchased from Perkin Elmer. Filtered artificial sea water (ASW, pH 7.8) contained 460 mM NaCl, 10 mM KCl, 10 mM CaCl2, 22 mM MgCl2, 26 mM MgSO4, 2.5 mM NaHCO3, and 15 mM HEPES.
Substrate derivatization
A piece of silicon wafer was patterned with AZ 5214-E photoresist via standard photolithography so that about 2/3 of the bare silicon was exposed. The patterned substrate was dipped in a mixture of 15 mL chloroform and 35 mL hexane with octadecyltrichlorosilane (OTS, 0.8% v/v) for 10 min and then in hexane for 10 min, as modified from previous procedures.19,36 The chip was rinsed with acetone to remove the photoresist and dried at 70 °C for 3 h. The partially derivatized surface was immersed in 50 mL toluene containing OEG (0.8% v/v) overnight, followed by immersion in toluene for 1 h, rinsing with methanol, and drying at 70 °C for 2 h.37,38 Substrates were rinsed with methanol and water sequentially and dried with nitrogen directly before use.
Device fabrication
Microfluidic devices consisted of PDMS with channel features sealed onto derivatized silicon substrates. The PDMS pieces were formed by molding Sylgard 184 onto a photolithographically patterned SU-8 master. Small pieces of silicone tubing (Helix Medical, LLC, Carpinteria, CA) were glued onto SU-8 features that served as device outlets.39 The PDMS prepolymer was then poured onto the master and cured at 70 °C overnight. The inlet reservoir was made with an AcuPunch (Acuderm, Inc., Ft. Lauderdale, FL) biopsy punch of 1.5 mm diameter. To reduce sample loss to the PDMS material, the channels were sequentially treated with 5:1:1 H2O:HCl:H2O2 for 5 min, H2O for 5 min, OEG for 30 min, and finally flushed with 500 μL of deionized (DI) water (Milli-Q Biocel, Millipore Corporation, Billerica, MA) to yield OEGylated PDMS, as described previously.40 For plasma treatment, the PDMS was subjected to oxygen plasma for 30 s at 100 W with a March Plasmod (March Instruments, Concord, CA) oxygen plasma system and stored in DI water for future use. Extracted PDMS was prepared according to the previous procedure.41 Prior to use, PDMS pieces were rinsed with methanol and water and dried with nitrogen.
Scintillation measurements of peptide absorption
The radiolabeled Ang II was diluted to 1 pmol/μL with DI water, and 2 μL aliquots of the solution were incubated for 4 h in microchannels made of five different types of PDMS: native, plasma-treated, extracted, OEGylated, and OEGylated extracted. Incubated solutions were pushed out of each device through polytetrafluoroethylene tubing (Cole-Parmer Instrument Company, Vernon Hills, IL) and into microcentrifuge tubes. The devices were then rinsed with 2 μL of DI water and the rinsing solution was pushed into the same microcentrifuge tube. The combined Ang II and rinse solutions were pipetted into a 20 mL glass scintillation vial; 5 mL aliquots of liquid scintillation solution were added to each vial and counted with a liquid scintillation counter (Beckman LS 6500, Beckman Coulter, Inc., Brea, CA); 2 μL aliquots of the Ang II solution before incubation were also measured as a control.
Standard peptide calibration experiments
AP and αBCP were used as received and dissolved in ASW to various concentrations (1-10 pmol/μL) for storage. The outlet tubing of the PDMS device was connected to a 25 μL syringe (Hamilton Company, Reno, NV) controlled by a Harvard PHD 2000 syringe pump (Harvard Apparatus, Holliston, MA) set at the refill mode. For calibration with a single peptide, a desired amount of AP was loaded into the inlet reservoir and pulled through the channel to the outlet at the rate of 0.1 μL/min. For multiple peptide experiments, AP and αBCP were mixed in the inlet prior to assay. Three or more individual samples were tested for each amount, and the mean and standard error of adsorption length were calculated. The best-fit straight lines for adsorption length versus amount were obtained.
Cell experiments
Aplysia californica (100-150 g, National Resource for Aplysia, Miami, FL) were anesthetized by injecting 390 mM of MgCl2 solution equal to 1/2 of each animal’s body weight. The abdominal ganglia with adjacent nerves were dissected and incubated in ASW containing 10 mg/mL protease from Streptomyces griseus at 34 °C for 90 min, modified from previous experiments.42 This treatment facilitated removal of the connective sheath tissue around the ganglia and isolation of individual neurons. After washing with fresh ASW, individual bag cells were isolated and plated into the inlet chamber of a microfluidic device. Cells were allowed to attach to the substrate for at least 1 h and then stimulated by adding an elevated KCl solution (final concentration 55 mM). Following a 15 min incubation, released peptides were collected onto the OTS-functionalized surface by transporting the extracellular media with the syringe pump. The pump was stopped right before the inlet reservoir became completely empty and the remaining liquid was removed. The flow was then resumed until the solution in the channel was depleted.
MS imaging
After peptide collection, the PDMS was peeled off of the silicon substrate. A MALDI matrix, 2,5-dihydroxybenzoic acid (DHB, 10 mg/mL in 50%/50% acetonitrile/water), was sprayed onto the surface with an airbrush (Paasche Airbrush Company, Chicago, IL) placed at a distance of ~15 cm. The substrate was then taped onto a modified target plate and MALDI characterization was performed with a Bruker UltrafleXtreme time-of-flight (TOF) mass spectrometer (Bruker Daltonics, Inc., Billerica, MA) in the reflectron mode. MS images were obtained at 100 or 200 μm resolution with each spot summed from 200 laser shots. Mass calibration was done with peptide calibration standard II (Bruker Daltonics). The images were analyzed with flexImaging software (Bruker Daltonics), and the threshold value for analyte detection was set at 10% of the maximum intensity on the OTS surface as a consistent way to determine the start and end points for measuring the adsorption length. Individual mass spectra were analyzed with FlexAnalysis (Bruker Daltonics) and replotted with Origin, versio n 8. 5 (OriginLab Corporation, Northhampton, MA).
Results and discussion
Minimizing Peptide Losses
Our goal was to design a device that allows the efficient collection of the media around cultured cells and its subsequent characterization via off-line MS. Because of the small scale of the fluidics, there is a large surface-to-volume ratio and so surface loss becomes a significant concern. Obviously, peptides that either partition into or adsorb onto surfaces in the culturing chamber or fluidic channels cannot be measured via MS and are lost. Hence, we carefully minimized sample losses using surface derivatization protocols and then characterized those losses using sensitive radionuclide detection.
In order to minimize partitioning of the molecules into the PDMS material, its chemical properties have to be optimized. This includes adsorption due to the hydrophobicity of PDMS, and the diffusion of uncrosslinked oligomers and remaining platinum catalysts into bulk channel solutions.41,43,44 Several surface treatment protocols have been employed in the past. Oxygen plasma treatment is a widely-used method that renders PDMS hydrophilic, making it more amenable to aqueous solutions.45 PDMS extraction, which consists of a series of solvent washes to remove the uncured oligomers and remaining platinum catalysts used to cure the polymer, significantly improves cell viability in low-density cultures.41 OEGylation, by derivatizing the PDMS surface with OEG, has been shown to reduce protein absorption and to provide more hydrophilic channels.38,40 By measuring the amount of peptide lost by our devices with these treatments, we obtain a more accurate measurement of total peptide release from the neurons.
We measured these losses using radionuclide detection because of its low detection limits and absolute quantitation abilities. We incubated 3H-labeled Ang II in a PDMS device containing 1 mm diameter reservoirs and a straight channel (200 μm wide, 100 μm high, 10 mm long), and then measured the loss of peptides from the surface-treated PDMS materials compared to the native. Recovered peptides from the native, plasma-treated, extracted, OEGylated and OEGylated extracted PDMS were quantified. Fig. 1 shows the signal from radiolabeled Ang II recovered from each type of PDMS compared to non-incubated solutions. Approximately 50% of the peptide was recovered from native, plasma-treated, and extracted PDMS; whereas recovery of 70-75% was observed for OEGylated and OEGylated extracted PDMS, indicating a significant reduction in loss upon OEG treatment (p < 0.05, refer to Fig. 1). Note that the 25-30% sample loss was from a 4 hr incubation, and so losses are expected to be significantly less for shorter analyses times (e.g., ~30 min for the experiments in Figs. 4-6). Furthermore, although the absorption of Ang II into the extracted PDMS (and also the plasma-treated one) was not appreciably different from the native PDMS (p = 0.90), absorption was significantly reduced (p < 0.001) when the extracted PDMS was OEGylated. While OEG treatment did not eliminate sample loss, it certainly reduced it. There was no significant difference (p = 0.35) between the OEGylated and OEGylated extracted PDMS. Therefore, OEGylated PDMS was utilized here; however, the combined OEGylated and extracted PDMS will be explored in future studies as it may aid cell viability. Peptide losses also depend on specific device dimensions, possibly making these treatments even more important for the smaller scale and longer serpentine channels explored below.
Figure 1.
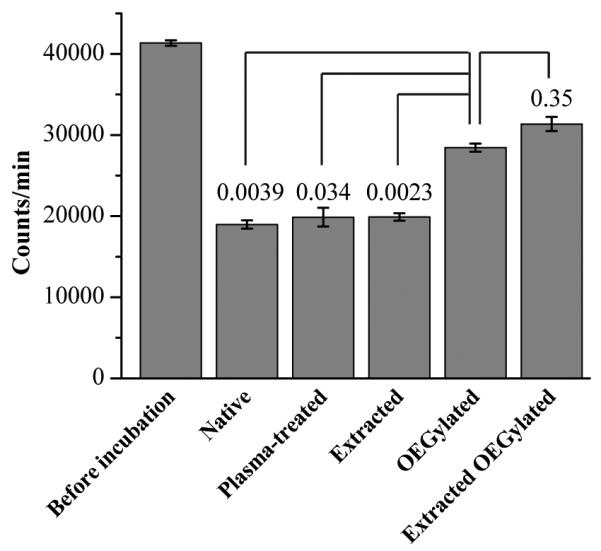
Radiolabeled Ang II peptide recoveries following 4 h incubations from PDMS subjected to different treatments, as well as the control solution before incubation. The p-values comparing peptide recovery from OEGylated PDMS to other types of PDMS are listed above each corresponding bar; the significance (p < 0.05) demonstrates the ability of OEG to reduce peptide absorption. Error bars represent s.e.m.
Figure 4.

Characterization of AP peptide via MS imaging of the microfluidic device substrate. (A) A series of MS images of the adsorption of 1, 3, 5, 10, and 15 pmol of AP. Each spot where AP is detected is colored yellow. (B) Representative mass spectrum showing AP. (C) The calibration curve of adsorption length versus amount of AP obtained using the observed length from the MS image. Error bars represent s.e.m.
Figure 6.

Aplysia bag cell release experiments with the microfluidic device. (A) Micrograph of the sample chamber showing the 15 neurons loaded into the inlet reservoir. (B) MS image for collection of peptide release when no stimulant was added. (C) MS image after neurons were treated with elevated KCl (final concentration = 55 mM). Yellow indicates AP and green, αBCP. (D) Representative mass spectra for the control, and for the AP and αBCP bands from the release experiments, respectively.
Device design and fabrication
Our microfluidic device contains a serpentine channel (200 μm wide, 50 μm high, 110 mm long) with inlet and outlet ports (Fig. 2). The dimensions of the channel permit a stable flow at the rate of 50 nL/min to 5 μL/min. The cell culture/sampling chamber is the inlet to the device; a diameter of 1.5 mm was optimal for ease of liquid handling and cell loading as well as minimizing sample losses that occur with too large an inlet reservoir. Silicone tubing embedded into the PDMS structure ensures a good seal at the outlet and thus, stable liquid flow.
Figure 2.
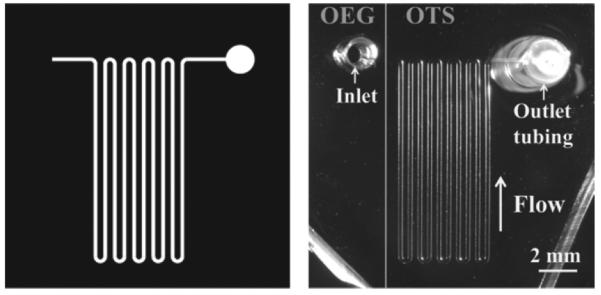
Device design. The microfluidic device contains a long serpentine channel (200 μm width × 50 μm height × 110 mm length). The inlet reservoir is made by punching PDMS with a biopsy punch, and the outlet has a short segment of tubing for connection to a syringe pump. (Left) The chip design on a transparency mask. (Right) A photomicrograph of the PDMS device. Note that the substrate is patterned with OEG and OTS, with their boundary visualized by the grey line. The inlet is on the OEG, and the channel and outlet on the OTS.
We divided the substrate into two regions, each with different surface chemistries. About 2/3 of the silicon substrate underneath the channel is functionalized with OTS for peptide collection.46,47 The other 1/3 is functionalized with our OEG treatments to reduce peptide losses from the sampling/inlet chamber. The PDMS device is carefully aligned with the OTS-OEG boundary, as shown in Fig. 2.
Modeling the molecular adsorption and separation in microchannels
Before using the device to quantify peptides and to gain insight into the device design and operation, we developed a simplified kinetic model to describe the molecular adsorption in the microfluidic device. Consider a plug of analytes (A) with a width (W) of 200 μm, length (L) of 200 μm, and height (H) of 10 μm. The plug flows through a 10 cm-long microchannel at a linear velocity of v (Fig. 3A). The channel is divided into 200 μm-long segments of the same size as the plug (total 500 segments). In each segment the analytes are allowed to adsorb irreversibly onto adsorption sites (θ) at the bottom surface, occupying Aθ sites, with the adsorption rate constant kA for the time period of τ = L/v.
| (1) |
kA is a material property of the analyte, and therefore is independent of other parameters such as flow rate, reaction time, analyte concentration, and dimension of the channel. The total number of binding sites is constant and determined by the surface area (W × L) and the size of the A molecule (assumed 1 nm for this study). From the site and material balance:
| (2) |
| (3) |
where [θ]T and [A]o represent the total binding sites in a segment and the concentration of A when entering each segment, respectively. We assume a bimolecular elementary reaction, monolayer adsorption, no interaction between analytes, and no surface migration of analytes. Therefore, the adsorption rate is
| (4) |
Upon completion of the reaction in a segment, the plug then discretely moves to the next segment where further adsorption takes place. The process repeats until the analyte plug migrates along the entire channel length.
Figure 3.

A simple kinetic model describes the molecular adsorption in the microfluidic device. (A) An analyte plug (W × L × H) flows through a microchannel with liner velocity of v. The channel is divided into multiple segments where the analytes in the solution are consumed by adsorption. (B) The adsorption length of analytes increases with the amount. (C) The adsorption length is insensitive to a wide range of kA. (D) Collection efficiency decreases at high flow rates. (E) The relative timescale between the reaction and convection determines the sensitivity of adsorption length to flow rates. (F-G) Analytes with sufficiently different adsorption rate constants can be separated by the microchannel.
The solutions are obtained for an initially clean substrate using ODE solvers in MATLAB, and Fig. 3B shows the surface coverage of the analyte ([Aθ]/[θ]T) versus channel distance for amounts ranging from 1 pmol to 30 pmol. kA = 10000 M−1s−1 and v = 2.5 mm/s are used, and a coverage of 1 indicates saturation. The length covered by an analyte increases with amount. The linear result of length versus amount supports our concept of quantitation. When this sample is analyzed using MS imaging, the signal intensity is related to the surface coverage. We find that using the end point of the analyte band (i.e., adsorption length), rather than fitting the MS intensity profile directly to the model, is a robust measure for quantitation. Here we defined the threshold surface coverage above which the presence of analytes can be detected with MALDI to be 0.1. With this criterion the adsorption length versus amount is plotted at v = 2.5 mm/s for kA values of 5000 M−1s−1, 10000 M−1s−1, and 50000 M−1s−1 (Fig. 3C). The adsorption length is linearly proportional to the amount, and turns out to be insensitive to kA. The result suggests that our quantitation method, the amount-to-length conversion, can be applied to peptides with different adsorption characteristics.
For a given device design and a system to be analyzed, the only parameter under external control is flow rate. Understanding the effect of flow rate thus aids in obtaining reliable quantitation. In Fig. 3D, the surface coverage for 10 pmol is plotted at a linear velocity of 0.83 mm/s to 42 mm/s, which corresponds to 0.1 μL/min to 5 μL/min for continuous feed (kA = 10000 M−1s−1). To fully utilize the adsorption capability of the substrate, the flow rate should be low so that the timescale for analyte-substrate interaction remains longer than the reaction timescale (τ > 1/kACA), where CA denotes initial analyte concentration. When this condition is met, the adsorption length varies only with the amount of analytes, and becomes fairly insensitive to the flow rate (Fig. 3E) and the analyte concentration (Supplementary Information).
For a mixture of analytes with different adsorption rate constants, a separation between them is expected due to their differential adsorption. Consider a mixture of two analytes (5 pmol each of A and B) with adsorption rate constants kA = 10kB = 100000 M−1s−1. The adsorption is now competitive between the two, and a similar site and material balance applies to the rate equations (refer to Supplementary Information). When the analyte plug flows down the channel, preferential adsorption of A occurs, followed by adsorption of B as A in the solution is depleted. The result is two distinct analyte bands (Fig. 3F). The same principle applies to a mixture of three different analytes (5 pmol each of A, B, and C) as shown in Fig. 3G. In the actual experiments, analytes are continuously supplied to the channel as a long band rather than a plug, and a thin layer chromatography-like separation may occur as the mobile phase drives the adsorbates. This separation mechanism is not discussed further.
Validation of the model with standards
Next, we experimentally validated our model using two neuropeptide standards, AP (m/z 2959.6) and αBCP (m/z 1122.6), two well-characterized peptides released from Aplysia bag cells and cleaved from the same egg laying prohormone.48 We first performed the calibration experiments with only AP to determine optimized conditions. The flow rates of 0.1 and 0.05 μL/min and analyte concentrations of 1 and 0.5 pmol/μL were tested with the same amounts of AP. As suggested by the model, the detected adsorption length was insensitive to the analyte concentration and the flow rate at 0.1 μL/min and below where kACAτ > 1 (refer to Fig. S1 in Supplementary Information). Therefore, the flow rate of 0.1 μL/min was used for subsequent experiments to minimize experimental times. Peptide standards (1, 3, 5, 10, or 15 pmol AP in ASW) were added into the reservoir and pulled through the channel. The resulting MS images in Fig. 4A show the adsorbed AP, with AP signals visualized in yellow and the threshold value for analyte detection set at 10% of the maximum intensity on the collection area. A representative mass spectrum is shown in Fig. 4B. These images clearly demonstrate that the adsorption length increased proportionally with the amount of peptide introduced. As discussed earlier, the non-uniformity of signal intensity is from the non-reproducibility of the MALDI-MS measurements rather than non-uniform adsorption of analytes. Despite the large intensity fluctuation at individual pixels within the MS image, the signal remains obvious throughout until the front and end of the band, allowing for accurate length measurement. The observed profile well matches the model’s predictions shown in Fig. 3B, suggesting the saturation of adsorption sites except for the band boundaries. A calibration curve (Fig. 4C) plotting the adsorption length of AP versus its amount shows a good linearity within the tested range (R2 = 0.97). The adsorption length for AP was measured from the OTS-OEG boundary to the end point of the band. The variance of length measurement, defined as the ratio of standard error of the mean (s.e.m.) to mean, is from 3% to 12% from distinct microfluidic devices. The limit of detection (LOD) for AP, which is defined as the amount at zero length in the calibration curve in Fig. 4C, is 600 fmol. The small negative intercept of the fit line is primarily due to sample lost to the sampling chamber. Indeed, we detected AP signals in the inlet reservoir even with OEG functionalization. However, when the AP solution was pulled through the channel above the OEG-functionalized surface, no AP peaks were detected, demonstrating the ability of OEG to prevent peptide adsorption. Therefore, the signals in the inlet were unlikely from peptide adsorption, but most likely from residual peptides left behind as the liquid dried in the reservoir. It is possible that the presence of an inlet contributed to the variance of measured length, but the linear length-amount relationship indicates that this is not a large effect. The slope of the calibration equation suggests that the AP occupies 2.8 mm of channel length per pmol, equaling to a surface coverage of 1.8 × 10² pmol/cm2. We previously reported that the value of Ang II is 33 pmol/cm2.19 Peptide adsorption properties depend on chemical structure and polarity;49 the slight differences in surface coverage for AP and Ang II are expected. In all, experiments on AP demonstrate that quantitation based on length of coverage is feasible.
As mentioned previously, neurons often secrete multiple peptides during stimulation and MS can characterize each. Thus, we wanted to determine whether two peptides can be simultaneously measured and if the linear length-to-amount relationship is still maintained. We tested our device by mixing AP and αBCP in the reservoir; the amount of AP was fixed at 3 pmol and αBCP varied from 1 to 15 pmol. MS images for each amount of αBCP are shown in Fig. 5A, with yellow spots for AP and green for αBCP. For each sample tested, two distinct bands were clearly visible without overlap. A representative mass spectrum for each band is shown in Fig. 5B, confirming that these two peptides were separated. Based on our model and the fact that AP deposited first on the channel, it appears that AP has a higher adsorption rate constant than αBCP. When quantifying multiple peptides with similar k values, our approach of generating calibration curves from pre-mixed peptides can be applied to minimize issues related to band overlap. From each image, the adsorption length of the αBCP band was measured from the start to end points determined by the 10% threshold value, and the calibration curve for length versus amount (Fig. 5C) demonstrates a linear relationship (R2 = 0.98) in the tested sample range. The variance of length measurement is in the range of 3 to 8%. From the slope of the linear fit, the surface coverage of αBCP was calculated as 1.6 × 10² pmol/cm2, close to the value of AP. Because of the gradual change of the analyte coverage at the front and end of the band, the intercept of the linear fit is positive when calibration curves are generated based on the band length. The positive intercept requires a small adjustment in the LOD value. We define the LOD for αBCP as the amount at the summed length of band-front and band-end, which is ~3 mm in Fig. 5A at 1 pmol. The LOD of 400 fmol for αBCP was then obtained from a straight line between the origin and the data point at 1 pmol shown in Fig. 5C. The series of MS images also indicates that the length of 3 pmol of AP remained essentially constant, suggesting that changing the amounts of other analytes have limited influence on the band length. This was further confirmed by fixing the amount of αBCP at 3 pmol and varying AP from 1 to 5 pmol; the resulting αBCP bands were of constant length, and the length of AP was the same as the corresponding length when αBCP was not present. Therefore, this quantitation method is applicable when more than one analyte is present. Moreover, because each of the above experiments was done on a different device, the reproducibility of imaging profiles demonstrates the robustness of our measurement platform.
Figure 5.

MS imaging of two peptides (AP and αBCP) from the microfluidic substrate. (A) A series of MS images of the adsorption of 1, 3, 5, 10, and 15 pmol of αBCP and 3 pmol AP. Yellow color indicates AP and green, αBCP. (B) Representative mass spectra for the AP and αBCP bands, respectively. (C) The calibration curve of adsorption length versus amount for αBCP. Error bars represent s.e.m.
Measuring neuronal release
Aplysia bag cell neurons, located in the abdominal ganglion, are commonly used as a model to study activity-dependent neurosecretion. They were used in this study to document the capability of our approach for quantifying peptide release from neurons. When the surrounding KCl concentration is elevated, the membrane is depolarized, leading to the release of several peptides that originate from egg laying prohormone.35,50 Previous studies used intact abdominal ganglia placed in perfusion systems and the secreted peptides in the perfusate were quantified by HPLC51 or radioactivity.50,52 The results showed high variability in the amounts of peptides released from different ganglia, but on average, the amount of each peptide from a single bag cell was in the upper femtomole range, assuming about 400 bag cells per ganglion. Compared to perfusion systems, microfluidic devices more efficiently collect the extracellular environment with minimal sample loss, and allow more precise timing of chemical stimulations. Here, 15 cells were loaded into the sampling chamber (Fig. 6A), and control experiments analyzed the media surrounding the cells without KCl stimulation. An MS image of a control is presented in Fig. 6B, in which yellow indicates AP and green, αBCP. The peptide signals in the reservoir were due to cell lysis occurring when the chamber was dried. No peptide signals associated with bag cell stimulation were detected there, indicating that the lysis products did not enter the channel. A representative mass spectrum from the channel area of the control device is shown in Fig. 6D. When the cells were treated with 55 mM KCl for 15 min, the peaks for AP and αBCP were detectable in the channel (Fig. 6C and 6D). Both peptides were detected as separate, distinct bands, and their identities confirmed via MS. Based on the measured lengths and the calibration equations obtained with standards, the amount of AP released from 15 bag cells was estimated to be 2.3 ± 0.4 pmol, and αBCP, 1.9 ± 0.9 pmol (mean ± s.e.m., from 3 samples), meaning that the average isolated cell in vitro released 0.15 ± 0.03 pmol of AP and 0.13 ± 0.06 pmol of αBCP. These values are consistent with the femtomole release expected from a single cell.51,52 The results presented here validate our approach for quantifying peptide release from a microfluidic device based on the adsorption length measured using MS imaging.
Conclusions
Microfluidics is receiving greater attention in analytical chemistry because of its ability to perform low-volume manipulations and work with samples such as cells. At the same time, MS has become the preferred technology for peptidomics and proteomics measurements. By combining MS with a microfluidic sampling system, we have successfully developed an off-line approach for quantifying the media located around cells for neuropeptides. The adsorption-length-based approach takes advantage of the imaging capability of MALDI while avoiding the challenges of conventional signal-intensity-based quantitation by offering a simple, robust and label-free solution for quantitative studies. Validated using peptide standards and releasate from Aplysia bag cell stimulation, this approach is flexible and can be adapted to many other molecular classes in addition to neuropeptides. Future work will use more complex devices with multiple channels and collection areas so that our analyses will include monitoring multiple secretion events with time and/or spatial resolution and comparison of releasate under different physiological conditions.
Supplementary Material
Acknowledgements
We thank Dr. Stanislav Rubakhin and Sam-ang Supharoek for helpful discussions, Anika Jain from Prof. Martha Gillette’s group at UIUC for providing extracted PDMS, and Stephanie Baker for help with manuscript preparation. This work is supported by the National Science Foundation, Award No. DMI-0328162, the National Institute on Drug Abuse, Award No. P30DA018310, and the National Institute of Neurological Disease and Stroke, Award No. R01NS031609. The funding agencies had no role in study design, data collection and analysis, decision to publish, or preparation of the manuscript.
References
- 1.Manz A, Harrison DJ, Verpoorte EMJ, Fettinger JC, Paulus A, Lüdi H, Widmer HM. J. Chromatogr., A. 1992;593:253–258. [Google Scholar]
- 2.Ohno K, Tachikawa K, Manz A. Electrophoresis. 2008;29:4443–4453. doi: 10.1002/elps.200800121. [DOI] [PubMed] [Google Scholar]
- 3.Huang B, Wu H, Bhaya D, Grossman A, Granier S, Kobilka BK, Zare RN. Science. 2007;315:81–84. doi: 10.1126/science.1133992. [DOI] [PubMed] [Google Scholar]
- 4.Cellar NA, Kennedy RT. Lab Chip. 2006;6:1205–1212. doi: 10.1039/b603561b. [DOI] [PubMed] [Google Scholar]
- 5.Zhuang Z, Starkey JA, Mechref Y, Novotny MV, Jacobson SC. Anal. Chem. 2007;79:7170–7175. doi: 10.1021/ac071261v. [DOI] [PubMed] [Google Scholar]
- 6.Clark AM, Sousa KM, Jennings C, MacDougald OA, Kennedy RT. Anal. Chem. 2009;81:2350–2356. doi: 10.1021/ac8026965. [DOI] [PMC free article] [PubMed] [Google Scholar]
- 7.Taylor AM, Blurton-Jones M, Rhee SW, Cribbs DH, Cotman CW, Jeon NL. Nat. Methods. 2005;2:599–605. doi: 10.1038/nmeth777. [DOI] [PMC free article] [PubMed] [Google Scholar]
- 8.Kovarik ML, Brown PJB, Kysela DT, Berne C, Kinsella AC, Brun YV, Jacobson SC. Anal. Chem. 2010;82:9357–9364. doi: 10.1021/ac101977f. [DOI] [PMC free article] [PubMed] [Google Scholar]
- 9.Millet LJ, Stewart ME, Nuzzo RG, Gillette MU. Lab Chip. 2010;10:1525–1535. doi: 10.1039/c001552k. [DOI] [PMC free article] [PubMed] [Google Scholar]
- 10.Predel R, Neupert S, Garczynski SF, Crim JW, Brown MR, Russell WK, Kahnt J, Russell DH, Nachman RJ. J. Proteome Res. 2010;9:2006–2015. doi: 10.1021/pr901187p. [DOI] [PMC free article] [PubMed] [Google Scholar]
- 11.Rubakhin SS, Sweedler JV. Nat. Protoc. 2007;2:1987–1997. doi: 10.1038/nprot.2007.277. [DOI] [PubMed] [Google Scholar]
- 12.Hatcher NG, Richmond TA, Rubakhin SS, Sweedler JV. Anal. Chem. 2005;77:1580–1587. doi: 10.1021/ac0487909. [DOI] [PubMed] [Google Scholar]
- 13.Lee J, Musyimi H, Soper S, Murray K. J. Am. Soc. Mass Spectrom. 2008;19:964–972. doi: 10.1016/j.jasms.2008.03.015. [DOI] [PubMed] [Google Scholar]
- 14.Su J, Bringer MR, Ismagilov RF, Mrksich M. J. Am. Chem. Soc. 2005;127:7280–7281. doi: 10.1021/ja051371o. [DOI] [PubMed] [Google Scholar]
- 15.Fujita M, Hattori W, Sano T, Baba M, Someya H, Miyazaki K, Kamijo KI, Takahashi K, Kawaura H. J. Chromatogr., A. 2006;1111:200–205. doi: 10.1016/j.chroma.2005.11.117. [DOI] [PubMed] [Google Scholar]
- 16.Nichols KP, Gardeniers JGE. Anal. Chem. 2007;79:8699–8704. doi: 10.1021/ac071235x. [DOI] [PubMed] [Google Scholar]
- 17.Chaurand P, Schwartz SA, Caprioli RM. Curr. Opin. Chem. Biol. 2002;6:676–681. doi: 10.1016/s1367-5931(02)00370-8. [DOI] [PubMed] [Google Scholar]
- 18.Rubakhin SS, Jurchen JC, Monroe EB, Sweedler JV. Drug Discov. Today. 2005;10:823–837. doi: 10.1016/S1359-6446(05)03458-6. [DOI] [PubMed] [Google Scholar]
- 19.Jo K, Heien ML, Thompson LB, Zhong M, Nuzzo RG, Sweedler JV. Lab Chip. 2007;7:1454–1460. doi: 10.1039/b706940e. [DOI] [PubMed] [Google Scholar]
- 20.Szájli E, Fehér T, Medzihradszky KF. Mol. Cell. Proteomics. 2008;7:2410–2418. doi: 10.1074/mcp.M800108-MCP200. [DOI] [PubMed] [Google Scholar]
- 21.Garden RW, Sweedler JV. Anal. Chem. 1999;72:30–36. doi: 10.1021/ac9908997. [DOI] [PubMed] [Google Scholar]
- 22.Knochenmuss R. Anal. Chem. 2003;75:2199–2207. doi: 10.1021/ac034032r. [DOI] [PubMed] [Google Scholar]
- 23.Li L, Sweedler JV. Annu. Rev. Anal. Chem. 2008;1:451–483. doi: 10.1146/annurev.anchem.1.031207.113053. [DOI] [PubMed] [Google Scholar]
- 24.Fricker LD, Lim J, Pan H, Che F-Y. Mass Spectrom. Rev. 2006;25:327–344. doi: 10.1002/mas.20079. [DOI] [PubMed] [Google Scholar]
- 25.Ong S-E, Blagoev B, Kratchmarova I, Kristensen DB, Steen H, Pandey A, Mann M. Mol. Cell. Proteomics. 2002;1:376–386. doi: 10.1074/mcp.m200025-mcp200. [DOI] [PubMed] [Google Scholar]
- 26.Julka S, Regnier F. J. Proteome Res. 2004;3:350–363. doi: 10.1021/pr0340734. [DOI] [PubMed] [Google Scholar]
- 27.Yao X. Anal. Chem. 2011;83:4427–4439. doi: 10.1021/ac200925p. [DOI] [PubMed] [Google Scholar]
- 28.Xiang F, Ye H, Chen R, Fu Q, Li L. Anal. Chem. 2010;82:2817–2825. doi: 10.1021/ac902778d. [DOI] [PMC free article] [PubMed] [Google Scholar]
- 29.DeKeyser SS, Li L. Analyst. 2006;131:281–290. doi: 10.1039/b510831d. [DOI] [PubMed] [Google Scholar]
- 30.Che F-Y, Vathy I, Fricker L. J. Mol. Neurosci. 2006;28:265–275. doi: 10.1385/JMN:28:3:265. [DOI] [PubMed] [Google Scholar]
- 31.Boersema PJ, Raijmakers R, Lemeer S, Mohammed S, Heck AJR. Nat. Protoc. 2009;4:484–494. doi: 10.1038/nprot.2009.21. [DOI] [PubMed] [Google Scholar]
- 32.Brockmann A, Annangudi SP, Richmond TA, Ament SA, Xie F, Southey BR, Rodriguez-Zas SR, Robinson GE, Sweedler JV. Proc. Natl. Acad. Sci. 2009;106:2383–2388. doi: 10.1073/pnas.0813021106. [DOI] [PMC free article] [PubMed] [Google Scholar]
- 33.Rubakhin SS, Sweedler JV. Anal. Chem. 2008;80:7128–7136. doi: 10.1021/ac8010389. [DOI] [PMC free article] [PubMed] [Google Scholar]
- 34.Conn P, Kaczmarek L. Mol. Neurobiol. 1989;3:237–273. doi: 10.1007/BF02740607. [DOI] [PubMed] [Google Scholar]
- 35.Jung LJ, Scheller RH. Science. 1991;251:1330–1335. doi: 10.1126/science.2003219. [DOI] [PubMed] [Google Scholar]
- 36.Sagiv J. J. Am. Chem. Soc. 1980;102:92–98. [Google Scholar]
- 37.Papra A, Gadegaard N, Larsen NB. Langmuir. 2001;17:1457–1460. [Google Scholar]
- 38.Dekeyser CM, Buron CC, Mc Evoy K, Dupont-Gillain CC, Marchand-Brynaert J, Jonas AM, Rouxhet PG. J. Colloid Interface Sci. 2008;324:118–126. doi: 10.1016/j.jcis.2008.05.002. [DOI] [PubMed] [Google Scholar]
- 39.Tourovskaia A, Figueroa-Masot X, Folch A. Nat. Protoc. 2006;1:1092–1104. doi: 10.1038/nprot.2006.123. [DOI] [PMC free article] [PubMed] [Google Scholar]
- 40.Sui G, Wang J, Lee C-C, Lu W, Lee SP, Leyton JV, Wu AM, Tseng H-R. Anal. Chem. 2006;78:5543–5551. doi: 10.1021/ac060605z. [DOI] [PubMed] [Google Scholar]
- 41.Millet LJ, Stewart ME, Sweedler JV, Nuzzo RG, Gillette MU. Lab Chip. 2007;7:987–994. doi: 10.1039/b705266a. [DOI] [PubMed] [Google Scholar]
- 42.Rubakhin SS, Page JS, Monroe BR, Sweedler JV. Electrophoresis. 2001;22:3752–3758. doi: 10.1002/1522-2683(200109)22:17<3752::AID-ELPS3752>3.0.CO;2-H. [DOI] [PubMed] [Google Scholar]
- 43.Toepke MW, Beebe DJ. Lab Chip. 2006;6:1484–1486. doi: 10.1039/b612140c. [DOI] [PubMed] [Google Scholar]
- 44.Regehr KJ, Domenech M, Koepsel JT, Carver KC, Ellison-Zelski SJ, Murphy WL, Schuler LA, Alarid ET, Beebe DJ. Lab Chip. 2009;9:2132–2139. doi: 10.1039/b903043c. [DOI] [PMC free article] [PubMed] [Google Scholar]
- 45.Vickers JA, Caulum MM, Henry CS. Anal. Chem. 2006;78:7446–7452. doi: 10.1021/ac0609632. [DOI] [PubMed] [Google Scholar]
- 46.Rocha S, Carmo Pereira M, Coelho MAN, Möhwald H, Brezesinski G. Langmuir. 2007;23:5022–5028. doi: 10.1021/la0628120. [DOI] [PubMed] [Google Scholar]
- 47.Fragneto G, Thomas RK, Rennie AR, Penfold J. Science. 1995;267:657–660. doi: 10.1126/science.7839141. [DOI] [PubMed] [Google Scholar]
- 48.Hatcher NG, Sweedler JV. J. Neurophysiol. 2008;99:333–343. doi: 10.1152/jn.00968.2007. [DOI] [PubMed] [Google Scholar]
- 49.Margel S, Vogler EA, Firment L, Watt T, Haynie S, Sogah DY. J. Biomed. Mater. Res. 1993;27:1463–1476. doi: 10.1002/jbm.820271202. [DOI] [PubMed] [Google Scholar]
- 50.Wayne NL, Wong H. Endocrinology. 1994;134:1046–1054. doi: 10.1210/endo.134.3.8119141. [DOI] [PubMed] [Google Scholar]
- 51.Newcomb RW, Scheller RH. Brain Res. 1990;521:229–237. doi: 10.1016/0006-8993(90)91547-t. [DOI] [PubMed] [Google Scholar]
- 52.Wayne NL, Kim J, Lee E. J. Neuroendocrinol. 1998;10:529–537. doi: 10.1046/j.1365-2826.1998.00235.x. [DOI] [PubMed] [Google Scholar]
Associated Data
This section collects any data citations, data availability statements, or supplementary materials included in this article.