

Abstract
Cells are extraordinarily complex, containing thousands of different analytes with concentrations spanning at least nine orders of magnitude. Analyzing single cells instead of tissue homogenates provides unique insights into cell-to-cell heterogeneity and aids in distinguishing normal cells from pathological ones. The high sensitivity and low sample consumption of capillary and on-chip electrophoresis, when integrated with fluorescence, electrochemical, and mass spectrometric detection methods, offer an ideal toolset for examining single cells and even subcellular organelles; however, the isolation and loading of such small samples into these devices is challenging. Recent advances have addressed this issue by interfacing a variety of enhanced mechanical, microfluidic, and optical sampling techniques to capillary and on-chip electrophoresis instruments for single-cell analyses.
1. Introduction
Cells contain thousands of different compounds belonging to many analyte classes: amino acids, proteins, lipids and sugars, among others. Their concentrations vary widely due to a number of factors, such as an animal’s physiological state, season, and even the time of day. Chemical differences between cell types are expected, even for so-called homogenous cell populations: a surprising cell-to-cell heterogeneity exists. Unfortunately, when working with measurement approaches that report average values for larger numbers of cells, critical information is often not obtained.
In contrast, single-cell analysis provides insight into cellular heterogeneity and oftentimes retains the unique information present within individual cells. For example, if only one cell out of 100 possesses an analyte of interest, assaying 100 cells dilutes the analyte of interest and likely complicates detection due to the presence of constituents common to all cells. This also places a large demand on the dynamic range of the detection system because analyte levels within a tissue range from millimole to zeptomole amounts. As two striking examples of cell-to-cell heterogeneity, adjacent neurons oftentimes have different complements of signaling molecules1 and large stochastic variances exist in protein expression from supposedly identical bacterial cells.2 Obviously, for heterogeneous samples where multiple cell types are spatially intertwined (like neurons and glia), a bulk chemical analysis results in average values for the region but does not provide information on defined cell types. Single-cell analysis overcomes these issues by examining heterogeneous tissues one cell at a time, reducing analyte dilution, potentially decreasing sample complexity, and reducing the dynamic range necessary to characterize the components present within a tissue. While there are numerous applications for single cell measurements, the contributions of individual cell measurements to neuroscience, cancer research, and stem cell biology have pushed many of the development efforts.3,4
There are several characteristics to consider when choosing the optimal approach for analyzing a cell, including its morphology, electrophysiology, transcriptome, and chemical constituents. Accordingly, there are numerous methods for probing single cells: optical microscopy, next generation sequencing, electrophysiology, and a host of chemical characterization approaches. For small molecules (i.e., the metabolome), electrophoretic separations have become widely employed;5 they reduce the complexity of the data and assist in the identification of molecules that possess similar characteristics. Moreover, because the physical scaling laws for electrophoresis favor miniaturization, it has been applied to a broad range of single-cell experiments.6
While the separation and detection figures of merit are important, perhaps no area determines the success of such measurements more than isolating and sampling the cells. Therefore, approaches for sampling cells and introducing them to the separation channel are highlighted, with an emphasis on sampling strategies for single cell electrophoresis developed from 2008–2011. Why highlight sampling? One of the challenges and unique aspects of single cell analysis is effective sample handling. Selecting and isolating specific cells (especially when rare) without adversely affecting cell contents requires either a skilled physiologist or automated cell manipulation techniques. Recent progress in meeting these criteria include the development of optical traps, improved cell sorting, and microfluidic manipulations. Sampling techniques that enable analytical measurements of single cells benefits multiple fields of research, including analytical chemistry, biology, and physics. Our discussion is not meant to be comprehensive, but rather, to highlight recent results, improvements and trends in single-cell sampling applied to capillary electrophoresis (CE).
2. Historical overview of electrophoresis for single-cell analysis
While electrophoresis has a long history,7 applying it to examine individual cells is more recent. In the 1950s and 1960s, electrophoretic methods and instrumentation were developed to isolate cellular components from lower-volume samples. Starch-zone electrophoresis, microdisc electrophoresis, and paper electrophoresis were techniques commonly used to separate proteins from cell suspensions, small cell clusters, and even individual cells. In 1955, Smithies et al.8 investigated sera proteins using starch-zone electrophoresis and identified three different classes of sera based on the presence or absence of various unidentified compounds. Hydén, Bjurstam, and McEwen9 published a study in 1966 demonstrating the electrophoretic separation of 10−7 to 10−9 grams of protein from individual brain stem neurons and cortical cells, as well as low numbers of Deiters’ neurons and cell clusters, using microdisc electrophoresis coupled with a laboratory-built microdensiometer to record the protein bands. Five 200 μm-diameter glass capillaries filled with polyacrylamide gel were used in parallel to separate a total of 17 protein bands from 60 Deiters’ neurons; sample isolation and manipulation were done by hand. The importance of downscaling the electrophoresis apparatus to match the scale of the cells was recognized early; even before the advent of CE, Matioli and coworkers10 separated the hemoglobin fractions in individual red bloods cell via polyacrylamide electrophoresis on a fiber, and Rüchel11 used a postage stamp-sized, ultrathin slab gel to isolate proteins from individual bag cell neurons from Aplysia.
As the figures of merit for small-scale electrophoresis improved to allow a greater range of measurements, interest in using the technology for single-cell studies intensified. Pioneering research was reported by the Jorgenson, Yeung, and Ewing groups as well as the Dovichi, Arriaga, and Sweedler groups by developing microelectrophoretic techniques to look quantitatively at the contents of single cells and organelles, including neurotransmitters,12–19 amino acids,20,21 enzymes and proteins,22–26 sugars,27,28 and other small molecules.29–31 Optimized and more flexible cell-sampling approaches continue to evolve as researchers endeavor to investigate ever-smaller sample sizes, detection methods become more sensitive, and separation throughput increases.
3. Present strategies for single-cell separation and detection
The development of modern CE, described by Jorgenson and Lukacs in 1981,32,33 has enabled the evolution of single-cell research. The components can be relatively inexpensive and a basic instrument is fairly simple to set up, especially when compared with the early electrophoresis studies mentioned above. There are several benefits associated with using CE, such as its low sample-volume requirements, spatial dimensions, fast and efficient separations, and versatility, making it a popular choice for the analytical separation of the contents within single cells.20,21,29,34–37
Microfluidic chips coupled with CE have also been used for single-cell electrophoresis.36,38–41 The development of lab-on-a-chip techniques has broadened the scope of single-cell studies, impacting biology, chemistry, physics, and engineering. The advantages of using microfluidics as a basis for analytical platforms are numerous. The small volumes, portability, and design versatility all contribute to the use of microfluidics for single-cell analysis. Also, the ability to integrate multiple experimental components (like sample preparation, separation, and detection) on one device and potentially automate them, is a key benefit, especially for rapid, high-throughput analysis.
When analyzing samples whose content may be in the femtomole to yoctomole range, sensitive detection methods are necessary, and a number of sensitive detection modalities have been developed for CE. By far the most common are fluorescence, electrochemical, and mass spectrometric detection; others include radionuclide and nuclear magnetic resonance schemes.42 The figures of merit of these detection systems impact the sampling approaches used for single-cell analyses, and so the detection systems are briefly described within the context of single-cell measurements.
Fluorescence is often used for single-cell analysis due to its sensitivity, broad linear dynamic range (109 orders of magnitude), low detection limits, and selectivity. This combination of factors allows for both abundant and trace analyte levels to be detected and quantitated. Laser-induced native fluorescence (LINF) is a selective detection method, as relatively few biological analytes are natively fluorescent. This selectivity can reduce the complexity of electropherograms and, when available, wavelength-resolved information provides additional details about analyte identity. More commonly, laser-induced fluorescence (LIF) relies on derivatization reagents to attach fluorophores to non-fluorescent molecules. Although there is a loss in selectivity and information content when using derivatization, there are a wide variety of reagents available that allow for detection of a much broader range of analytes than with native fluorescence instrumentation. Another benefit is the extremely low detection limit (attomole to yoctomole) that is achievable due to the high quantum yields and other properties of select fluorophores. Consequently, CE-LINF1,16,43 and CE-LIF22,31,44,45 have been used extensively to profile the contents of single cells and organelles.
Electrochemistry (EC) is a popular alternative to fluorescence detection for single-cell analysis.46–48 Instrumentation is relatively simple and low cost and for many analytes, no derivatization is necessary, which reduces sample preparation requirements. EC offers zeptomole limits of detection in the best cases, comparable to fluorescence measurements. Three main types of EC detection are used: amperometry, voltammetry, and conductivity. Amperometry is the most commonly used EC approach and it is highly sensitive. Voltammetry is roughly 100-fold less sensitive than amperometry but provides more chemical information. Finally, as conductivity can measure signals generated by any charged compound, it is the most universal of the three electrochemical approaches.
Mass spectrometry (MS) has increasingly been used to profile the contents of single cells49–54 due to several key factors. First, a large variety of analyte classes are amenable to MS detection, including small molecules, peptides, proteins, and sugars, as the main requirement is that the analyte can be vaporized and ionized, processes now achievable with many analyte classes. Moreover, MS can detect many distinct analytes simultaneously, providing data with high information content on each analyte. Structural information can also be obtained, which aids in analyte identification, and no derivatization of the analytes is necessary. Mass detection limits are appropriate for single-cell analysis, in the nanogram to femtogram range, and the low sample volumes typically encountered in CE and microfluidics can readily be analyzed.
4. Sampling techniques
In the context of single-cell measurements, one of the greatest benefits of CE is that the capillary dimensions approximate the sizes of many cells. Injecting picoliters to nanoliters of sample into the separation capillary appears well suited to the needs of single-cell analysis. However, as dealing with samples much smaller than several hundred nanoliters is difficult, oftentimes the cell is homogenized in a 100–1000 nL volume vial. Therefore, when nanoliters of solution are injected, this may represent only <1% percent of the cell contents actually being injected into the capillary. This low percentage provokes the question of whether an analyte is not detected because it is not present in the cell or because it is present in too low an amount so that injecting only a small fraction of the sample creates a measurement below the instrumental detection limits. Perhaps the easiest approach to increasing overall detectability is increasing the fraction of the sample that is injected, all the way up to injecting the entire cell directly into the capillary. There are numerous sample manipulation strategies that have been interfaced to CE and microfluidic instruments to accomplish this, some of which are detailed below.
It would be remiss not to mention the importance of flow cytometry in single-cell analysis.55–61 It is the classical method used for single-cell measurements and relies on characteristics such as morphology or fluorescence to sort cells for further measurements. Many of the sampling strategies discussed in this review use modified forms of flow cytometry to automate the isolation of single cells or cytometry-inspired cell isolation approaches for sensitive detection post-capillary. Given this widespread use, flow cytometry does not have a heading of its own, but from cell sorting in chips to sheath flow detection, its influence appears throughout the descriptions that follow.
4.1 Manual manipulation
Manual sample manipulations have enabled a variety of single-cell studies. In general, a number of optical, electrical, chemical, and physical tools can be used to remove cells from an organ or organism,62–64 isolate organelles from a cell,22,24,29,65 and sample directly from the cytoplasm.13,66 Although manual manipulation takes time and skill, its advantages include flexibility and compatibility with classical physiological and immunohistochemical approaches, ideal for cells that are not amenable to culturing or other handling procedures. Representative studies using manual cell sampling and isolation are discussed below.
The Sweedler group has profiled single-cell and subcellular metabolites using CE coupled to MS.52,53 In one of the initial reports, two different cell types from Aplysia californica were individually isolated and disrupted using sharpened needles and contents were extracted for analysis. The contents of a single R2 cell soma were also compared with those from the same R2 cell’s neurite, and it was determined that these distinct subcellular regions contained different relative amounts of several metabolites. Nemes et al.53 profiled 50 Aplysia cells belonging to six different neuron types. More than 300 distinct ion signals from endogenous metabolites were detected from a single neuron, 140 of which were selected for chemometric data analysis. This profiling revealed quantitative and qualitative chemical differences between individual neurons and neuronal types (Figure 1).
Fig. 1. Manual isolation of selected cells, followed by CE-MS measurements.
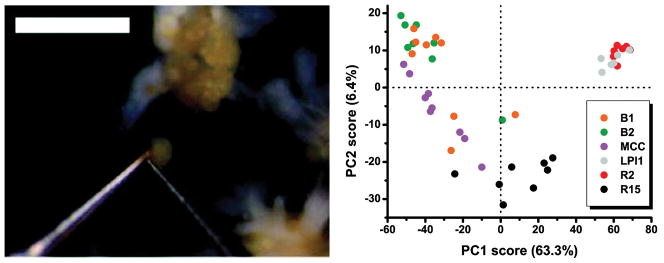
(Left) A single R2 neuron removed from the abdominal ganglia of Aplysia californica. Scale bar is 1 mm. (Right) Principal component analysis score plot revealed chemical differences between individual neurons and neuron types. Each data point corresponds to a different single cell. (Adapted with permission from ref.53 Copyright 2011, American Chemical Society.)
Lantz and co-workers used whole-cell fluorescence in situ hybridization with CE-LIF to rapidly identify microbial cells within heterogeneous populations of other microbial cells67 and within whole blood.68 In the first study, as few as three injected cells of Salmonella typhimurium were detected against a background of 300 injected Escherichia coli cells, so that the analysis approached the detection of single pathogens. This procedure and analysis was rapid, the separation did not experience band broadening, and the protocol is particularly useful for identifying microbial cells that are similar and physiologically unable to be separated. In the second report, single Candida albicans cells were detected and quantitated in lysed whole blood samples. The lysis of blood cells has a two-fold purpose: to remove potentially interfering cells and promote the natural aggregation of yeast cells. The stacked cells showed a strong correlation between cell concentration and signal, enabling quantitation. This sample preparation and analysis technique has potential application in the food and pharmaceutical industries.
Detection of nitric oxide in a variety of single cells was accomplished by Yang et al.69 Individual cells from four model cell systems for studying nitric oxide biochemistry and release (Lymnaea stagnalis neurons, human ECV-304 cells, rat PC12 cells, and MDCK cells infected with the highly pathogenic avian influenza virus, H5N1) were analyzed by trapping nitric oxide in vivo using fluorescent probes. Cells were incubated in proteolytic enzymes and the connective cells removed and dispersed manually. Prior to cell injection, a plug of surfactant was introduced into the capillary to lyse the cell. A micromanipulator was used to position the capillary above a single cell and negative pressure was applied to inject the cell. Limits of detection were 42 amol for nitric oxide and the separation time was under three minutes.
The Yeung group70 has developed a CE method that can quantitate attomole levels of both NAD+ and NADH within a single rat myoblast. Individual cells were contained within an area on a microscope slide, injected into the capillary via pressure, and lysed using a Tesla coil. After separation of NAD+ and NADH, they were exposed to a cycling buffer and quantitated using fluorescence. Concentrations were determined for cells exposed to oxidative stress induced by peroxide and for non-stressed cells.
Overall, manual manipulation strategies are among the most used approaches for single-cell sampling, as manual manipulations encompass many different methods and are flexible. An important function of manual manipulation is the removal of the cells of interest directly from the organism; many of the sampling techniques described below are used only after the cells are in suspension.
4.2 Mechanical manipulation
Automated mechanical manipulations not only minimize user handling, they reduce the time it takes to isolate and introduce cells into a separation system. In one strategy demonstrated by Boardman and co-workers,71 parallel separation of the ganglioside metabolites of AtT-20 cells was accomplished. An array of five capillaries was used to inject single cells from etched nanoliter wells onto a poly(2-hydroxyethyl methacrylate)-coated glass substrate with a minimal amount of manual manipulation. A cell suspension was placed on the surface and the cells were allowed to settle into the wells. The cell concentration and settling time were chosen to ensure that approximately one cell was loaded per well, according to Poisson statistics. The capillaries were held in place by an alignment block and the outlets were threaded into a five-channel sheath flow cuvette for fluorescence detection. The capillary array was controlled by a micromanipulator which, when coupled with the alignment block, allowed for precise positioning of the array with respect to the cell-containing wells. Cells were aspirated into the capillary by hydrodynamic pressure and the contents separated. Approximately one nanoliter was injected into each capillary, and the single-cell results corresponded well with bulk measurements.
In another advance in the field reported by the Dovichi group,72 an indium-tin oxide-coated microfabricated device was used to isolate and capture individual NG-108 cells for analysis. The device has 512 separate 500 μm-diameter wells with 2 μm-high apertures connected to a central channel used to apply a vacuum. Cells within a suspension settled in to each well under vacuum, and once a cell had been drawn and trapped at the 2 μm-high aperture, a rinsing step removed non-trapped cells. The dimensions of the aperture prevented multiple cells from being trapped. A micromanipulator was used to bring the capillary as close as possible to a trapped cell, and both hydrodynamic and electrokinetic injections were performed simultaneously to lyse and inject the cell into the capillary for analysis by LIF using a sheath-flow cuvette for post-column detection. They describe a future application using highly multiplexed multicapillary CE instruments for the simultaneous analysis of a large number of single cells. In a final example of mechanical sample handling, Marc and co-workers73 developed fast-lysis traps for single adherent cell analysis. Rat basophilic leukemic cells, a mast cell tumor line, were introduced into the chambers, allowed to settle into wells and incubate for 12 h, loaded with Oregon Green and fluorescein, and then analyzed. For sampling, the capillary inlet was positioned 10–40 μm above a cell prior to lysis. A physiologic buffer was flowed across the cell, and simultaneously a voltage was applied below the cell for lysis, and to the capillary to initiate injection. After two minutes, the capillary inlet was moved to the next cell location and the process repeated. This is one of the few technologies applicable for analyzing adherent cells.
4.3 Microfluidic manipulation
The use of microfluidics for single-cell analysis has gained momentum in the past few years due to its low cost and the ease with which it can be hyphenated to other instrumentation. The Ramsey group74 has made several advances in using microfluidic electrophoretic devices for single-cell analysis. They created a high-throughput, monolithically integrated device and interfaced it to electrospray ionization-MS detection to continuously analyze the protein content of single human erythrocytes. Cells were loaded into a reservoir and moved by applying potentials to the four fluid reservoirs. Individual erythrocytes were manipulated into an intersection where they were lysed by rapid buffer exchange and an increase in electric field strength. The lysate was then directed into the separation channel and analytes (the dissociated heme group and heme protein subunits) were subsequently separated and detected, with an average analysis time of 12 cells/min. This represents the first report of continuous analysis of individual cells integrated with electrophoretic separation and MS detection.
Ewing and co-workers48 developed a capillary-based microfluidic platform to isolate unilamellar vesicles and then lyse them as they exited the capillary using a detergent-containing sheath-flow interface. The lysate components were then detected using amperometric EC detection. Results were reported for large unilamellar liposomes, a model system for secretory vesicles, that were loaded with the neurotransmitter dopamine. Both analyte quantitation and liposome size were determined, with zeptomole amounts of dopamine detected for each individual lysis event encapsulated within a mean liposome radius of 80 ± 18 nm.
In a device developed by Kennedy’s lab,75 insulin secretion from individual islets of Langerhans was continuously monitored and quantified by fluorescence on-chip with 15 parallel electrophoresis channels (Figure 2). Multiplexed detection was made possible with a radial microchannel design where all of the outlets converged at a shared location. Islets were contained in perfusion chambers on-chip and different amounts of glucose were introduced into the chambers. Insulin released from the islets was introduced into the assay portion of the chip and reacted with FITC-insulin and human insulin antibody. Small plugs of this mixture were introduced into the electrophoresis channels at 10 s intervals for a total of 5400 serial immunoassays per hour, providing insight into insulin secretion dynamics for single islets. This device was used to determine that chronic fatty acid exposure eliminates pulsatile insulin secretion.
Fig. 2. Channel layout and images of detailed portions of a microfluidic chip for monitoring insulin secretion from 15 independent islets.

(A) The channel network of the entire device. Microfluidic channels are indicated by solid black lines, and circles represent the fluidic reservoirs. Each type of fluidic reservoir (holding a different solution) is color-coded for clarity. (B) Side-view representation (not to scale) of an islet perfusion chamber. (C) Charge-coupled device detector-image of an on-chip flow-split that allows the fast flowing insulin sampling stream to be compatible with the slower flow of the electroosmotic flow-driven immunoassay reagents. Arrows indicate direction and estimated magnitude of flow. (D) Brightfield image of the detection area taken with the CCD camera. Flow from 15 separation channels enter the center portion of the chip before flowing out through a single waste channel (bottom center in photograph). (Reprinted with permission from ref.75 Copyright 2009, American Chemical Society.)
The Zare group76 has developed a microfluidic chip that can simultaneously perform whole gene amplification and protein separation from approximately 10 cells (Figure 3). Specifically, the content and composition of light-harvesting proteins from cyanobacterial cells and their corresponding genes were analyzed. A cell suspension was loaded into the device and cell capture was performed by manipulating valves until the requisite number of cells were contained in the lysing chamber. After lysis, the proteins were collected into an injection plug for electrophoretic separation while the remaining cell lysate was directed into another chamber for denaturing and subsequent gene analysis. Separation and denaturing took place simultaneously on-chip and native fluorescence detection was used to identify the protein complexes. This is the first system capable of performing both of these analyses on a single chip.
Fig. 3. Mask design of an integrated microfluidic device.

The channel and control layers are depicted in red and blue, respectively. Reservoirs of the channel layer were opened for reagent/cell access while reservoirs of the control layer (1–15) were connected to a pressure controller for valve actuation. For laser-induced fluorescence detection, a 532-nm laser beam was focused in the separation channel with position indicated by a red arrow near the CE (−) reservoir. A zoomed-in confocal micrograph shows the details of the core microstructures in this microdevice. (For interpretation of the references to color in this figure legend and the description in the text, the reader is referred to the Web version of this article.) (Adapted with permission from ref.76 Copyright 2011, Elsevier.)
In a recent report from 2011, Xu and Yin77 created a microfluidic chip that combines continuous cell introduction, rapid dynamic lysis, and CE-LIF with a throughput of 38 cells/min for the analysis of reduced glutathione and reactive oxygen species in single erythrocytes. Cells were directed via sheath flow streams to the cross of the chip, where the cells were driven into the separation channel by the application of voltage. Cells were rapidly lysed within 33 msec at the entry of the separation channel by surfactant and the fluorescent content separated and detected within a few seconds. The rate for introducing individual cells into the separation channel was determined by the each component’s electrophoretic resolution, as the maximum rate of introduction (~150 cells/min) can cause overlap of the signals from individual cells and complicate analysis.
4.4 Laser lysis
Laser lysis, in combination with micromanipulation or microfluidics, is a strategy used to lyse cells without detergent and quickly inject the lysate with minimal sample dilution. The approach employs a high intensity, short pulse-length laser to generate a cavitation bubble that mechanically lyses the cell in under 1 msec.78 This rapidity prevents the cell from responding to the stress of lysis, which could lead to analyte degradation or other changes in the small molecule complement of the cell.
Brown and co-workers79 performed CE-LIF analysis on the enzymatic activity of single live TF-1 cells and confirmed their results using bulk measurements from liquid chromatography coupled to MS detection. Cell suspension was placed on a glass microscope coverslip and a cell was selected. The capillary inlet was manipulated over the cell and run buffer was deposited around the physiological buffer droplet surrounding the cell. A high numerical aperture objective focused a single nanosecond laser pulse onto the cell for lysis. The firing of the laser pulse triggered the high voltage power supply and the lysate was immediately injected electrokinetically into the separation capillary for analysis. Three different proteolytic fragments (~107 fragments per cell) from the β-amyloid precursor protein were separated and detected, in addition to the native β-amyloid precursor peptide peak in single cells.
A capillary-based microelectrophoresis platform was developed by Jiang, Sims, and Allbritton80 that used laser lysis to serially analyze single rat basophilic leukemia cells loaded with fluorescein diacetate and Oregon Green. The chip contained two channels, one for electrophoresis buffer and one for physiological buffer, and an array of microwells where each cell resided once they were loaded onto the chip. The microwells provided an address for the automatic positioning of the capillary for injection and separation of the intercellular dyes following laser lysis. The capillary location remained constant and the chip was translated so that the capillary inlet was positioned within the electrophoresis buffer channel. Once analysis was complete, the chip was again translated so that the next cell could be lysed and injected. The throughput for this device was 1.8 cells/min.
Allen and co-workers81 conducted high-throughput analysis of single B-cell mitochondria by labeling the acidic components prior to lysis with Oregon Green diacetate succinimidyl ester, a membrane-permeable dye, and using a membrane-permeable base to raise the intramitochondrial pH (Figure 4). Laser lysis on a glass microfluidic chip coupled with fluorescence detection was used to lyse the mitochondria and separate and detect the derivatized contents while preventing dilution of the sample. The targeted organelle was selected from a group of mitochondria and centered in the focus region for lysis. After lysis by a nanosecond ultraviolet laser pulse, the contents diffused and were separated by on-chip electrophoresis; analyzed volumes were calculated to be one attoliter.
Fig. 4. Instrument to isolate and characterize subcellular organelles using CE-LIF.
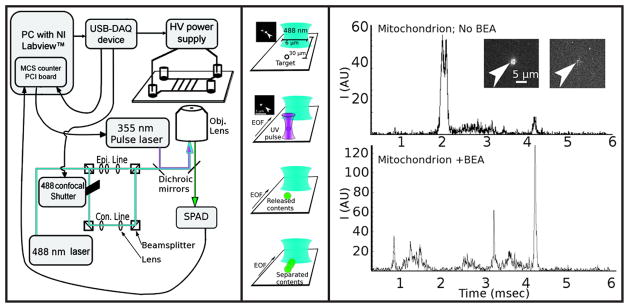
(Left) Schematic of the CE-LIF instrument, including the connections among the modules and essential optics. Epi. = epifluorescence optics, Con. = confocal optics, Obj. = objective lens (Center) Schematic showing the sequence of events in a capillary electrophoresis experiment, starting with a target aligned in the UV laser focus, which causes the target to be lysed with a single nanosecond UV laser pulse; the insets show the target (arrow) before and after lysis. The released components are separated as they travel toward and across the probe volume (blue elliptical focus). (Right) Single-mitochondrion electropherograms obtained without the use of benzylethanolamine (BEA) (top trace) and with BEA (bottom trace). Inset shows before and after photolysis of a mitochondrion prior to capillary electrophoresis separation. (Reprinted with permission from ref.81 Copyright 2009, American Chemical Society.)
4.5 Optical trapping
First used for biological work in 1987 by Ashkin et al.,82,83 optical traps are becoming increasingly popular as a tool for cellular and subcellular manipulations; sample types studied include yeast,62,84 bacteria,82,85 neurons,86 and spermatozoa.87,88 Optical traps make use of the forces generated by light interacting with a dielectric object through scattering and refraction.
Although optical traps are a widespread technique for single-cell manipulations, interfacing a trap to an electrophoresis instrument is less common. Prior to 2008, there were only a few papers demonstrating this for a CE instrument, although hyphenating a trap to a microfluidic device is more prevalent.39,89–92 In 2011, Cecala and Sweedler93 created a hyphenated optical trap-CE-LINF instrument and used it for the manipulation and analysis of single pinealocytes, the primary cells of the pineal gland. Several indolamines have been identified and quantified within these cells, including serotonin and N-acetylserotonin.
5. Conclusions and future work
Single-cell electrophoretic analyses have expanded our knowledge of cell-to-cell heterogeneity, allowed for the determination of statistically significant differences between cells exposed to different environments, and enabled the physiological functions of several compounds to be determined. Tracking cell-to-cell variability also promotes a deeper understanding of biological function and has the potential to elucidate not only intercellular information but also interactions within a local network.
Future developments in single-cell measurements will focus on technological aspects such as expanding the number of detectable compounds per sample by using multiple fluorescent reagents to derivatize a larger variety of analyte types, and employing a complimentary multiple detection scheme on-chip, either in series or in parallel (such as LIF coupled to MS). In terms of sampling, we expect more robust and automated approaches to be developed. Hyphenation of microelectrophoretic systems with a number of other technologies, such as cell-sorting or manipulation techniques that rely on magnetophoretic properties,94–96 optically-induced dielectrophoresis,97–99 optoelectronic traps,100 microvortices,101–103 or digital microfluidics,104,105 will enable a number of exciting studies. These technologies have already been paired with microfluidic devices for cell manipulation and mechanical studies, and adding a separation step could further enhance the information content gathered and allow for increased automation. These enhanced sampling approaches will be applied to a greater range of applications in neuroscience, development and disease research.
Acknowledgments
The project described was supported by Award Number P30 DA018310 from the National Institute on Drug Abuse (NIDA) and by Award No. 2 RO1DE018866 from the National Institute of Dental and Craniofacial Research (NIDCR) and the Office of the Director (OD), National Institutes of Health (NIH). The content is solely the responsibility of the authors and does not necessarily represent the official views of the awarding agencies.
References
- 1.Lapainis T, Scanlan C, Rubahkin SS, Sweedler JV. Anal Bioanal Chem. 2007;387:97–105. doi: 10.1007/s00216-006-0775-9. [DOI] [PubMed] [Google Scholar]
- 2.Li G-W, Xie XS. Nature. 2011;475:308–315. doi: 10.1038/nature10315. [DOI] [PMC free article] [PubMed] [Google Scholar]
- 3.de Souza N. Nature Meth. 2011;8:307. [Google Scholar]
- 4.Leslie M. Science. 2011;331:24–26. doi: 10.1126/science.331.6013.24-a. [DOI] [PubMed] [Google Scholar]
- 5.Rubakhin SS, Romanova EV, Nemes P, Sweedler JV. Nature Meth. 2011;8:S20–S29. doi: 10.1038/nmeth.1549. [DOI] [PMC free article] [PubMed] [Google Scholar]
- 6.Lin Y, Trouillon Rl, Safina G, Ewing AG. Anal Chem. 2011;83:4369–4392. doi: 10.1021/ac2009838. [DOI] [PMC free article] [PubMed] [Google Scholar]
- 7.Vesterberg O. J Chromatogr. 1989;480:3–19. doi: 10.1016/s0021-9673(01)84276-x. [DOI] [PubMed] [Google Scholar]
- 8.Smithies O. Biochem J. 1955;61:629–641. doi: 10.1042/bj0610629. [DOI] [PMC free article] [PubMed] [Google Scholar]
- 9.Hydén H, Bjurstam K, McEwen B. Anal Biochem. 1966;17:1–15. doi: 10.1016/0003-2697(66)90002-9. [DOI] [PubMed] [Google Scholar]
- 10.Matioli GT, Niewisch HB. Science. 1965;150:1824–1826. doi: 10.1126/science.150.3705.1824. [DOI] [PubMed] [Google Scholar]
- 11.Rüchel R. J Chromatogr. 1977;132:451–468. doi: 10.1016/s0021-9673(00)82909-x. [DOI] [PubMed] [Google Scholar]
- 12.Anderson BB, Chen G, Gutman DA, Ewing AG. J Neurosci Methods. 1999;88:153–161. doi: 10.1016/s0165-0270(99)00024-2. [DOI] [PubMed] [Google Scholar]
- 13.Anderson BB, Ewing AG. J Pharm Biomed Anal. 1999;19:15–32. doi: 10.1016/s0731-7085(98)00088-0. [DOI] [PubMed] [Google Scholar]
- 14.Anderson BB, Zerby SE, Ewing AG. J Neurosci Methods. 1999;88:163–170. doi: 10.1016/s0165-0270(99)00023-0. [DOI] [PubMed] [Google Scholar]
- 15.Chen G, Ewing A. Brain Res. 1995;701:167–174. doi: 10.1016/0006-8993(95)00989-9. [DOI] [PubMed] [Google Scholar]
- 16.Fuller RR, Moroz LL, Gillette R, Sweedler JV. Neuron. 1998;20:173–181. doi: 10.1016/s0896-6273(00)80446-8. [DOI] [PubMed] [Google Scholar]
- 17.Miao H, Rubahkin SS, Sweedler JV. Anal Bioanal Chem. 2003;377:1007–1013. doi: 10.1007/s00216-003-2191-8. [DOI] [PubMed] [Google Scholar]
- 18.Olefirowicz T, Ewing A. J Neurosci Methods. 1990;34:11–15. doi: 10.1016/0165-0270(90)90036-f. [DOI] [PubMed] [Google Scholar]
- 19.Wallingford RA, Ewing AG. Anal Chem. 2001;60:1972–1975. doi: 10.1021/ac00169a027. [DOI] [PubMed] [Google Scholar]
- 20.Kennedy RT, Oates MD, Cooper BR, Nickerson B, Jorgenson JW. Science. 1989;246:57–63. doi: 10.1126/science.2675314. [DOI] [PubMed] [Google Scholar]
- 21.Oates MD, Cooper BR, Jorgenson JW. Anal Chem. 1990;62:1573–1577. doi: 10.1021/ac00214a006. [DOI] [PubMed] [Google Scholar]
- 22.Gunasekera N, Olson KJ, Musier-Forsyth K, Arriaga EA. Anal Chem. 2004;76:655–662. doi: 10.1021/ac034916a. [DOI] [PubMed] [Google Scholar]
- 23.Hu S, Zhang L, Krylov SN, Dovichi NJ. Anal Chem. 2003;75:3495–3501. doi: 10.1021/ac034153r. [DOI] [PubMed] [Google Scholar]
- 24.Johnson RD, Navratil M, Poe BG, Xiong G, Olson KJ, Ahmadzadeh H, Andreyev D, Duffy CF, Arriaga EA. Anal Bioanal Chem. 2007;387:107–118. doi: 10.1007/s00216-006-0689-6. [DOI] [PubMed] [Google Scholar]
- 25.Lillard S, Yeung E, McCloskey M. Anal Chem. 1996;68:2897–2904. doi: 10.1021/ac960412j. [DOI] [PubMed] [Google Scholar]
- 26.Xue Q, Yeung ES. Anal Chem. 1994;66:1175–1178. doi: 10.1021/ac00079a036. [DOI] [PubMed] [Google Scholar]
- 27.Krylov SN, Dovichi NJ. Electrophoresis. 2000;21:767–773. doi: 10.1002/(SICI)1522-2683(20000301)21:4<767::AID-ELPS767>3.0.CO;2-E. [DOI] [PubMed] [Google Scholar]
- 28.Krylov SN, Zhang Z, Chan NW, Arriaga EA, Palcic MM, Dovichi NJ. Cytometry. 1999;37:14–20. doi: 10.1002/(sici)1097-0320(19990901)37:1<14::aid-cyto2>3.0.co;2-j. [DOI] [PubMed] [Google Scholar]
- 29.Chen Y, Xiong G, Arriaga EA. Electrophoresis. 2007;28:2406–2415. doi: 10.1002/elps.200600628. [DOI] [PubMed] [Google Scholar]
- 30.Cruz L, Moroz LL, Gillette R, Sweedler JV. J Neurochem. 1997;69:110–115. doi: 10.1046/j.1471-4159.1997.69010110.x. [DOI] [PubMed] [Google Scholar]
- 31.Floyd PD, Moroz LL, Gillette R, Sweedler JV. Anal Chem. 1998;70:2243–2247. doi: 10.1021/ac9713013. [DOI] [PubMed] [Google Scholar]
- 32.Jorgenson JW, Lukacs KD. Clin Chem. 1981;27:1551–1553. [PubMed] [Google Scholar]
- 33.Jorgenson JW, Lukacs KD. Anal Chem. 1981;53:1298–1302. [Google Scholar]
- 34.Arcibal IG, Santillo MF, Ewing AG. Anal Bioanal Chem. 2007;387:51–57. doi: 10.1007/s00216-006-0690-0. [DOI] [PMC free article] [PubMed] [Google Scholar]
- 35.Ge S, Koseoglu S, Haynes CL. Anal Bioanal Chem. 2010;397:3281–3304. doi: 10.1007/s00216-010-3843-0. [DOI] [PubMed] [Google Scholar]
- 36.Huang W, Ai F, Wang Z, Cheng J. J Chromatogr B. 2008;866:104–122. doi: 10.1016/j.jchromb.2008.01.030. [DOI] [PubMed] [Google Scholar]
- 37.Olson KJ, Ahmadzadeh H, Arriaga EA. Anal Bioanal Chem. 2005;382:906–917. doi: 10.1007/s00216-005-3135-2. [DOI] [PubMed] [Google Scholar]
- 38.Kenyon SM, Meighan MM, Hayes MA. Electrophoresis. 2011;32:482–493. doi: 10.1002/elps.201000469. [DOI] [PubMed] [Google Scholar]
- 39.Ros A, Hellmich W, Regtmeier J, Duong TT, Anselmetti D. Electrophoresis. 2006;27:2651–2658. doi: 10.1002/elps.200500923. [DOI] [PubMed] [Google Scholar]
- 40.Sims CE, Allbritton NL. Lab Chip. 2007;7:423–440. doi: 10.1039/b615235j. [DOI] [PubMed] [Google Scholar]
- 41.Zare RN, Kim S. Annu Rev Biomed Eng. 2010;12:187–201. doi: 10.1146/annurev-bioeng-070909-105238. [DOI] [PubMed] [Google Scholar]
- 42.Landers J, editor. Handbook of Capillary and Microchip Electrophoresis and Associated Microtechniques. 3. CRC Press; 2007. [Google Scholar]
- 43.Hellmich W, Greif D, Pelargus C, Anselmetti D, Ros A. J Chromatogr. 2006;1130:195–200. doi: 10.1016/j.chroma.2006.06.008. [DOI] [PubMed] [Google Scholar]
- 44.Hietpas PB, Ewing AG. J Liq Chromatogr Relat Technol. 1995;18:3557–3576. [Google Scholar]
- 45.Kim W-S, Dahlgren RL, Moroz LL, Sweedler JV. Anal Chem. 2007;74:5641–5620. doi: 10.1021/ac025917q. [DOI] [PubMed] [Google Scholar]
- 46.Fang H, Vickrey TL, Venton BJ. Anal Chem. 2011;83:2258–2264. doi: 10.1021/ac103092z. [DOI] [PMC free article] [PubMed] [Google Scholar]
- 47.Kristensen HK, Lau YY, Ewing AG. J Neurosci Methods. 1994;51:183–188. doi: 10.1016/0165-0270(94)90009-4. [DOI] [PubMed] [Google Scholar]
- 48.Omiatek DM, Santillo MF, Heien ML, Ewing AG. Anal Chem. 2009;81:2294–2302. doi: 10.1021/ac802466g. [DOI] [PMC free article] [PubMed] [Google Scholar]
- 49.Amantonico A, Urban PL, Zenobi R. Anal Bioanal Chem. 2010;398:2493–2504. doi: 10.1007/s00216-010-3850-1. [DOI] [PubMed] [Google Scholar]
- 50.Gutstein HB, Morris JS, Annangudi SP, Sweedler JV. Mass Spectrom Rev. 2008;27:316–330. doi: 10.1002/mas.20161. [DOI] [PMC free article] [PubMed] [Google Scholar]
- 51.Haselberg R, de Jong GJ, Somsen GW. Electrophoresis. 2010;32:66–82. doi: 10.1002/elps.201000364. [DOI] [PubMed] [Google Scholar]
- 52.Lapainis T, Rubahkin SS, Sweedler JV. Anal Chem. 2009;81:5858–5864. doi: 10.1021/ac900936g. [DOI] [PMC free article] [PubMed] [Google Scholar]
- 53.Nemes P, Knolhoff AM, Rubakhin SS, Sweedler JV. Anal Chem. 2011;83:6810–6817. doi: 10.1021/ac2015855. [DOI] [PMC free article] [PubMed] [Google Scholar]
- 54.Perry M, Li Q, Kennedy RT. Anal Chim Acta. 2009;653:1–22. doi: 10.1016/j.aca.2009.08.038. [DOI] [PMC free article] [PubMed] [Google Scholar]
- 55.Bass DA, Parce JW, Dechatelet LR, Szejda P, Seeds MC, Thomas M. J Immunol. 1983;130:1910–1917. [PubMed] [Google Scholar]
- 56.Dalerba P, Dylla SJ, Park I-K, Liu R, Wang X, Cho RW, Hoey T, Gurney A, Huang EH, Simeone DM, Shelton AA, Parmiani G, Castelli C, Clarke MF. Proc Natl Acad Sci U S A. 2007;104:10158–10163. doi: 10.1073/pnas.0703478104. [DOI] [PMC free article] [PubMed] [Google Scholar]
- 57.Davey HM, Kell DB. Microbiol Rev. 1996;60:641–696. doi: 10.1128/mr.60.4.641-696.1996. [DOI] [PMC free article] [PubMed] [Google Scholar]
- 58.Fernandes RL, Nierychlo M, Lundin L, Pedersen AE, Tellez PEP, Dutta A, Carlquist M, Bolic A, Schäpper D, Brunetti AC, Helmark S, Heins AL, Jensen AD, Nopens I, Rottwitt K, Szita N, van Elsas JD, Nielsen PH, Martinussen J, Sørensen SJ, Lantz AE, Gernaey KV. Biotechnol Adv. 2011;29:575–599. doi: 10.1016/j.biotechadv.2011.03.007. [DOI] [PubMed] [Google Scholar]
- 59.Müller S, Nebe-von-Caron G. FEMS Microbiol Rev. 2010 doi: 10.1111/j.1574-6976.2010.00214.x. [DOI] [PubMed] [Google Scholar]
- 60.Newman S, JR, Ghaemmaghami S, Ihmels J, Breslow DK, Noble M, DeRisi JL, Weissman JS. Nature. 2006;441:840–846. doi: 10.1038/nature04785. [DOI] [PubMed] [Google Scholar]
- 61.Quintana E, Shackleton M, Sabel MS, Fullen DR, Johnson TM, Morrison SJ. Nature. 2008;456:593–598. doi: 10.1038/nature07567. [DOI] [PMC free article] [PubMed] [Google Scholar]
- 62.Ando J, Bautista G, Smith N, Fujita K, Daria VR. Rev Sci Instrum. 2008;79:103705. doi: 10.1063/1.2999542. [DOI] [PubMed] [Google Scholar]
- 63.Maghelli N, Tolić-N⊘rrelykke IM. Methods Cell Biol. 2010;97:173–183. doi: 10.1016/S0091-679X(10)97010-6. [DOI] [PubMed] [Google Scholar]
- 64.Schuetze K, Niyaz Y, Stich M, Buchstaller A. Methods Cell Biol. 2007;82:649–673. doi: 10.1016/S0091-679X(06)82023-6. [DOI] [PubMed] [Google Scholar]
- 65.Jeffries GDM, Edgar JS, Zhao Y, Shelby JP, Fong C, Chiu DT. Nano Lett. 2007;7:415–420. doi: 10.1021/nl0626784. [DOI] [PMC free article] [PubMed] [Google Scholar]
- 66.Ewing A. J Neurosci Methods. 1993;48:215–224. doi: 10.1016/0165-0270(93)90093-7. [DOI] [PubMed] [Google Scholar]
- 67.Lantz AW, Brehm-Stecher BF, Armstrong DW. Electrophoresis. 2008;29:2477–2484. doi: 10.1002/elps.200700835. [DOI] [PubMed] [Google Scholar]
- 68.Lantz AW, Bisha B, Tong M-Y, Nelson RE, Brehm-Stecher BF, Armstrong DW. Electrophoresis. 2010;31:2849–2853. doi: 10.1002/elps.201000159. [DOI] [PubMed] [Google Scholar]
- 69.Yang Q, Zhang X, Bao X, Lu H, Zhang W, Wu W, Miao H, Jiao B. J Chromatogr. 2008;1201:120–127. doi: 10.1016/j.chroma.2008.06.001. [DOI] [PubMed] [Google Scholar]
- 70.Xie W, Xu A, Yeung ES. Anal Chem. 2009;81:1280–1284. doi: 10.1021/ac802249m. [DOI] [PubMed] [Google Scholar]
- 71.Boardman AK, McQuaide SC, Zhu C, Whitmore CD, Lidstrom ME, Dovichi NJ. Anal Chem. 2008;80:7631–7634. doi: 10.1021/ac800890b. [DOI] [PMC free article] [PubMed] [Google Scholar]
- 72.Boardman A, Chang T, Folch A, Dovichi NJ. Anal Chem. 2010;82:9959–9961. doi: 10.1021/ac1022716. [DOI] [PMC free article] [PubMed] [Google Scholar]
- 73.Marc PJ, Sims CE, Bachman M, Li GP, Allbritton NL. Lab Chip. 2008;8:710. doi: 10.1039/b719301g. [DOI] [PMC free article] [PubMed] [Google Scholar]
- 74.Mellors JS, Jorabchi K, Smith LM, Ramsey JM. Anal Chem. 2010;82:967–973. doi: 10.1021/ac902218y. [DOI] [PMC free article] [PubMed] [Google Scholar]
- 75.Dishinger JF, Reid KR, Kennedy RT. Anal Chem. 2009;81:3119–3127. doi: 10.1021/ac900109t. [DOI] [PMC free article] [PubMed] [Google Scholar]
- 76.Chueh B-h, Li C-W, Wu H, Davison M, Wei H, Bhaya D, Zare RN. Anal Biochem. 2011;411:64–70. doi: 10.1016/j.ab.2010.12.028. [DOI] [PubMed] [Google Scholar]
- 77.Xu C-X, Yin X-F. J Chromatogr. 2011;1218:726–732. doi: 10.1016/j.chroma.2010.11.049. [DOI] [PubMed] [Google Scholar]
- 78.Quinto-Su PA, Lai HH, Yoon HH, Sims CE, Allbritton NL, Venugopalan V. Lab Chip. 2008;8:408. doi: 10.1039/b715708h. [DOI] [PMC free article] [PubMed] [Google Scholar]
- 79.Brown RB, Hewel JA, Emili A, Audet J. Cytometry. 2010;77A:347–355. doi: 10.1002/cyto.a.20880. [DOI] [PubMed] [Google Scholar]
- 80.Jiang D, Sims CE, Allbritton NL. Electrophoresis. 2010;31:2558–2565. doi: 10.1002/elps.201000054. [DOI] [PMC free article] [PubMed] [Google Scholar]
- 81.Allen PB, Doepker BR, Chiu DT. Anal Chem. 2009;81:3784–3791. doi: 10.1021/ac900099y. [DOI] [PMC free article] [PubMed] [Google Scholar]
- 82.Ashkin A, Dziedzic JM. Science. 1987;235:1517–1520. doi: 10.1126/science.3547653. [DOI] [PubMed] [Google Scholar]
- 83.Ashkin A, Dziedzic JM, Yamane T. Nature. 1987;330:769–771. doi: 10.1038/330769a0. [DOI] [PubMed] [Google Scholar]
- 84.Volpe G, Singh GP, Petrov D. Appl Phys Lett. 2006;88:231106. [Google Scholar]
- 85.Alexander T, Pellegrino P, Gillespie J. Appl Spectrosc. 2003;57:1340–1345. doi: 10.1366/000370203322554482. [DOI] [PubMed] [Google Scholar]
- 86.Carnegie DJ, Stevenson DJ, Mazilu M, Gunn-Moore F, Dholakia K. Opt Express. 2008;16:10507–10517. doi: 10.1364/oe.16.010507. [DOI] [PubMed] [Google Scholar]
- 87.Nascimento JL, Botvinick EL, Shi LZ, Durrant B, Berns MW. J Biomed Opt. 2006;11:044001. doi: 10.1117/1.2337559. [DOI] [PubMed] [Google Scholar]
- 88.Shao B, Shi LZ, Nascimento JM, Botvinick EL, Ozkan M, Berns MW, Esener SC. Biomed Microdevices. 2007;9:361–369. doi: 10.1007/s10544-006-9041-3. [DOI] [PubMed] [Google Scholar]
- 89.Hellmich W, Pelargus C, Leffhalm K, Ros A, Anselmetti D. Electrophoresis. 2005;26:3689–3696. doi: 10.1002/elps.200500185. [DOI] [PubMed] [Google Scholar]
- 90.Munce NR, Li J, Herman PR, Lilge L. Anal Chem. 2004;76:4983–4989. doi: 10.1021/ac0496906. [DOI] [PubMed] [Google Scholar]
- 91.Valley JK, Ohta AT, Hsu H-Y, Neale SL, Jamshidi A, Wu MC. IEEE Trans Biomed Circuits Syst. 2009;3:424–431. doi: 10.1109/TBCAS.2009.2031329. [DOI] [PMC free article] [PubMed] [Google Scholar]
- 92.Wu H, Wheeler A, Zare RN. Proc Natl Acad Sci U S A. 2004;101:12809–12813. doi: 10.1073/pnas.0405299101. [DOI] [PMC free article] [PubMed] [Google Scholar]
- 93.Cecala C, Rubhakin SS, Sweedler JV. Analyst. 2011 submitted. [Google Scholar]
- 94.Adams JD, Kim U, Soh HT. Proc Natl Acad Sci U S A. 2008;105:18165–18170. doi: 10.1073/pnas.0809795105. [DOI] [PMC free article] [PubMed] [Google Scholar]
- 95.Chen C-L, Chen K-C, Pan Y-C, Lee T-P, Hsiung L-C, Lin C-M, Chen C-Y, Lin C-H, Chiang B-L, Wo AM. Lab Chip. 2011;11:474. doi: 10.1039/c0lc00332h. [DOI] [PubMed] [Google Scholar]
- 96.Song S-H, Lee H-L, Min YH, Jung H-I. Sens Actuators B Chem. 2009;141:210–216. [Google Scholar]
- 97.Chiou PY, Ohta AT, Wu MC. Nature. 2005;436:370–372. doi: 10.1038/nature03831. [DOI] [PubMed] [Google Scholar]
- 98.Lin Y-H, Lee G-B. Sens Actuators B Chem. 2010;145:854–860. doi: 10.1016/j.snb.2010.01.063. [DOI] [PMC free article] [PubMed] [Google Scholar]
- 99.Lin Y-H, Lin W-Y, Lee G-B. IEEE Nanotechnol Mag. 2009;3:6–11. [Google Scholar]
- 100.Kühn S, Phillips BS, Lunt EJ, Hawkins AR, Schmidt H. Lab Chip. 2009;10:189. doi: 10.1039/b915750f. [DOI] [PMC free article] [PubMed] [Google Scholar]
- 101.Chiu DT. Anal Bioanal Chem. 2006;387:17–20. doi: 10.1007/s00216-006-0611-2. [DOI] [PubMed] [Google Scholar]
- 102.Lin C-M, Lai YS, Liu HP, Chen C-Y, Wo AM. Anal Chem. 2008;80:8937–8945. doi: 10.1021/ac800972t. [DOI] [PubMed] [Google Scholar]
- 103.Stott SL, Hsu C-H, Tsukrov DI, Yu M, Miyamoto DT, Waltman BA, Rothenberg SM, Shah AM, Smas ME, Korir GK, Floyd FP, Gilman AJ, Lord JB, Winokur D, Springer S, Irimia D, Nagrath S, Sequist LV, Lee RJ, Isselbacher KJ, Maheswaran S, Haber DA, Toner M. Proc Natl Acad Sci U S A. 2010;107:18392–18397. doi: 10.1073/pnas.1012539107. [DOI] [PMC free article] [PubMed] [Google Scholar]
- 104.Au SH, Kumar P, Wheeler AR. Langmuir. 2011;27:8586–8594. doi: 10.1021/la201185c. [DOI] [PubMed] [Google Scholar]
- 105.Jebrail MJ, Yang H, Mudrik JM, Lafrenière NM, McRoberts C, Al-Dirbashi OY, Fisher L, Chakraborty P, Wheeler AR. Lab Chip. 2011;11:3218. doi: 10.1039/c1lc20524b. [DOI] [PubMed] [Google Scholar]