

Abstract
Introduction
Given the growing importance in clinical practice of transrectal real-time sonoelastography of the prostate, it is important to define normal patterns correlated to volume growth and reconsider the technical problems.
Materials and methods
We selected a sample of 100 men aged 30 to 87 with prostate volumes ranging from 20 to 100 cc. Strain images were obtained using an end-fire convex probe. The elasticity patterns of the various anatomical zones of the prostate were compared with the volume.
Results
The peripheral zone showed intermediate elasticity in 100% of cases regardless of the volume. We found some rare small areas of more limited elasticity in 23% of cases, among patients over 40. The posterior side of the central zone exhibited intermediate elasticity, and relative inelasticity was observed on the lateral side and at the base in 79% of cases. The entire central zone appeared compliant in 15% of cases and inelastic in 6%. The transition zone findings were stratified according to gland volume. When the volume was less than 45 cc, the transition zone was elastic in 67% of cases, inhomogeneously inelastic in 22%, and uniformly inelastic in 11%. In glands larger than 45 cc, the appearance was mainly elastic in 31% of cases, inhomogeneously inelastic in 57%, and uniformly inelastic in 12%.
Conclusions
Real-time elastography can distinguish the elastic properties of the prostate and define the normal patterns associated with increases in gland volume.
Keywords: Elastography, Sonoelastography, Ultrasound, Prostate
Sommario
Introduzione
In relazione al ruolo che sta assumendo la sonoelastografia prostatica transrettale nella pratica clinica, emerge la necessità di definire la semeiologia dei quadri di normalità correlati alle fisiologiche variazioni del volume ghiandolare e riconsiderare le problematiche tecniche dell’esame.
Materiali e metodi
Sulla base di specifici requisiti sono stati selezionati 100 soggetti (età 30–87 anni), con prostata di volume tra 20 e 100 cc. Mediante sonda convex end-fire sono stati analizzati i pattern di elasticità delle diverse zone anatomiche della prostata, correlati con il volume prostatico.
Risultati
La zona periferica ha mostrato elasticità prevalentemente intermedia nel 100% dei casi indipendentemente dal volume, con rare aree di minore elasticità nei 23% dei casi in soggetti oltre i 40 anni. La zona centrale ha presentato elasticità intermedia del versante posteriore e ridotta elasticità del versante laterale e basale nel 79%; nel 15% e nel 6% dei casi si è osservato rispettivamente aspetto elastico intermedio e anelastico di tutta la zona centrale. La valutazione dei pattern della zona transizionale è stata condotta ponendo un cut-off volumetrico di 45 cc. Per volume <45 cc, nel 67% dei casi era prevalentemente elastica, nel 22% anelastica disomogenea e nel 11% anelastica omogenea. Per volume >45 cc, nel 31% dei casi era prevalentemente elastica, nel 57% anelastica disomogenea e nel 12% anelastica omogenea.
Conclusioni
L’elastografia si è dimostrata in grado di differenziare le proprietà elastiche delle componenti strutturali della prostata in relazione al modello zonale e in funzione delle variazioni indotte dell’incremento volumetrico ghiandolare.
Introduction
Because prostate disease affects such a large portion of the population, it is attracting increasing interest and stimulating research aimed at developing new techniques for studying it. Diagnosis of prostate disease is currently based on five methods, whose importance is universally acknowledged: digital exploration of the rectum (DRE), prostate specific antigen assays (PSA), transrectal ultrasonography (TRUS), magnetic resonance imaging (MRI), and ultrasound (US)-guided biopsy. Analyzed individually, each of these methods exhibits limitations, so various types of data must be combined to ensure an accurate diagnosis.
The most widely used imaging method is TRUS, which is simple to perform and has a favorable cost-benefit ratio. It is used mainly for assessing benign prostatic hypertrophy (BPH) and in screening programs to detect prostate cancer [1]. Sonographic diagnosis of prostate cancer is based largely on the identification of hypoechoic lesions that are clearly distinct from the normal glandular tissue, but this finding is documented in only 60–70% of all cases [2]. It is also relatively nonspecific (since hypoechoic lesions are also associated with acute and chronic prostatitis). MRI of the prostate is not widely used. Because of its high cost, this method is reserved for selected cases and for preoperative staging of prostate tumors [3,4]. The absence of an acceptably sensitive, specific screening method has favored the systematic use of prostate biopsy in patients with elevated PSA levels (TRUS is used mainly for guidance during the biopsy procedure) [5]. As a result of this trend, however, the number of samples collected has increased progressively, in an attempt to improve detection rates, and this has increased both the costs and morbidity associated with prostate disease [6].
A more recent arrival in this field is real-time elastography (RTE), which uses ultrasound to analyze the mechanical properties of a tissue based on the relative elasticity of its components, the premise being that normal and pathological tissues will have different elasticity coefficients [7]. RTE was initially proposed as a tool for characterizing breast lumps, thyroid nodules, and lymph nodes [8–13]; only later was it used to identify prostate cancer [6,14–18]. Most of the scientific literature on RTE is focused on pathological findings: little attention has been devoted to defining the elastographic appearance of the normal prostate. Given its increasing importance in clinical practice, we felt it would be useful to analyze the elastographic patterns associated with the normal prostate gland and the physiological volume changes that affect it over time.
Materials and methods
From 1 January through 31 December 2010, 562 men (mean age: 66 years, range: 28–88 years) were referred to our ultrasonography (US) unit for TRUS of the prostate. The indications for the examination included one or more of the following conditions: abnormal PSA levels, ambiguous findings on DRE, micturition disturbances, hemospermia, and infertility. All 562 of these patients were also examined with RTE, which was performed with their informed consent.
For the study of normal elastographic findings associated with different-sized prostates, we selected 100 of these patients (age range: 30–87 years, mean 64 years), applying the following inclusion criteria to minimize the odds of enrolling patients with neoplastic or chronic inflammatory disease: a) no signs of inflammation; b) normal findings on DRE; c) total PSA < 4 ng/ml, PSA ratio > 0.18, and PSA density < 0.04 (this arbitrary cut-off, which is substantially low than the standard cut-off of 0.12, was chosen to optimize the chances of enrolling patients without neoplastic disease); d) TRUS negativity for structural alterations in the peripheral zone, and prostate volume between 20 cc and 100 cc. (The decision to exclude patients with prostates larger than 100 cc was based on the current limits of elastography in analyzing signals in deep fields.). Table 1 shows the characteristics of the population selected for study, subdivided by age and prostate volume. The principal indications for TRUS in this population were micturition disturbances (in patients over 40) and infertility (in those who were younger).
Table 1.
Distribution of cases selected by age and prostate volume.
| No. subjects | |
|---|---|
| Age (y) | |
| 31–40 | 12 |
| 41–50 | 13 |
| 51–60 | 21 |
| 61–70 | 23 |
| 71–80 | 24 |
| 81–90 | 7 |
| 100 | |
| Volume | |
| 21–30 cc | 14 |
| 31–40 cc | 14 |
| 41–50 cc | 22 |
| 51–60 cc | 15 |
| 61–70 cc | 12 |
| 71–80 cc | 10 |
| 81–90 cc | 8 |
| 91–100 cc | 5 |
| 100 | |
The study protocol was approved by the Ethics Committee of the Institute and compliant with the standards set forth in the Declaration of Helsinki. The examinations were performed with three different scanners, each equipped with a module for real-time strain imaging. The Hitachi scanners (Hi Vision EUB 8500 and Preirus; Hitachi Medical, Tokyo, Japan) were used with endocavitary end-fire transducers (4–8 MHz), and the Voluson E8 Expert (GE Healthcare, Milwakee, WI, USA) was used with a 3D endocavitary end-fire transducer (5–9 MHz). The sonographic and elastographic examinations were performed by two radiologists, each with over 20 years of experience with TRUS.
Elastographic imaging
Over the years, various authors have evaluated noninvasive methods for distinguishing different types of tissues on the basis of numerical variables extrapolated from images [19,20]. Elastography, whose underlying principles were first described by Ophir and colleagues in 1991, seems to be one of the methods best suited for systematic use [21]. The term elastography refers generically to the creation of images whose informative content can be directly correlated with the elastic properties (i.e. the compliance or deformability) of a material subjected to external stimulation. Different methods of mechanical stimulation are used to generate an elastographic response. The material can be subjected to deformation, compression, vibration or variations in the velocity, amplitude, or phase of movement. Regardless of the type of stimulation used, the assumption is that different tissues subjected to mechanical stimulation of equal intensity will give rise to vibrational movements, which differ from one another in terms of velocity, according to the Young moduli that distinguish them [22]. On the basis of these physical principles, different elastographic techniques have been developed.
Two studies in particular represented milestones for subsequent research. The first was that of Ophir et al. [23], who developed a quasi-static method that created an image representing the distribution of tissue deformation (strain) elicited by minimal compression (stress). It is based on the assumption that hard, rigid tissues will exhibit little or no deformation. The second milestone study was conducted by Parker et al. [24]. They developed a dynamic method for creating an image representing the distribution of the propagation velocities of a wave of pressure (shear wave) generated by mechanical vibration. The underlying assumption here is that sound is propagated through rigid tissues at a high velocity.
The most widely used method is currently the quasi-static procedure known as “strain imaging” because it can be performed easily with conventional ultrasound scanners. It is referred to as real-time elastography or sonoelastography. Technically speaking, it involves the analysis of spatial and temporal variations in the radiofrequency signal of the echoes induced by tissue stimulation with a series of minimal compressions and decompressions. Compression is usually generated with the sonographic probe itself, but it can also be produced by cardiac/vascular pulsations or respiratory movements. With these types of compression, the precise magnitude of the force exerted on the material is unknown, and measurement of absolute strain is impossible. Consequently, real-time elastography (RTE) provides exclusively qualitative (not quantitative) information on the relative deformability of tissues. The analysis is carried out within an area of interest (RTE-box) selected by the operator. The scanner calculates relative elasticity values for the different structural components and transforms them into a map (generally color-coded) that is superimposed on the conventional US image. The map reflects the relative elasticity of different tissues being examined. It varies according to the type of tissue present within the RTE-box, the size of the box selected by the operator, and the magnitude of the pressure exerted on the tissues.
Most of the scanners on the market today map relative elasticity values using a system of color-coding in which blue indicates tissues that are non-deformable or have a relatively low elasticity index—in general, those that are hard, rigid—and red is used for tissues that are more deformable, which usually means they are more elastic. Tissues with intermediate degrees of elasticity are represented in green. Desaturation of the basic color toward lighter hues reflects different degrees of deformability among different types of tissue, and it correlates with the dynamic range of the systems of analysis and visualization.
Elastography is based on the physiological premise that cell density is increased in most solid tumors and that this modifies the elasticity of the tissue, altering its consistency with respect to the normal tissue from which it is derived. Krouskop et al. have documented differences in the elasticity coefficients of normal and neoplastic breast and prostate tissues [7]. Chronic inflammatory lesions have lower cell densities than neoplastic lesions, but even so they are also less compliant than normal tissues. These premises underlie the new diagnostic opportunities offered by elastography, which was initially proposed as a method for tissue characterization of breast lumps, thyroid nodules, and lymph nodes [8–13]. The first reports of RTE in the examination of the prostate date back to 2005 [25].
Examination technique
A standardized examination technique is fundamental for ensuring high-quality images. The one used in our study is based on data in the literature and on our center’s cumulative experience with elastography since 2007.
At the end of a conventional TRUS examination, with the patient lying on his left side, transrectal elastography is performed with the same transducers used for TRUS. Different types of transducers can be used for elastographic studies: convex, linear, or biplanar probes with frequencies ranging from 3.5 to 12 MHz [15,26]. In our study, we used convex end-fire transducers with frequency ranges of 4–8 MHz and 5–9 MHz.
Reports published in 2008–2009 indicate that an elastographic examination takes 7–10 min [15,16]; those in our study lasted 3–7 min (mean: 5 min). The fact that less time was required for our examinations reflects recent software advances that improve the sensitivity of elastography. On the average, it takes 3–6 months to master the technique, but this varies depending on the number of patients examined each day [6].
The elastogram is visualized as a transparent image superimposed on the sonographic image, using the single-view or side-by-side option. In the latter case, half of the screen contains the conventional US image alone and the other shows the same image overlain with the elastographic map. It is important to select a large RTE-box that extends from the rectal wall to the floor of the bladder and includes the periprostatic adipose tissue. The size of the box depends on the fact that a certain amount of periprostatic tissue must also be included to average the strain values.
During transrectal RTE of the prostate, light pressure is exerted manually on the gland with the transducer (in a fixed position or during movement). The goal is to maintain contact with the gland without producing excessive deformation. Compression intensity is regulated on the basis of real-time feedback provided by the on-screen quality indicator scale. On the scanners used in our study, the scale ranged from 1 to 5, and as references we used levels of 2–3 for the Hitachi scanners and levels 4–5 for the GE units.
The frequency of the microcompressions should remain constant so as to generate a continuous series of images. This reduces background signals (“colored noise artifacts”)—transitory, nonreproducible flashes of blue that reflect the scanner’s inability to complete an adequate number of samples for the same target.
If the prostate is large and hypertrophic, the technique described above may not ensure adequate signal quality. In this case, it is best to use sequences of short, more intense compressions separated by pauses, during which the scanner calculates a mean deformation value for the deepest tissue levels. The compression technique must be adapted to the anatomical features of each case. The operator-dependency of this technique is largely responsible for the currently documented interobserver variability.
Elastographic studies of the breast and thyroid are performed to characterize lesions that have already been detected with US, but elastographic studies of the prostate involve the entire gland. The goal is to identify tissue changes that are not necessarily detectable on US. In general, the transducer is moved back and forth along multiple, parallel lines extending from the base of the gland to locate any lesions that require biopsy. If structural alterations have already been detected during the US examination, the transducer is positioned over the area where they are located, and a sequence of microcompressions is delivered.
The examination technique is not dependent on the type of transducer used, but the movement required to produce microcompressions varies with the type of array used (linear vs. convex). Compared with linear transducers, convex end-fire transducers facilitate the delivery of consecutive microcompressions: the compression vector is parallel to the axis of the transducer (not perpendicular, as it is in linear transducers). However, because of its geometric characteristics and reduced contact surface, the convex transducer also offers lower lateral spatial resolution and produces nonuniformly distributed pressure waves that give rise to lateral artifacts. But these limitations are clearly outweighed by the advantages of transverse scanning, which allows simultaneous visualization and comparison of both lobes of the prostate (Fig. 1a, Fig. 1b).
Figure 1.
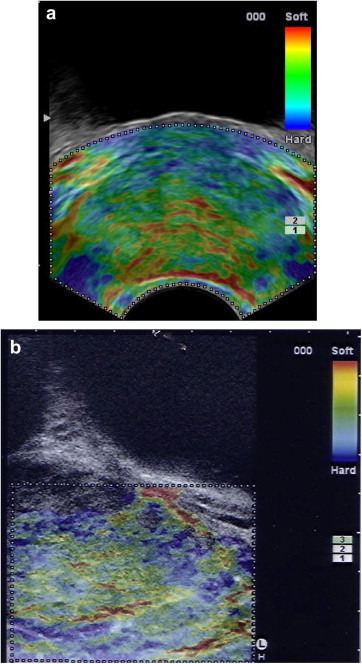
Endorectal RTE. Normal prostate. a) Transverse image obtained with a convex end-fire probe; symmetrical appearance of the elastographic signals from the two lobes; spatial resolution differs in the near and distant fields. b) Longitudinal paramedian image obtained with a linear probe; excellent spatial resolution throughout the field of view. No direct comparison with the contralateral lobe.
Sonographic analysis of the prostate anatomy is fundamental to the elastographic examination, and this is generally based on the zonal approach described by McNeal, which divides the prostate into three glandular zones (transitional, central, peripheral) and an anterior nonglandular zone consisting of stroma and muscle fibers [27] (Fig. 2a).
Figure 2.

a) McNeal’s zonal model of the prostate. b) RTE + TRUS. Transverse image of the prostate showing the anatomic components. Legend: FMS = Fibromuscular stroma; TZ = Transition zone; CZ = Central zone; PZ = Peripheral zone; U=Urethra/Verumontanum; C = Capsule; SR = soft rim artifact. RTE: typical distribution of elasticity in a normal prostate gland. Green (indicating intermediate elasticity) prevails in the PZ and CZ, with occasional red lines (soft) in the PZ. The TZ is mostly blue (stiff); red (soft), ring-shaped images are seen around in the U; the SR is red (soft).
Division of the gland into peripheral vs. central-transitional zones is also important in elastography because 70–80% of all neoplastic lesions arise in the peripheral zone [1] (Fig. 2b). This area is easy to identify at US and at RTE. The internal portion of the gland (which comprises the central and transition zones) is frequently characterized by artifacts related to the depth of these structures. Elastographic differentiation of the two components of the internal portion of the gland assumes that the two zones can also be distinguished from one another on the basal US examination. With more sophisticated scanners, this is easy to do when the prostate is small to moderate in size. In larger glands, however, it can be very difficult if not impossible because the central zone undergoes progressively intense compression by the hypertrophic transitional zone. A useful reference point for identifying the lateral side of the central zone is the thin hypoechoic interface that delimit it along the mid-portion of the prostate. Other landmarks for assessing the posterior and basal portions are the verumontanum (in transverse sections) and the ejaculatory ducts (in longitudinal sections).
Our elastographic analysis of the transitional zone provided for a volumetric cut-off of 45 cc (larger volumes are associated with significant hypertrophy) and the identification of three elastographic patterns: A) prevalence of intermediate elasticity with a periurethral nucleus of reduced elasticity; B) patches of low compliance against a background of intermediate elasticity; C) diffusely reduced elasticity.
The prostate capsule per se cannot be identified with either technique. Elastographic studies, however, include the assessment of a periprostatic “soft rim artifact,” a thin elastic border that surrounds the gland.
For a correct analysis of the gland, the deformability of the tissue has to be evaluated not only while the transducer is moved along the median line: the paramedian and posterolateral regions of both lobes also have to be scanned. If the prostate is large, the transducer must be tilted laterally to eliminate lateral artifacts related to transducer geometry. These artifacts, which consist of bright blue signals indicative of hard tissue, reflect the fact that tissue in the lateral portions of the field of view cannot be properly compressed and are therefore assigned a strain value of 0, as are tissues that are truly rigid (Fig. 3a). The operator can verify the validity of the images by modifying the view point of the transducer (Fig. 3b,c).
Figure 3.
Convex transducer; artifacts related to probe geometry. a) TRUS + RTE. Median scan. RTE: median and paramedian areas of the peripheral zone (PZ) are mapped in green and red indicating compliance; the lateral part of the PZ and the lateral parts of the central zone (CZ) appear inelastic (blue) (*) due to non-deformation artifacts; transition zone (TZ) with inhomogeneous compliance due to lateral artifacts. b) RTE + TRUS. RTE: right lateral inclination of the probe. Intermediate elasticity (green) of the lateral portions of the PZ, CZ and TZ. Pericapsular elastic border (arrow); lateral artifact in periprostatic tissue and in the posterior PZ (*). c) RTE: left lateral inclination of the probe. Same aspect observed in b); pericapsular elastic border (arrow); lateral artifact in periprostatic tissue (*).
Results
In all of the patients we examined, the peripheral zone of the prostate exhibited elasticity that was generally intermediate (coded in green) associated with linear, serpiginous, or patch-like areas in red, indicating tissue components with relatively high elasticity (Fig. 4). In 23% of the cases, however, there were occasional small areas of reduced relative elasticity represented in light-medium-blue (Fig. 5a). Both findings were independent of gland volume. The minute areas of reduced elasticity were observed in patients over the age of 40.
Figure 4.
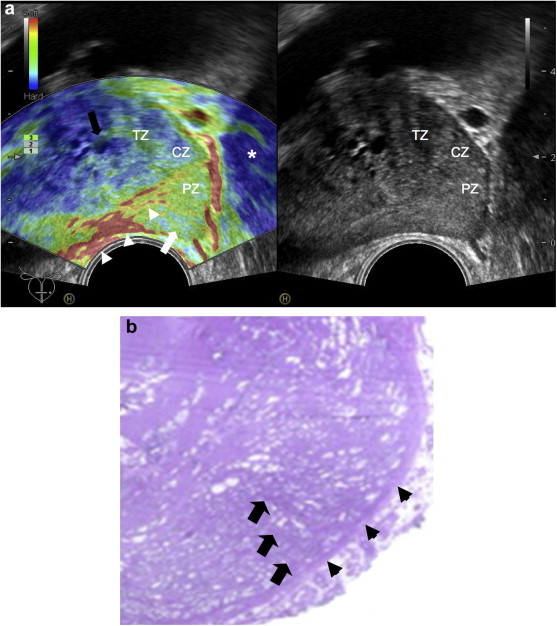
a) RTE + TRUS. RTE: peripheral zone (PZ) displays intermediate elasticity (green); patches or linear images in red indicate higher compliance, reflecting fluid within the tissue (arrowheads); thin, linear projections in light blue arranged radially (white arrow). Transition zone (TZ): double-layered microcysts (blue-green) (black arrow). Lateral artifacts (*). TRUS: Homogeneous PZ. b) Detail of PZ specimen showing the macrostructure of the tissue with evidence of stroma (arrows) and capsule (arrowheads).
Figure 5.

a) RTE + TRUS. RTE: peripheral zone (PZ) with intermediate elasticity (green) with spots of medium-blue (arrowhead). Central zone (CZ): the posterior side displays intermediate elasticity while the lateral side (light blue) appears less compliant. Transition zone (TZ): cysts with intermediate elasticity (black arrow). Upside-down V-shaped red image anterior to the verumontanum (white arrow). Periprostatic elastic rim in red. b) RTE + TRUS. RTE: In the CZ, intermediate elasticity prevails on the posterior side, while the lateral side is blue, indicating reduced compliance. The TZ with inhomogeneous reductions in elasticity (blue).
In 79% of the patients, the appearance of the posterior side of the central zone differed from that of the lateral and basal areas. Indeed, the posterior side of the gland displayed intermediate elasticity (green), whereas the lateral and basal portions appeared less compliant (light blue–blue) (Fig. 5a, b). In 15% of the cases, the central zone displayed intermediate elasticity represented by the color green (Fig. 6a), and this finding was consistently associated with a small-volume transitional zone. The remaining 6% were characterized by significant transition zone hypertrophy, and the central zone in these cases appeared thin and inelastic (blue) (Fig. 6d).
Figure 6.

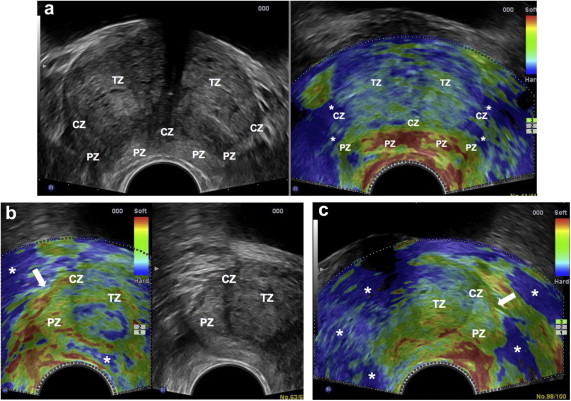
RTE at the level of the verumontanum. a) Prostate volume 20 cc: peripheral zone (PZ) and central zone (CZ): intermediate elasticity (green); transition zone (TZ) is small with reduced elasticity (blue); b) Prostate volume 28 cc; PZ and CZ intermediate elasticity. The outer portion of the TZ displays intermediate elasticity; the nucleus, reduced elasticity (*). The pericapsular elastic border appears in red. (c) Prostate volume 38 cc; PZ and CZ intermediate elasticity. The nucleus of the TZ displays reduced elasticity (*) surrounded by patches of reduced elasticity. Red, upside-down V-shaped image anterior to the verumontanum d) Prostate volume 65 cc; hypertrophy of the TZ, which is mainly green (intermediate elasticity) with a small nucleus of reduced elasticity (*). CZ with a pseudocapsular appearance, visualized in blue as an inelastic image in the periphery of the TZ. PZ intermediate elasticity. The pericapsular elastic border appears in red. (arrowhead).
In 94% of the cases, in the posterior central zone, there was a relatively soft (i.e., red) structure shaped like an upside-down “V”, a triangle, or less commonly like a ring surrounding the verumontanum (Figs. 2b, 5a, 6c and 7a).
Figure 7.

a) RTE + TRUS. Prostate volume 55 cc: Transition zone (TZ) displays reduced elasticity (blue) in the anterior half and intermediate elasticity (green) in the posterior half; double-layer (blue-green) microcysts (black arrow). Lateral side of the central zone (CZ) displays reduced compliance; red (soft) triangular image surrounding the verumontanum. Peripheral zone (PZ) with lateral artifact in blue (*); b) RTE. Prostate volume 80 cc: TZ shows mainly reduced elasticity; lateral side of the CZ shows partial reduction of elasticity; PZ shows intermediate elasticity.
The elastographic patterns of the transition zone varied with the volume of the gland (Fig. 6a, b, c, d). Volumes of <45 cc were usually associated with pattern A (67%); patterns B (22%) and C (11%) were less common. In larger glands (>45 cc), patterns A, B, and C were observed in 31%, 57%, and 12% of the cases, respectively (Figs. 6d and 7a, b).
Incidental findings included small retention cysts and rare, minute calcifications (roundish, lamellar), neither of which had any effect on the deformability characteristics of the prostate tissue: the microcysts presented intermediate elasticity or were double-layered (blue-green) (Figs. 4a, 5a and 7a). The small calcifications were also similar to the surrounding tissue in terms of relative elasticity (Fig. 8a).
Figure 8.

RTE + TRUS in BPH. The transducer is tilted to the left. a) Conventional compression: level 3 on the quality indicator scale (white arrow). Transition zone (TZ) with apparently reduced compliance (blue) of the lateral and left anterior sides (black arrows). Lamellar calculus with intermediate compliance (green) (arrowhead). b) Different ways to produce compression: quality indicator level 4 (white arrow). The lateral and left anterior sides (black arrow) of the TZ are mostly green indicating intermediate compliance. Lamellar calculus with intermediate compliance (green) (arrowhead).
The red pericapsular “soft rim artifact” was completely visualized in 12% of the patients, partially visible in 65%, and not detected at all in the remaining 23%. In all cases in which this artifact was observed (even in part), its appearance was similar on the two side of the gland (Figs. 2b, 5a, 6b and 6d).
Discussion
Real-time elastography of the prostate was initially used as a guide for biopsy of suspected prostate tumors: it displayed high sensitivity when used alone (72.6%) or with conventional diagnostic methods (84–89.5%) [17,25]. Biopsies guided by elastographic findings are from 2.9 to 4.7 times more likely to identify prostate cancer than systematic ultrasound-guided biopsies [6,18], and equally encouraging findings have been reported regarding the negative predictive value of elastography (93%). In the most optimistic estimates, biopsy can probably be avoided altogether if elastographic findings are negative [18]. The non-negligible rate of false positives reported in different series (8.5%–40%) is related to the observation of zones of reduced elasticity related to chronic inflammatory processes, glandular atrophy, and certain forms of benign prostatic hypertrophy that render the tissue less compliant than that of the normal prostate [6,26].
The elastographic findings suggestive of neoplastic disease have been well-defined. Most authors refer to those initially proposed by Konig et al., which can be summarized as follows: a) lesions with increased stiffness should raise the suspicion of malignancy; b) the elastographic findings must be reproducible when the transducer is tilted; c) suspicious lesions should have a diameter of at least 5 mm. Lesions should be considered malignant only if they satisfy all three criteria [25]. In a large series examined by Pallwein et al., patterns specific for neoplastic lesions included not only “dark blue” nodular pattern but also mosaic and patchy distributions of stiffness [26].
Thus far, less attention has been dedicated to the definition of normal findings in prostate elastography. It is important to recall that progressive hypertrophy of the internal portion of the prostate alters the glandular morphology and macrostructure, with potential effects on the elasticity of the tissue. Interest in elastographic imaging of the prostate is growing progressively in clinical settings, and for this reason it is important to define the normal range of findings as well as the artifacts that can cause diagnostic errors.
First of all, it is important to note that large studies on the elastographic patterns associated with the normal prostate have not been conducted. However, as part of a larger study aimed at defining RTE’s role in the diagnosis of prostate cancer, Ferrari et al. defined three normal patterns based on color prevalence in the different zones of the gland. They also distinguished patterns specific to the peripheral and transitional zones. For the former, which is softer, linear/serpiginous signal morphologies were associated with pattern A (homogeneous representation of red and green) or pattern B (predominantly green with smaller areas of blue and red). For the transition zone, the morphology was more heterogeneous, essentially micronodular, with patterns A, B, and C (where the color blue was predominant) [15].
This schematization meets the main diagnostic needs, but it makes no reference to the macrostructural substrates responsible for the various patterns or to physiological variations related to the volume of the prostate. Our aim was to evaluate correspondence between elastographic and anatomical patterns. To this end, we began by examining correspondence with sonographic findings in the normal prostate based on the zone concept developed by McNeal.
In all of the subjects we examined, the posterior and anterolateral portions of the peripheral zone displayed an intermediate level of elasticity represented by the color green. Within this context, there were also a few red areas characterized by greater elasticity (with a linear, serpiginous, or (less commonly) patchy distribution). These images represent the fluid component of the tissue. In some cases, they appeared to be anatomically associated with thin, anechoic, tubular or sac-like structures that were visible on US, avascular on color Doppler, and therefore presumably glandular (i.e. ducts, acini dilated secondary to content retention). In other cases, the images were not associated with any specific anatomic structures. Their presence may be somehow related to blood vessels.
In the peripheral zone, it is not uncommon (especially with the newer-generation scanners) to find thin, light blue (i.e., less elastic than the surrounding tissue) linear images arranged in a radial fashion. If we look at the macrostructural characteristics of histological preparations and consider that the stromal component is less deformable than the glandular tissue adjacent to it, it seems possible that these images represent stromal tissue.
In addition, in 23% of our patients (all men over 40 years of age whose prostates presented evidence of transition zone hypertrophy), we found small, rare areas of relatively reduced elasticity (light to medium-blue) that were not artifacts. It was not ethically feasible to biopsy these areas (the subjects we examined were all healthy), but similar images had been found in men who had undergone systematic biopsy because of pathological PSA levels, and the histology analysis in these cases had revealed glandular hyperplasia associated with varying degrees of atrophy. We therefore hypothesized that chronic pressure exerted on the peripheral zone by the transition zone might produce chronic intraglandular stasis, and the local inflammation triggered by the latter might eventually lead to glandular atrophy. Additional studies with more advanced elastographic techniques will be necessary to clarify the true nature of these images.
When the prostate was small, the central zone was usually characterized by intermediate elasticity (15% of the cases). In glands that were moderate in volume, the posterior portion of this zone displayed intermediate elasticity compared with the lateral and basal portions, which were coded as less compliant in most cases (79%). In markedly enlarged glands, the central zone displayed reduced elasticity and reduced thickness (6% of the cases). The progressive decrease in elasticity probably reflects the manner in which prostatic hypertrophy develops: in the initial phases the hypertrophic tissue exerts pressure mainly on the lateral parts of the central zone, and the posterior portion is spared; later, it compresses the entire central zone, which eventually takes on the features of a pseudocapsule. It is important to recall that the study protocol provided for exclusion of men with prostate volumes > 100 cc—that is, men with marked hypertrophy in which the central zone could no longer be identified.
In 94% of the patients we examined, the red (high elasticity) images shaped like an upside-down V, a triangle, or a ring observed in the posterior portion of the central zone, in correspondence with the verumontanum, can be attributed to an anatomic component with high relative elasticity, i.e., like that of a liquid. They might thus be caused by submucosal arterial vessels surrounding the verumontanum, which are well-visualized on color Doppler, although we cannot exclude the possibility that intraurethral secretions also contribute to these images.
In contrast to the peripheral and central zones, the transition zone has a variable elastographic appearance, which is dependent on the age-related changes that occur in the gland. In young men, the transitional zone is moderately represented, with a limited periurethral component, which is displayed as a relatively noncompliant structure. In the fourth decade of life, the volume begins to increase, and this is responsible for the hypertrophy that affects at least half of all men by the end of the fifth decade. Until the gland reaches a volume of around 45 cc, the transition zone is characterized predominantly by intermediate elasticity (67% of all cases) although it retains the relatively inelastic nucleus that has been present since youth. In the remaining cases, there is a diffuse reduction of elasticity, which may be inhomogeneous (22% of cases) or homogeneous (11%). In large glands, the transition zone generally presented uniformly reduced deformability characterized by patchy inelasticity in 57% of cases and uniform inelasticity in 12%.
In general, the reduced deformability can be explained by the structural inhomogeneity observed in some patients with hypertrophy and by the different proportions of stromal and glandular tissue, which naturally differ in terms of elasticity coefficients; it is also important to consider the effects of calcifications, which were not infrequently observed in both the peripheral and periurethral areas. In addition, the inelasticity observed in the larger prostates might reflect the technical limits of the instrument in the measurement of tissue deformability. Endorectal transducers correctly analyze the elasticity of structures lying at a depth of no more than around 50 mm; beyond that limit “stiffness artifacts” occur [6]. These intense blue artifacts are nothing more than areas of tissue whose deformability cannot be adequately evaluated by the scanner. The strain value assigned to these areas is zero—that is, the same value assigned to rigid tissue. In the presence of benign prostatic hypertrophy, this depth limit often coincides with the anterior half of the transition zone. This technical shortcoming may explain the constant presence of inelastic signals in the transition zone, as well as the variability of the imaging patterns. It is important to recall that this limitation can be at least partially overcome by varying the examination technique (i.e., in terms of transducer inclination or the manner in which micropressure pulses are applied (Fig. 8a, b).
Our review of the intraprostatic elastographic findings would not be complete without some mention of retention cysts and calcifications. In our series, the dimensions of the cysts were in the millimeter range, and they presented intermediate elasticity (green) or a double-layer appearance (blue/green). This finding, which is consistent with the possible appearances of small cysts, is different from the well-known triple-layer appearance of certain breast cysts [9], although the latter finding is sometimes seen in the prostate as well (Fig. 9). The relative elasticity of the minute (millimeter range) lamellar calcifications was no different from that of the adjacent tissue; in all probability, their small dimensions, with respect to the pressure exerted, did not create a mean strain that was different from that of the adjacent tissue. Larger calcifications usually display reduced relative elasticity compared with that of the surrounding tissue and are therefore coded in blue; in our study, we excluded subjects with large calcifications to avoid distortions of the elastographic signal.
Figure 9.

TRUS + RTE after transurethral resection – TRUS: Two microcysts (arrows) residual transition zone (TZ) tissue on the right – RTE: Cyst with triple-layered signal (arrows). Absence of the firm, periurethral nucleus in the TZ and triple-layer image (indicating the presence of liquid) in the area of the bladder neck (*) subjected to resection.
The prostate capsule cannot be identified sonographically or elastographically.
Elastography reveals, however, a thin, elastic, periprostatic border known as the “soft rim artifact,” which some authors have proposed as a marker of capsule integrity in patients with prostate cancer [6]. Its presence (in red) reflects the difference in relative elasticity between the peripheral zone of the prostate, which is covered by the capsule, and the adjacent adipose tissue, which contains pericapsular vessels of the periprostatic venous plexus. Our findings indicate that it is not always visualized: it was observed in only 73% of the subjects we examined, and complete visualization was possible on only 12%. Tests performed with different scanners by members of our group indicate, however, that visualization of this artifact may depend in part on the axial resolution and sensitivity of the scanner.
These findings in no way reduce the importance of this sign, and it should always be looked for. If it is absence or if the two sides are not symmetrical, this could be an indirect sign of neoplastic disease, even if there are no evident alterations in the elasticity of the adjacent peripheral zone.
Conclusions
Elastography is a recently developed method that is continuously evolving, and various studies are underway to evaluate its usefulness and efficacy in the different fields of application that have been identified thus far. As far as prostate disease is concerned, the results available at this time are promising, not only in terms of the method’s sensitivity but also by virtue of its high negative predictive value.
Our study shows that RTE can distinguish the elastic properties of different anatomic components of the prostate gland and identify variations in these properties that occur when the volume of the gland increases. Under normal conditions, the peripheral region of the gland, where the risk of neoplastic disease is highest, is consistently characterized by an intermediate degree of elasticity. Areas of reduced elasticity—especially those that are intense blue, reproducible, and not attributable to artifacts—should be regarded with suspicion until neoplastic disease can be excluded. The rest of the gland has greater elastographic heterogeneity, which can usually be interpreted best with simultaneous views of the two lobes. If this approach fails, further investigation is warranted. The presence of an elastic periprostatic border reflects normal extracapsular tissue, and its complete absence should be carefully investigated.
Despite its advantages and potential, RTE has certain shortcomings that have to be considered, the main one of which is operator-dependency, which influences intra- and interobserver variability. The manner in which compression/decompression is delivered varies from one operator to another. Another intrinsic limitation of this technique is that it uses manual compression to deform the tissue and assess its elasticity. Since the magnitude of this external force cannot be determined, RTE provides information only on the mean relative elasticity of each tissue (rather than absolute elasticity). For this reason, the information RTE provides is exclusively qualitative and its interpretation depends on the experience of the operator. In all probability, advanced technology will be able to overcome these limitations, integrating the qualitative information with quantitative data, but at the present, the role of the operator is fundamental. For this reason, adequate training and examination technique standardization are indispensable to avoid errors related to the presence of artifacts. Without these, elastography is unlikely to gain wide consensus in clinical settings.
These are considerations that prompted the present study, which shows that RTE can distinguish the elastic properties of different anatomic components of the prostate and identify the variations that affect as the size of the gland increases. A sound understanding of the normal elastographic appearance of the prostate and of problems related to the examination technique are fundamental for anyone interested in working with this novel diagnostic ultrasound tool.
Conflict of interest statement
The authors have no conflicts of interest to declare.
Appendix. Supplementary data
The following are the supplementary data related to this article:
References
- 1.Applewhite J.C., Matlaga B.R., McCullough D.L., Hall M.C. Transrectal ultrasound and biopsy in the early diagnosis of the prostate cancer. Cancer Control. 2001;8(2):141–150. doi: 10.1177/107327480100800204. [DOI] [PubMed] [Google Scholar]
- 2.Shinohara K., Wheeler T.M., Scardino P.T. The appearance of prostate cancer on transrectal ultrasonography: correlation of imaging and pathological examinations. J Urol. 1989;142(1):76–82. doi: 10.1016/s0022-5347(17)38666-4. [DOI] [PubMed] [Google Scholar]
- 3.Beyersdorff D., Taupitz M., Winkelmann B., Fischer T., Lenk S., Loening S.A. Patients with a history of elevated prostate-specific antigen levels and negative transrectal US-guided quadrant or sextant biopsy results: value of MR imaging. Radiology. 2002;224:701–706. doi: 10.1148/radiol.2243011553. [DOI] [PubMed] [Google Scholar]
- 4.Ikonen S., Kärkkäinen P., Kivisaari L., Salo J.O., Taari K., Vehmas T. Magnetic resonance imaging of clinically localized prostatic cancer. J Urol. 1998;159:915–919. [PubMed] [Google Scholar]
- 5.Kelloff G.J., Choyke P., Coffey D.S. Challenges in clinical prostate cancer. Role of imaging. AJR Am J Roentgenol. 2009;192:1455–1470. doi: 10.2214/AJR.09.2579. [DOI] [PMC free article] [PubMed] [Google Scholar]
- 6.Pallwein L., Mitterberger M.J., Struve P., Horninger W., Aigner F., Bartsch G. Comparison of sonoelastography guided biopsy with systematic biopsy: impact on prostate cancer detection. Eur Radiol. 2007;17:2278–2285. doi: 10.1007/s00330-007-0606-1. [DOI] [PubMed] [Google Scholar]
- 7.Krouskop T.A., Wheeler T.M., Kallel F., Garra B.S., Hall T. Elastic moduli of breast and prostate tissues under compression. Ultrason Imaging. 1998;20:260–274. doi: 10.1177/016173469802000403. [DOI] [PubMed] [Google Scholar]
- 8.Ginat D.T., Destounis S.V., Barr R.G., Castaneda B., Strang J.G., Rubens D.J. US elastography of the breast and prostate lesions. Radiographics. 2009;29:2007–2016. doi: 10.1148/rg.297095058. [DOI] [PubMed] [Google Scholar]
- 9.Rizzatto G., Aiani L., Baldassarre S., Bulzacchi A., Della Sala S., Locatelli M. USA; Chicago: 2006. Characterization of breast lesions with real-time sonoelastography: results from the Italian Multicenter Clinical Trial. Abstract-RSNA. [Google Scholar]
- 10.Zhi H., Ou B., Luo B.M., Feng X., Wen Y.L., Yang H.Y. Comparison of ultrasound elastography, mammography, and sonography in the diagnosis of solid breast lesions. J Ultrasound Med. 2007;26:807–815. doi: 10.7863/jum.2007.26.6.807. [DOI] [PubMed] [Google Scholar]
- 11.Giuseppetti G.M., Martegani A., Di Cioccio B., Baldassarre S. Elastosonography in the diagnosis of the nodular breast lesions: preliminary report. Radiol Med. 2005;110:69–76. [PubMed] [Google Scholar]
- 12.Lyshchik A., Higashi T., Asato R., Tanaka S., Ito J., Mai J.J. Thyroid gland tumor diagnosis at US elastography. Radiology. 2007;237:202–211. doi: 10.1148/radiol.2363041248. [DOI] [PubMed] [Google Scholar]
- 13.Lyshchik A., Higashi T., Asato R., Tanaka S., Ito J., Hiraoka M. Cervical lymph node metastases: diagnosis at sonoelastography - initial experience. Radiology. 2007;243:258–267. doi: 10.1148/radiol.2431052032. [DOI] [PubMed] [Google Scholar]
- 14.Pallwein L., Aigner F., Faschingbauer R., Pallwein E., Pinggera G., Bartsch G. Prostate cancer diagnosis. Value of real-time elastography. Abdom Imaging. 2008;33(6):729–735. doi: 10.1007/s00261-007-9345-7. [DOI] [PubMed] [Google Scholar]
- 15.Ferrari F.S., Scorzelli A., Megliola A., Drudi F.M., Trovarelli S., Ponchietti R. Real-time elastography in the diagnosis of prostate tumor. J Ultrasound. 2009;12:22–31. doi: 10.1016/j.jus.2009.01.001. [DOI] [PMC free article] [PubMed] [Google Scholar]
- 16.Salomon G., Kollerman J., Thederan I., Chun F.K., Budäus L., Schlomm T. Evaluation of prostate cancer detection with ultrasound real-time elastography: a comparison with step section pathological analysis after radical prostatectomy. Eur Urol. 2008 Dec;54(6):354–362. doi: 10.1016/j.eururo.2008.02.035. [DOI] [PubMed] [Google Scholar]
- 17.Miyagawa T., Tsutsumi M., Matsumura T., Kawazoe N., Ishikawa S., Shimokama T. Real-time elastography for the diagnosis of the prostate cancer: evaluation of elastographic moving images. Jpn J Clin Oncol. 2009;39(6):394–398. doi: 10.1093/jjco/hyp026. [DOI] [PubMed] [Google Scholar]
- 18.Aigner F., Pallwein L., Junker D., Schäfer G., Mikuz G., Pedross F. Value of real-time elastography targeted biopsy for prostate cancer detection in men with prostate specific antigen 1.25 ng/ml or greater and 4.00 ng/ml or less. J Urol. 2010;184:913–917. doi: 10.1016/j.juro.2010.05.026. [DOI] [PubMed] [Google Scholar]
- 19.Thijssen J.M., Oosterveld B.J., Hartman P.C., Rosenbusch G.J. Correlations between acoustic and texture parameters from RF and B-mode liver echograms. Ultrasound Med Biol. 1993;19(1):13–20. doi: 10.1016/0301-5629(93)90013-e. [DOI] [PubMed] [Google Scholar]
- 20.Rolland Y., Bèzy- Wendling J., Gestin H., Bruno A., Duvauferrier R., Morcet N. Analysis of texture medical imaging. Review of the literature. Ann Radiol. 1995;38:315–347. [PubMed] [Google Scholar]
- 21.Ophir J., Cespedes I., Ponnekanti H., Yazdi Y., Li X. Elastography: a quantitative method for imaging the elasticity of biological tissues. Ultrason Imaging. 1991;13:111–134. doi: 10.1177/016173469101300201. [DOI] [PubMed] [Google Scholar]
- 22.Tanzi F., Novario R., Goddi A., Bianchi C., Conte L. Feasibility of the use of elastographic techniques with ultrasound in the differentiation of different tissues. Radiol Med. 2000;100:175–182. [PubMed] [Google Scholar]
- 23.Ophir J., Miller R.K., Ponnekanti H., Cespedes I., Whittaker A.D. Elastography of beef muscle. Meat Sci. 1994;36:239–250. doi: 10.1016/0309-1740(94)90043-4. [DOI] [PubMed] [Google Scholar]
- 24.Parker K.J., Huang S.R., Musulin R.A., Lerner R.M. Tissue response to mechanical vibrations for "Sonoelasticity imaging. Ultrasound Med Biol. 1990;16:241–246. doi: 10.1016/0301-5629(90)90003-u. [DOI] [PubMed] [Google Scholar]
- 25.Konig K., Scheipers U., Pesavento A., Lorenz A., Ermert H., Senge T. Initial experiences with with real-time elastography guided biopsies of the prostate. J Urol. 2005;174(1):115–117. doi: 10.1097/01.ju.0000162043.72294.4a. [DOI] [PubMed] [Google Scholar]
- 26.Pallwein L., Mitterberger M., Pingerra G., Aigner F., Pedross F., Gradl J. Sonoeleastography of the prostate: comparison with systematic biopsy findings in 492 patients. Eur J Radiol. 2008 Feb;65(2):304–310. doi: 10.1016/j.ejrad.2007.03.032. [DOI] [PubMed] [Google Scholar]
- 27.McNeal J.E. Normal anatomy of the prostate and changes in benign prostatic hypertrophy and carcinoma. Semin Ultrasound CT MR. 1988;9:329–334. [PubMed] [Google Scholar]
Associated Data
This section collects any data citations, data availability statements, or supplementary materials included in this article.