

Abstract
In many acute leukemias, normal differentiation does not occur. However, in many cell lines derived from hematologic malignancies, differentiation or apoptosis can be induced by variety of agents. Despite advances in the treatment of Acute Lymphoblastic Leukemia (ALL), in most patients long-term survival rates remain unsatisfactory, especially in T-cell derived ALL. Thus we studied the anti-cancer effects of fenretinide, 1α,25(OH)2D3, and bryostatin-1 in CCRF-CEM (T-cell derived) and Nalm-6 (B-cell derived) ALL cell lines. Using MTT assays, both cell lines were shown to exhibit increased inhibition of proliferation at micro (fenretinide) and nanomolar (1α,25(OH)2D3, bryostatin-1) concentrations. These anti-cancer agents were shown to induce apoptosis and activate caspase-3 pathway in both ALL cell lines. Furthermore, for the first time we are reporting consistent anti-proliferative and apoptotic effects of Bryostatin-1 in ALL T-cell derived cell line with the lowest ED50 (ranging 4.6-7.4 nM). To evaluate the differentiation induction by fenretinide, 1α,25(OH)2D3, and bryostatin-1 in ALL cell lines, we assayed for the expressions of CD19, CD38 markers on Nalm-6 and CD7 marker on CCRF-CEM cell line. The flow cytometric analysis showed a significant increase in expression of CD markers in response to anti-cancer drug treatments. To assay the effects of anti-cancer drugs on cell cycle distribution, cell cycle analysis using flow cytometry was employed. These anti-cancer drugs appear to affect the CCRF-CEM and Nalm-6 cell cycles differently (G0/G1 and G2/M arrest, respectively). Overall results demonstrate that the anti-cancer agents used in this study are strong inhibitors of ALL cell proliferation and inducers of apoptosis and differentiation in vitro. These findings may be quite helpful if these drugs are to be used for differentiation therapy of ALL patients in clinics in the future. Further studies are warranted to establish the in vivo effect of these drugs particularly in patients with T-cell derived ALL.
Keywords: Acute lymphoblastic leukemia, Apoptosis, Cell differentiation, Flow cytometry
Introduction
Acute Lymphoblastic Leukemia (ALL) is a clonal hematopoietic malignancy that is characterized by abnormal proliferation of hematopoietic progenitor cells. Despite advances in the treatment of ALL, in most patients long-term survival rates remain unsatisfactory especially in ALL with T-cell origin (1, 2). Hence, there is a continued need to discover new agents that may help and change the out-come for these patients. There are an increasing number of chemotherapeutic and biological agents that target several characteristics of cells such as differentiation, angiogenesis, proliferation, DNA repair, and apoptosis (2, 3).
Over the recent years, it has been demonstrated that retinoids regulate biological processes including cell proliferation, differentiation, and apoptosis (4). Currently, retinoids are used in clinical trials of Acute Promyelocytic Leukemia (APL) and T-cell lymphoma (5–7). Since retinoid therapy is often associated with side-effects (skin irritation and liver toxicity), its amide derivatives (retinamides) have been investigated in adult and childhood cancers (7, 8). Among several retinamides examined, N-(4-hydroxyphenyl) retinamide (4-HPR, fenretinide) is considered a superior anti-cancer agent due to its favorable pharmacokinetic profile (9–11). 4-HPR has been used successfully for treatment of AML patients (5–7).
Also, many studies have demonstrated that the physiologically active metabolite of vitamin D, 1α,25(OH)2D3, inhibits the proliferation and promotes the differentiation of several cancerous cells (12–17). Anti-cancer properties of 1α,25(OH)2D3 have led to its evaluation in the treatment of hyper-proliferative malignancies (18–20). 1α,25(OH)2D3 apply its biological effects through a class of nuclear receptor, Vitamin D Receptor (VDR) (21). Formation of the ligand-receptor complex initiates the transcription of specific responsive genes resulting in the synthesis of appropriate proteins and modulation of cellular functions (22, 23).
Another chemotherapeutic agent is Bryostatin-1(Bryo-1) which is a macrocyclic lactone isolated from the marine bryozoan Bugula neritina. It is an activator of the serinethreonine kinase PKC, an enzyme involved in diverse cellular processes including cell proliferation, differentiation, and stimulus–response coupling (24, 25). Bryostatin-1 has been shown to potently inhibit the growth and self-renewal capacity of human leukemia cells at nanomolar concentrations in vivo and in vitro (26–28).
Although the effects of anti-cancer compounds (4-HPR, 1α,25(OH)2D3, Bryostatin-1) have been examined in various leukemias, little information is available on the effects of these anti-cancer compounds in T-cell and B-cell derived ALL cell lines. In the present study, we examine inhibition of cell proliferation and induction of both apoptosis and differentiation in two acute lymphoblastic leukemia cell lines (CCERF-CEM and Nalm-6) exposed to 4-HPR, 1α,25(OH)2D3, or Bryostatin-1.
We provide evidence that Bryostatin-1 induce growth inhibition and apoptosis at nano-molar range consistently in T-cell derived human ALL cell line.
Materials and Methods
Leukemia cell lines
The ALL cell lines (CCRF-CEM, Nalm-6) were purchased from cell bank (Pasteur Institute Iran, Tehran). CCRF-CEM and Nalm-6 are derived from T and B lymphocytes, respectively. Human leukemic cell lines were grown in RPMI 1640 culture medium (GIBCO, Grand Island, NY) supplemented with 10% Fetal Bovine Serum (FBS, Gibco, Invitrogen, South America), 1% glutamine, 1% antibiotics (penicillin-streptomycin), and 1% nonessential amino acids. Cells were maintained at 37°C and 5% CO2.
Reagents and treatments
Fenretinide (4-HPR), 1α,25(OH)2D3 (vitamin D3), and Bryostatin-1 (Bryo-1) were purchased from Sigma-Aldrich®, Steibeim, Germany. All anti-cancer compounds were dissolved in 100% ethanol. Stock preparations of 4-HPR and Bryostatin-1 were stored at -20°C; however stock preparation of 1α,25(OH)2D3 was stored at -70°C. All reagents were diluted to appropriate final concentrations in medium (RPMI 1640). Final concentrations of ethanol never exceeded 0.01% (levels known to be without effect on the response of ALL cells to these compounds (13). Leukemic cells were washed twice in RPMI 1640 by centrifugation at 300×g for 5 min. Then, cells were suspended in medium with different concentrations of 4-HPR, 1α,25(OH)2D3, and Bryostatin-1. The cells were incubated for 24, 48, and 72 hr at 37°C in a humidified 5% CO2 atmosphere. To examine the combinatory effects of 4-HPR and 1α,25(OH)2D3, leukemia cells were seeded at 2×10⁵ cells/ml in 24-well plastic plates and pre-treated with 0.1 or 1 nM 1α,25(OH)2D3 for 8, 24 or 48 hr before assays.
MTT assay
Cell proliferation was evaluated by the MTT (3, (4,5-dimethylthiazol-2-yl)-5-(3 carboxymethoxyphenyl-2 (4-sulfophenyl)-2H-tetrazolium) (Sigma-Aldrich®, Steibeim, Germany) assay (29). Briefly, 5×10⁴ cells were plated in a total volume of 100 µl in 96-well plates (FALCON, USA) and suspended in medium with different concentration of 4-HPR, 1α,25(OH)2D3, and Bryostatin-1(Bryo-1). MTT was dissolved in absolute ethanol. Following 24, 48, and 72 hr incubation, 0.01 ml of MTT solution (at a final concentration 0.5 mg/ml) was added per well. The plates were then incubated for additional 3 hr. Then 100 µl of stop solution (isopropanol containing 0.04% HCl) was added per well. Immediately after solving the blue formazon crystals, the absorbance of samples was read using a 96-well plate reader (Anthos 2020) at 570 and 630 nm wave lengths. Results reported in this article are the mean±S.E.M. of three independently performed experiments, and each concentration was tested in eight wells per experiment. The results were considered to be significant when the p-value was <0.05, and highly significant when the p-value was <0.01 or <0.001.
Flow cytometric analysis of cell cycle
The DNA content during cell cycle steps were evaluated with flow cytometry. In brief, 5×10⁶ cells were treated with drugs at a specific concentration. After 24 hr, the cell pellets were washed and resuspended in 2 ml of 1% paraformaldehyde in PBS and incubated for 15 min at 4°C. Then, cells were centrifuged and 1 ml of cold perm buffer III (BD. Co, USA) solution was added; cells were incubated for 30 min at 4°C and then were washed twice in PBS. Next, 500 λ of PI (Sigma-Aldrich®, Steinbeim, Germany) staining buffer (50 µg/ml PI, 10 µg/ml RNase in PBS) was added and incubated for 1 hr at room temperature in the dark. After DNA staining by Propidium Iodide (PI), samples were evaluated by a flow cytometer using Partec FloMax software (Version 2.3) (29).
Flow cytometric analysis of apoptosis
In this study, 1×10⁶ cells/ml suspension of ALL cell lines was induced for apoptosis by addition of several concentrations of drugs. 1x10⁶ cells/ml suspension of non-induced leukemic cells was established as a negative control. Both control and experimental leukemic cell samples were incubated for 24 and 48 hr in a 37°C, 5% CO2 incubator. Following incubation, cells were washed twice with DPBS (Dulbecco's Phosphate Buffered Saline). After that, the cells at concentration of about 1×10⁶ cells/ml were resuspended in 1X binding buffer (100 mM HEPES/NaOH, pH 7.5 containing 1.4 M NaCl and 25 mM CaCl2). Five hundred λ of the apoptotic cell suspension was added to a plastic 12 x 75 mm test tube, and 500 λ of the non-induced cell suspension was added to a second plastic tube. Next, 5 λ of AnnexinV-FITC (Sigma-Aldrich®, Steibeim, Germany) and 10 λ of Propidium Iodide (PI) (Sigma-Aldrich®, Steibeim, Germany) were added to each cell suspension. Then the tubes were incubated at room temperature for exactly 10 min and protected from light. Finally, fluorescence of the cells was immediately determined by a flow cytometer (29).
In order to adjust the flow cytometer for evaluating the apoptosis, a positive and a negative control sample was used. As a positive control, apoptosis was induced in a 1×10⁶ cells/ml suspension of leukemic cells by addition of 1 µg/ml Staurosporine (Sigma-Aldrich®, Steibeim, Germany). Flow cytometry analysis was performed using Partec FloMax software (Version 2.3).
Flow cytometric analysis of differentiation
The ALL cell lines were analyzed for phenotypic evidence of differentiation by examining the expression of cell surface antigens as described previously (30, 31). Briefly, CCRF-CEM and Nalm-6 cells were washed with PBS supplemented with 1% FBS and stained with the following antibodies for 30 min at 4°C: R-phycoerythrin (RPE)-conjugated mouse anti-human CD19 IgG1, R-phycoerythrin (RPE)-conjugated mouse anti-human CD38 IgG1, or fuorescein isothiocyanate (FITC)-conjugated mouse anti-human CD7 IgG2b (DakoCytomation, DAKO, Denmark). Specifically, CCRF-CEM cells were stained with FITC-conjugated mouse anti-human CD7 IgG2b and Nalm-6 cells were stained with RPE-conjugated mouse anti-human CD19 IgG1 or RPE-conjugated mouse anti-human CD38 IgG1. Cells were then washed to remove unbound antibody, resuspended in 0.5 ml PBS containing 1% FBS for immediate analysis with a minimum acquisition of 2×10⁴ events. Samples were run on a Partec FloMax flow cytometer. Results are presented as the relative mean fuorescence after subtracting the isotype control for each sample compared to the untreated media controls.
Western immunoblot analysis
Cell lysates (from 6×10⁶ cells) were assayed for protein concentration with the BCA Protein Assay Reagent kit (Thermo scientific, U.S.A). Sodium Dodecyl Sulfate-Polyacrylamide Gel Electrophoresis (SDS-PAGE) analysis was performed as previously described (32, 33). Proteins were resolved on a 12% SDS polyacrylamide gel, transferred to a PVDF membrane (Roche, Germany). After transferring to PVDF membrane and blocking the non-specific binding sites with 5% skim milk, the membrane was incubated with the human reactive monoclonal anti-caspase-3 (abcam, Mediqip, United States) for 2 hr followed by incubation with the secondary rabbit anti-mouse horseradish peroxidase-labeled anti-body (1:1000) for one hr. Bound antibody was detected with the ECL Western Blotting Detection System (GE healthcare, U.K). The chemiluminescence of the membranes was detected by exposure to X-ray film (Kodak, Rochester, NY). Hybridization with the house keeping protein β-Actin was used as a control for equal loading and protein quality.
Statistical analysis
Statistical analyses were carried out using SPSS software (PASW 18, an IBM Company, Iran). Data are expressed as the mean±S.E.M. and comparison between the controls and each treatment group was performed using a two-tailed, paired student's t-test. The results were considered to be significant when the p-value was <0.05, and highly significant when the p-value was <0.01 or <0.001.
Results
Effects of anti-cancer compounds on proliferation in ALL cell lines
Recently, we have shown that 4-HPR can prevent the growth and proliferation of an AML cell line (NB-4) (34). In the present study, to determine the growth inhibitory effect of 4-HPR on two acute lymphoblastic leukemia cell lines (CCRF-CEM, and Nalm-6), both cell types were exposed to increasing concentrations of 4-HPR (1, 2.5, 5, 7.5, and 10 µM) and cell viability was determined by MTT assay. Eight samples were tested for each drug concentration and each experiment was repeated three times before MTT analysis. Results are represented in Figure 1. 4-HPR inhibits the growth of ALL cell lines in a concentration-dependent manner (Figure 1A) and the most inhibitory effects were observed in Nalm-6 cells at low micromolar (µM) range after 72 hr. Overall, the results indicate that Nalm-6 cells relative to CCRF-CEM cells are more sensitive to fenretinide treatment.
Figure 1.

Effect of (A) 4-HPR, (B) 1α,25(OH)2D3, and (C) Bryostatin-1 on proliferation of two ALL cell lines (CCRF-CEM, Nalm-6). (D and E) Synergistic effects of 4-HPR and 1α,25(OH)2D3 (VD3) on proliferation of CCRF-CEM and Nalm-6 cells. Results show the mean±S.E.M. of three independently performed experiments. Each concentration was tested in eight wells per experiment. P-values are for individual treatment groups compared to control (*p<0.001, **p<0.01, # p<0.05)
1α,25(OH)2D3 was another compound investigated in the present study. Based on previous studies (13, 35), concentrations in the nanomolar range were chosen to treat the cell lines (0.1, 10, and 100 nM). In Figure 1B, effect of 1α,25(OH)2D3 on growth of CCRF-CEM and Nalm-6 cell lines is demonstrated. The maximum concentration used in this study (100 nM) revealed the highest inhibitory effects on growth of both leukemic cell lines. In Nalm-6 cells, 1α,25(OH)2D3 induced 73% inhibition at 100 nM, 48 hr post treatment. Nalm-6 cell line was more sensitive to 1α,25(OH)2D3 treatment relative to CCRF-CEM.
The third anti-cancer drug chosen to determine its growth inhibitory effects on ALL cells was Bryostatin-1. Although the concentrations of Bryostatin-1 used in this study were in the low nanomolar (nM) range, the results indicate a significant decrease in the survival of two leukemic cell lines. For instance, as shown in the Figure 1C, Bryostatin-1, at concentration 10 nM, inhibits proliferation of CCRF-CEM and Nalm-6 cells by 63.03% and 60.25%, respectively (48 hr post treatment).
To show the effective dose of each anti-cancer drug that inhibited 50% growth (ED50) of ALL cells after 24, 48, and 72 hr treatment, ED50 was determined by plotting the inhibition of cell proliferation in the presence of increasing concentration of 4-HPR (1-10 µM), VD3 (0.1-100 nM), and Bryostatin-1 (0.1-10 nM) (Table 1). Comparing the ED50s among the three drugs, 4-HPR potently inhibited the growth of CCRF-CEM and Nalm-6 cells (ED50 ranging from 4.6 to 7.2 µM); however, it is clear that Bryostatin-1 has the lowest and clinically acceptable ED50 in lymphoblastic leukemia cell lines (24, 28).
Table 1.
Concentrations of anti-cancer drugs that produced 50% growth inhibition (ED50) of ALL cells
| ED50 for anti-cancer drugs | ||||
|---|---|---|---|---|
|
| ||||
| Cell line | Time | 4-HPR | VD3 | Bryo1 |
| CCRF-CEM | ||||
| 24 hr | 7.2 µM | N.R. | 7.4 nM | |
| 48 hr | 5.2 µM | N.R. | 4.6 nM | |
| 72 hr | 4.8 µM | N.R. | 6.7 nM | |
| Nalm-6 | ||||
| 24 hr | 5.7 µM | N.R. | N.R. | |
| 48 hr | 4.8 µM | 39.2 nM | 5.8 nM | |
| 72 hr | … | 53.9 nM | N.R. | |
|
| ||||
| Abbreviations: 4-HPR, fenretinide; VD3 , 1,25α (OH)2D3; Bryo1, Bryostatin1; N.R., not reached. | ||||
ED50 was determined by plotting the inhibition of cell proliferation (MTT assay) in the presence of increasing concentration of 4-HPR (1-10 µM), VD3 (0.1-100 nM), and Bryo-1 (0.1-10 nM)
Because previous studies demonstrated the cooperative action of retinoic acid derivatives and 1α,25(OH)2D3 in various cancer cells (36, 37), we next examined the synergistic effects of 4-HPR and 1α,25(OH)2D3 on proliferation inhibition in acute lymphoblastic leukemia cell lines (CCRF-CEM and Nalm-6) using MTT assay. Figures 1D and 1E respectively show that combination of low concentrations of 4-HPR (1 and 2.5 µM) and 1α,25(OH)2D3 (0.1 and 1 nM) can significantly reduce viability of ALL cells (up to 80%).
Flow cytometric analysis of cell cycle
To investigate the mechanisms by which 4-HPR, 1α,25(OH)2D3, and Bryostatin-1 inhibited the growth of ALL cell lines, the cell cycle distribution was analyzed after exposure of these cells to the anti-cancer drugs. As shown in Table 2, the untreated CCRF-CEM cells (T-ALL) were mainly in G2/M phase (51.61%), and with the treatment of 5 µM 4-HPR and 100 nM 1α,25(OH)2D3 for 24 hr, the percentage of S phase cells were significantly decreased and those of G2/M phase cells were correspondingly increased (65.6% and 63.22% respectively).
Table 2.
Effects of anti-cancer drugs on ALL cell cycle distribution
| Percentage of cells | ||||
|---|---|---|---|---|
|
| ||||
| Cell line | Drugs | G0/G1 | S | G2/M |
| CCRF-CEM | ||||
| Control | 29.54±3.4 | 18.85±2.9 | 51.61±0.42 | |
| 4-HPR | 30.67±5.7 | 3.73±0.5* | 65.6±2.7* | |
| 1α,25(OH) 2 D 3 | 28.27±2.3 | 8.51±1.05 | 63.22±7.4 | |
| Bryostatin-1 | 46.8±5.2* | 26.37±2.45 | 26.83±0.99* | |
| Nalm-6 | ||||
| Control | 65.35±1.76 | 11.76±2.94 | 22.89±4.15 | |
| 4-HPR | 86.42±2.33* | 5.73±1.05 | 7.85±3.86* | |
| 1α,25(OH) 2 D 3 | 76.1±5.62 | 9.4±3.01* | 14.5±5.54* | |
| Bryostatin-1 | 89.6±1.53* | 0.17±0.07 | 10.23±3.49* | |
Effects of anti-cancer drugs on cell cycle distribution of CCRF-CEM and Nalm-6 cells. ALL cells were plated in a 24-well plate and cultured with 4-HPR (5 µM), 1α,25(OH)2D3 (100 nM), and Bryostatin-1 (10 nM). After 24 hr, cell distribution was analyzed by flow cytometry. Results represent the mean±S.E.M. of three separate experiments. P-values are for individual treatment groups compared to control
p < 0.05
In contrast, treatment of CCRF-CEM cells with Bryostatin-1 (10 nM, 24 hr) significantly decreased the fraction of G2/M cells (26.83%) and increased the fraction of G0/G1 cells (46.8% compare to control 29.54%). Table 2 shows that untreated Nalm-6 cells (B-ALL) were mostly in G0/G1 (65.35%). When treated with 4-HPR (5 µM), 1α,25(OH)2D3 (100 nM), and Bryostatin-1 (10 nM), B-ALL cells were markedly accumulated in G0/G1 phase (86.42%, 76.1%, and 89.6%, respectively). Figure 2 is a representative flow cytometric chart of effects of anti-cancer drugs on cell cycle distribution in acute lymphoblastic leukemia cells.
Figure 2.

Effects of 4-HPR, 1α,25(OH)2D3, and Bryostatin-1on cell cycle distribution of CCRF-CEM and Nalm-6 cells. ALL cells were cultured with anti-cancer drugs. After 24 hr, cell distribution was analyzed by flow cytometry
Flow cytometric analysis of apoptosis
Next we examined the involvement of apoptotic cell death in reduced survival of CCRF-CEM and Nalm-6 cells in response to three anti-cancer drugs. For this purpose, Annexin V staining and flow cytometric analysis was utilized. The apoptosis sensitivities of the investigated cell lines were looked at in three groups of 4-HPR-treated, 1α,25(OH)2D3-treated, and Bryostatin-1-treated cells (Tables 3A, 3B, and 3C). In Table 3A, CCRF-CEM and Nalm-6 cells treated by 4-HPR demonstrate an increase in apoptosis as the concentrations change. Table 3B shows that at higher concentrations of 1α,25(OH)2D3, CCRF-CEM cells were more responsive than Nalm-6 cells in 48 hr treatment group. As results in Table 3C show, exposure of CCRF-CEM and Nalm-6 cells to Bryostatin-1 (24 hr and 48 hr) increased the population of cells being positive for annexin V (4.5-12.11%).
Table 3A.
Apoptosis induction by 4-HPR
| CCRF-CEM | Nalm-6 | ||
|---|---|---|---|
|
| |||
| Time | Concentration | Apoptosis % | |
| 24 hour | Control | 0.57 ± 0.25 | 0.33 ± 0.13 |
| 1 µM | 3.67 ± 1.82 | 6.72 ± 2.44 | |
| 2.5 µM | 9 ± 4.1 | 11.8 ± 3.02 | |
| 5 µM | 11.4 ± 2.66* | 12.72 ± 1.38* | |
| 7.5 µM | 15.97 ± 1.81* | 9.22 ± 2.77 | |
| 10 µM | 10.86 ± 0.98* | 9.7 ± 1.56* | |
| 48 hour | Control | 0.71 ± 0.19 | 0.44 ± 0.075 |
| 1 µM | 10.95 ± 1.39* | 9.55 ± 0.95* | |
| 2.5 µM | 13.99 ± 0.53* | 10.91 ± 3.45 | |
| 5 µM | 16.62 ± 2.44* | 9.67 ± 1.24* | |
| 7.5 µM | 10.09 ± 5.21 | 8.67 ± 4.16 | |
| 10 µM | 11.3 ± 1.58* | 20.12 ± 9.5 | |
Apoptosis induction by (3A) 4-HPR in ALL cell lines.
Results (mean±S.E.M. of three separate experiments) are the percentage of cells positive for annexin V. P-values are for individual treatment groups compared to control
p < 0.05
Table 3B.
Apoptosis induction by 1α,25(OH)2D3
| CCRF-CEM | Nalm-6 | ||
|---|---|---|---|
|
| |||
| Time | Concentration | Apoptosis % | |
| 24 hour | Control | 0.57 ± 0.25 | 0.33 ± 0.13 |
| 0.1 nM | 3.5 ± 1.65 | 2.29 ± 0.77 | |
| 1 nM | 4.91 ± 2.18 | 3.56 ± 0.22* | |
| 10 nM | 5.78 ± 2.19 | 4.46 ± 2.36 | |
| 100 nM | 9.71 ± 1.9* | 7.81 ± 2.39 | |
| 48 hour | Control | 0.71 ± 0.19 | 0.44 ± 0.075 |
| 0.1 nM | 3.78 ± 1.19 | 5.52 ± 0.87* | |
| 1 nM | 6.24 ± 1.42 | 3.86 ± 0.53* | |
| 10 nM | 8.52 ± 1.32* | 3.58 ± 1.91 | |
| 100 nM | 40.89 ± 8.96* | 15.47 ± 3.4* | |
Apoptosis induction by (3B) 1α,25(OH)2D3 in ALL cell lines
Results (mean±S.E.M. of three separate experiments) are the percentage of cells positive for annexin V. P-values are for individual treatment groups compared to control
p < 0.05
Table 3C.
Apoptosis induction by Bryostatin-1
| CCRF-CEM | Nalm-6 | ||
|---|---|---|---|
|
| |||
| Time | Concentration | Apoptosis % | |
| 24 hour | Control | 0.57 ± 0.25 | 0.33 ± 0.13 |
| 0.01 nM | 5.41 ± 1.39 | 6.23 ± 4.94 | |
| 0.1 nM | 5.62 ± 0.37 * | 7.09 ± 1.2 * | |
| 1 nM | 5.44 ± 1.73 | 6.82 ± 0.83 * | |
| 10 nM | 10.02 ± 4.1 | 9.95 ± 4.06 | |
| 48 hour | Control | 0.71 ± 0.19 | 0.44 ± 0.075 |
| 0.01 nM | 4.51 ± 0.52 * | 4.18 ± 0.15 * | |
| 0.1 nM | 7.15 ± 3.48 | 4.88 ± 3.21 | |
| 1 nM | 8.45 ± 1.1 * | 8.74 ± 1.8 * | |
| 10 nM | 12.11 ± 4.69 | 11.02 ± 1.83 * | |
Apoptosis induction by (3C) Bryostatin-1 in ALL cell lines.
Results (mean±S.E.M. of three separate experiments) are the percentage of cells positive for annexin V. P-values are for individual treatment groups compared to control
p < 0.05
Next we evaluated the synergistic effects of 4-HPR and 1α,25(OH)2D3 on apoptosis induction in ALL cell lines. Table 3D shows that combination of 4-HPR and 1α,25(OH)2D3 increase the fraction of ALL cells undergoing apoptosis 24 and 48 hr post treatment when compared to individual treatments. Figure 3 is a representative flow cytometric chart demonstrating induction of apoptosis by anti-cancer drugs in acute lymphoblastic leukemia cells.
Table 3D.
Apoptosis induction by combination of 4-HPR and VD3
| Cell | Time | Concentration | Apoptosis % |
|---|---|---|---|
| Control | 0.49 ± 0.22 | ||
| CCRF-CEM | 24 hours | 0.1 nM,VD3+ 1 µM,4-HPR | 7.85 ± 1.54* |
| 0.1 nM,VD3+ 2.5 µM,4HPR | 12.32 ± 1.78* | ||
| 1 nM,VD3+ 1 µM,4HPR | 15.04 ± 2.09* | ||
| 1 nM,VD3+ 2.5 µM,4HPR | 20.79 ± 2.59* | ||
| Control | 0.47 ± 0.19 | ||
| Nalm-6 | 24 hours | 0.1 nM,VD3+ 1 µM,4-HPR | 8.48 ± 2.25 |
| 0.1 nM,VD3+ 2.5 µM,4HPR | 11.55 ± 2.38* | ||
| 1 nM,VD3+ 1 µM,4HPR | 10.66 ± 2.67 | ||
| 1 nM,VD3+ 2.5 µM,4HPR | 11.85 ± 2.6* |
Apoptosis induction by (3D) Apoptosis induction by combination of 4-HPR and 1,25α (OH)2D3 in CCRF-CEM and Nalm-6 cells.
Results (mean±S.E.M. of three separate experiments) are the percentage of cells positive for annexin V. P-values are for individual treatment groups compared to control
p < 0.05
Figure 3.

Flow cytometric analysis of cell surface molecules on Nalm-6 and CCRF-CEM cells treated with 4-HPR, 1α,25(OH)2D3, and Bryostatin-1. Nalm-6 cells were assessed via flow cytometric analysis using PE-conjugated anti-CD19 mAb (A) or anti-CD38 mAb (B), 24, 48 and 72 hr post treatment. (C) Expression of CD7 by CCRF-CEM cells using FITC-conjugated anti-CD7 mAb. Results represent the mean±S.E.M. of three separate experiments. P-values are for individual treatment groups compared to control (*p < 0.001, **p < 0.01, # p < 0.05).
Flow cytometric analysis of differentiation
In recent years, many studies have been reported on the AML differentiation and differentiation induction by anti-cancer drugs (30, 31, 38). However, very few studies on differentiation induction in ALL cells are available (39–41). Several investigations have shown that B-cell differentiation is correlated with an upregulation of both CD19 and CD38 expressions (42–44). In this study, we examined the potential capacity of 4-HPR, 1α,25(OH)2D3, and Bryostatin-1 for differentiation induction in B-ALL (Nalm-6) cells. Figures 4A and 4B show that treatments by three anti-cancer drugs strongly induce up-regulation of CD19 and CD38 in Nalm-6 cells.
Figure 4.

Flow cytometric analysis of cell surface molecules on Nalm-6 and CCRF-CEM cells treated with 4-HPR, 1α,25(OH)2 D3, and Bryostatin-1. Nalm-6 cells were assessed via flow cytometric analysis using PE-conjugated anti-CD19 mAb (A) or anti-CD38 mAb (B), 24, 48 and 72 hr post treatment. (C) Expression of CD7 by CCRF-CEM cells using FITC-conjugated anti-CD7 mAb. Results represent the mean±S.E.M. of three separate experiments. MIF is the mean fluorescence intensity (expressed as the ratio of sample mean channel:control mean channel). P-values are for individual treatment groups compared to control (*p<0.001, **p<0.01, # p<0.05)
To examine differentiation induction in CCRF-CEM (T-ALL) cells, we evaluated the presence of CD7 expression on these cells before and after treatment with three anti cancer compounds. We showed that all three anti-cancer drugs significantly increased CD7 expression in CCRF-CEM cell line (Figure 4C). A representative flow cytometric chart of these experiments is shown in Figure 5.
Figure 5.

Effects of 1α,25(OH)2D3 (VD3) on CD19(A), bryostatin-1 (Bryo1) on CD38(B) and fenretinide (4-HPR) on CD7(C) expressions in ALL cell lines after 72 hr treatment. The cells stained with PE-or FITC- conjugated isotype mAbs were used as a control
Effects of anti-cancer compounds on caspase-3 activity in ALL cell lines
Since all three anti-cancer compounds (fenretinide, 1α,25(OH)2D3, and Bryostatin-1) induce apoptotic cell death in CCRF-CEM and Nalm-6 cell lines, we evaluated the mechanism by which these anti-cancer drugs act. Activation of caspase-3, a key enzyme involved in apoptotic cell death, was examined in ALL cell lines treated by drugs for 24 hr using Western blotting. Caspase-3 activity was observed in ALL cells when compared to control cells (ALL cells without treatment) suggesting that caspase-3 is activated in ALL cells treated with 4-HPR, 1α,25(OH)2D3, and Bryostatin-1 (Figure 6). We monitored uniform expression of β-Actin as a loading control.
Figure 6.
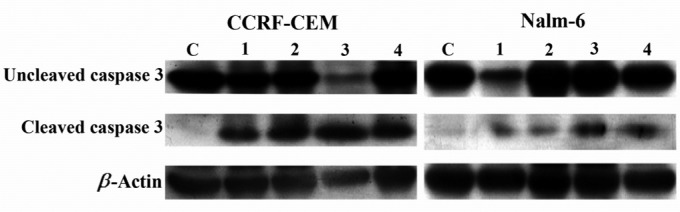
Effects of bryostatin-1 (Lane 2), 1α,25(OH)2D3 (Lane 3), and 4-HPR (Lane 4) on activation of caspase-3 (cleaved form) in CCRF-CEM and Nalm-6 cell lines 24 hr post treatment. C: negative control; Lane 1: positive control representing ALL cells treated with Staurosporine. β-actin: loading control
Discussion
In many acute leukemias differentiation, terminal cell division or programmed cell death can be induced by variety of agents. Therefore, regulatory pathways involved in hematopoietic differentiation can be reactivated in hematopoietic malignant cells with an appropriate stimulation (3). In this study, we selected three anti-cancer compounds (4-HPR, 1α,25(OH)2D3, Bryostatin-1) to examine their differentiation induction, anti proliferative, and apoptotic effects in an in vitro model using two ALL cell lines.
In agreement with previous investigations (13, 45–51), the results from present study demonstrate the anti-cancer effects of 4-HPR, 1α,25 (OH)2D3, and Bryostatin-1 on both leukemic cell lines; although, the effects varied. 4-HPR decreased the proliferation of leukemic cells in a time and concentration dependent manner and showed the most inhibitory effect in Nalm-6 cell line (B-cell derived) among the three anti-cancer drugs (Figure 1A).
Similarly, previous studies have shown that Nalm-6 cell line to be effectively inhibited by 4-HPR (29, 52). However, in our study, Bryostatin-1 is clearly demonstrated to be the compound with most consistent and significant anti-proliferative effects in CCRF-CEM cells (T-cell derived). Furthermore, it has the lowest and clinically acceptable ED50 in lympho-blastic leukemia cells (Table 1).
In preclinical studies, Bryostatin-1 has shown activity against diverse tumor types in vitro and in vivo. Bryostatin-1 is used for the treatment of melanoma, lymphomas, sarcoma, leukemias, and breast cancer, colon cancer, and lung cancer (53, 54). There is abundant preclinical evidence that Bryostatin-1 may interact synergistically in hematopoietic cells with various cytotoxic drugs, including ara-C (55, 56) and fludarabine (28).
Based upon these and other considerations, clinical trials combining Bryostatin-1 and cytotoxic agents, such as fludarabine and ara-C, have been initiated in patients with leukemia, and initial results are encouraging (28, 55, 56). There are several studies showing that Bryostatin-1 inhibits the growth of human leukemia cells at nanomolar concentrations (57–59). In agreement with these studies, Bryostatin-1 in our study was clearly shown to have the most consistent and significant anti-proliferative effects at nanomolar range in CCRF-CEM cells (T-cell derived) and not in Nalm-6 cells (B-cell derived).
To investigate the mechanisms by which these anti-cancer drugs inhibited the growth of ALL cell lines, the cell cycle distribution was first analyzed. Terminal differentiation can occur when cells arrest in the G0 phase or directly in G2 phase (60). Treatment of CCRF-CEM and Nalm-6 cells by 4-HPR or 1α,25 (OH)2D3 caused an increase in accumulation of cells in G2/M (Table 2).
Several studies (29, 32, 61) have reported 4-HPR-induced cell cycle arrest on different cancerous cells with varying effects on G0/G1, S, G2/M phases. In our study, these anti-cancer drugs appear to affect the CCRF-CEM and Nalm-6 cell cycles differently perhaps due to different cell origins (T-cell and B-cell-derived ALL cell lines). Bryostatin-1 is shown (Table 2) to have its major effects on both ALL cell types through blocking the cell cycle at G0/G1 phase. Our results are similar to previous studies examining different leukemic cells (47, 61, 62).
Previous studies have reported that retinoic acid derivatives and 1α,25(OH)2D3 can synergize their inhibitory effects on various cancer cells (36, 37, 63). Therefore, we decided to examine the inhibitory effect of 4-HPR and 1α,25(OH)2D3 in combination on proliferation of ALL cell lines. To our surprise, the combination of these two drugs inhibited proliferation of both ALL cell lines between 70-80% in comparison to a range of 15-30% inhibition when each drug was used alone (Figures 1A, 1B, 1C, and 1D). Such strong growth inhibitory effects at low nano and micro molar concentrations may play an important role in patient therapy in the future.
To further investigate whether apoptotic cell death mechanism was involved in the reduction of ALL cells treated by anti-cancer drugs, flow cytometric analyses were employed. Several previous studies have demonstrated induction of apoptosis by 4-HPR (29, 32, 64–66) and Bryostatin-1 (26, 58, 62, 67, 68) in various cancer cell types including leukemias.
In our study, these drugs generally inhibited the proliferation through apoptotic mechanism up to 20% and did not change significantly between 24 or 48 hr post treatments (Table 3). One significant finding in our study was the observation that although the Bryostain-1 induced apoptosis at similar levels than 4-HPR, the Bryostatin-1 concentrations inducing apoptosis was 1000 fold less than 4-HPR concentrations. This is particularly important if this drug is considered to be a drug of choice in chemotherapeutic treatments of patients with leukemias in the future.
Notably, apoptotic effects appeared to increase in response to 1α,25(OH)2D3 at 100 nM concentration in CCRF-CEM up to 40% after 48 hr treatment (Table 3B). Interestingly similar increased induced apoptosis in CCRF-CEM cell line was observed when combination of 4-HPR and 1α,25(OH)2D3 were evaluated by flow cytometry (Table 3D). However, these effects were not observed in Nalm-6 cell line neither in 24 hr nor 48 hr post treatment. Although the inhibitory effects of 1α,25(OH)2D3 in Nalm-6 cell line appear to be more prominent (Figure 1B), flow cytometric analysis shows that this effect is mainly through necrosis and not apoptosis (results not shown).
Studies of the effects of 1α,25(OH)2D3 on apoptosis are contradictory in literature and depend mostly on the cell model applied. Some investigations have shown that 1α,25 (OH)2D3 induces differentiation but not apoptosis (69–71) but others have demonstrated apoptosis to be induced by 1α,25(OH)2D3 in different cancer cells (35, 72, 73). In our study CCRF-CEM cell line which is a T-cell derived appear to be most sensitive to 1α,25(OH)2D3. To our knowledge no previous study has demonstrated this effect on a T-cell derived cell line. This finding may help the designing of new protocols for T-ALL differentiation therapy in the future.
To gain insight into the molecular basis of apoptosis induced by the three anti-cancer compounds used in this study, we assayed for caspase-3 activity, a key cellular protein targeted during apoptosis. Caspase-3 has been shown previously to be activated in cancer cell types (29, 74–76) in response to 4-HPR. Western blotting show (Figure 6) that 4-HPR, 1α,25(OH)2D3 and Bryostatin-1 promoted the cleavage of the zymogen of caspase-3 to yield the active form of caspase-3 in ALL cell lines after 24 hr exposure. Among the three drugs used in this study, 4-HPR has been previously demonstrated to induce the release of cytochrome c in CCRF-CEM human lymphoblastoid cells leading to activation of caspase pathways (77). These results suggest that caspases are the major pathways mediating apoptosis induced by 4-HPR, 1α,25(OH)2D3 and Bryostatin-1 in leukemic cells.
Currently Cluster Differentiation (CD) antigens are used to monitor treatment of patients suffering from hematologic malignancies (78). Although differentiation therapy has been widely studied in AML, there are few investigations on acute lymphoblastic leukemia, perhaps because ALL is considered a disease of differentiated lymphocytes (79). It is interesting that in most cases of ALL, transformed immature hematopoietic stem/progenitor cells with differentiation capacity are a dominant feature (39–41, 80).
Several studies have shown that B-cell differentiation is correlated with an up regulation of both CD19 and CD38 expressions (42–44). To evaluate the differentiation induction capacity of 4-HPR, 1α,25(OH)2D3 and Bryostatin-1 on Nalm-6, we used flow cytometry to detect CD19 and CD38 expression levels. As the results demonstrate (Figures 4A and 4B) the three anti-cancer compounds could significantly induce phenotypic differentiation of Nalm-6 cell line. Similar results have been reported previously in B-ALL cells (42–44, 79, 81).
To our knowledge, no study on T-ALL differentiation induced by anti-cancer drugs has been reported. Therefore, to find a proper CD marker to evaluate T-ALL cell differentiation, we assayed for the presence of CD7 marker suggested in immunophenotyping and MRD studies as an important marker (82–85). As it is shown in Figure 4C, 4-HPR, 1α,25(OH)2 D3, and Bryostatin-1 significantly increased the expression of CD7 on CCRF-CEM cells, indicating that T-ALL cells have the capacity to respond to these anti-cancer drugs. Currently most studies are focused on demonstrating that anti-cancer drugs are effective on AML and B-ALL cells; however, our results for the first time suggest that T-ALL cells (CCRF-CEM cell line) can also be tested for drug differentiation therapy and should not be ignored in future studies.
Bryostatin-1 is clearly able to induce differentiation in monocytic leukemia cells (48, 62). However, there are just few investigations on differentiation induction by Bryostatin-1 on acute lymphoblastic leukemia cells, and most of them have assayed this phenomenon on Reh, a human early pre-B acute lymphoblastic leukemia (86, 87).
In the present study, we, for the first time, showed that Bryostatin-1 has a potent capacity to induce differentiation on both B-ALL (Nalm-6) and T-ALL (CCRF-CEM) cell lines. Thus, Bryostatin-1 may represent the proto-type of a differentiation inducer whose major role in acute lymphoblastic leukemia therapy could be as a modulator of cytotoxic drug action.
Conclusion
In summary, this study has demonstrated that 4-HPR, 1α,25(OH)2D3, and Bryostatin-1 have anti-leukemic characteristics against both ALL B-cell and T-cell derived cell lines (Nalm-6 and CCRF-CEM). Furthermore, we have shown that the combination of 4-HPR and 1α,25(OH)2D3 increased the inhibition of proliferation and apoptosis synergistically at low micro and nanomolar levels. This finding may be quite significant if these drugs are to be used for differentiation therapy of ALL patients in the clinic in the future.
We are reporting a consistent anti proliferative and apoptotic effects of Bryostatin-1 in ALL T-cell derived cell line with the lowest ED50, making it potentially an accepted drug of choice in the clinic. This is important particularly due to insensitivity of T-cells to current chemotherapies for treatment of T-ALL patients.
The results from this study strongly indicate that the anti-leukemic effects of 4-HPR, 1α,25(OH)2D3, and Bryostatin-1 are mediated by targeting cell proliferation, cell cycle distribution, apoptosis and differentiation in ALL cell types. Further studies are warranted to evaluate the therapeutic efficacy of this class of agents in vivo.
Acknowledgement
This work was supported by a grant from Monoclonal Antibody Research Center at Avicenna Research Institute. We thank Mr. Torkabadi for his help in flow cytometry analyses and Mr. Lakpour, Mr. Bayat, Miss Einy, and Mrs. Ghaempanah for their help and technical assistance. We especially thank Dr. Jeddi-Tehrani for his support throughout this study.
References
- 1.Estey E. Treatment of relapsed and refractory acute myelogenous leukemia. Leukemia. 2000;14(3):476–479. doi: 10.1038/sj.leu.2401568. [DOI] [PubMed] [Google Scholar]
- 2.Cheok MH, Evans WE. Acute lymphoblastic leukaemia: a model for the pharmacogenomics of cancer therapy. Nat Rev Cancer. 2006;6(2):117–129. doi: 10.1038/nrc1800. [DOI] [PubMed] [Google Scholar]
- 3.Miller WH, Jr, Waxman S. Differentiation induction as a treatment for hematologic malignancies. Oncogene. 2002;21(21):3496–3506. doi: 10.1038/sj.onc.1205328. [DOI] [PubMed] [Google Scholar]
- 4.Greenberg ER, Sporn MB. Antioxidant vitamins, cancer, and cardiovascular disease. N Engl J Med. 1996;334(18):1189–1190. doi: 10.1056/NEJM199605023341810. [DOI] [PubMed] [Google Scholar]
- 5.Reynolds CP, Lemons RS. Retinoid therapy of childhood cancer. Hematol Oncol Clin North Am. 2001;15(5):867–910. doi: 10.1016/s0889-8588(05)70256-2. [DOI] [PubMed] [Google Scholar]
- 6.Smith MA, Anderson B. Where to next with retinoids for cancer therapy? Clin Cancer Res. 2001;7(10):2955–2957. [PubMed] [Google Scholar]
- 7.Adamson PC, Widemann BC, Reaman GH, Seibel NL, Murphy RF, Gillespie AF, et al. A phase I trial and pharmacokinetic study of 9-cisretinoic acid (ALRT1057) in pediatric patients with refractory cancer: a joint pediatric oncology branch, national cancer institute, and children's cancer group study. Clin Cancer Res. 2001;7(10):3034–3039. [PubMed] [Google Scholar]
- 8.Formeilli F, Clerici M, Campa T, Di Mauro MG, Magni A, Mascotti G, et al. Five-year administration of fenretinide: pharmacokinetics and effects on plasma retinol concentrations. J Clin Oncol. 1993;11(10):2036–2042. doi: 10.1200/JCO.1993.11.10.2036. [DOI] [PubMed] [Google Scholar]
- 9.Oridate N, Suzuki S, Higuchi M, Mitchell MF, Hong WK, Lotan R. Involvement of reactive oxygen species in N(4-hydroxyphenyl) retinamide-induced apoptosis in cervical carcinoma cells. J Natl Cancer Inst. 1997;89(16):1191–1198. doi: 10.1093/jnci/89.16.1191. [DOI] [PubMed] [Google Scholar]
- 10.Maurer BJ, Metelitsa LS, Seeger R, Cabot MC, Reynolds CP. Increase of ceramide and induction of mixed apoptosis/necrosis by N-(4-hydroxy-phenyl)-retinamide in neuroblastoma cell lines. J Natl Cancer Inst. 1999;91(13):1138–1146. doi: 10.1093/jnci/91.13.1138. [DOI] [PubMed] [Google Scholar]
- 11.Puduvalli VK, Saito Y, Xu R, Kouraklis GP, Levin VA, Kyritsis AP. Fenretinide activates caspases and induced apoptosis in gliomas. Clin Cancer Res. 1999;5(8):2230–2235. [PMC free article] [PubMed] [Google Scholar]
- 12.James SY, Williams MA, Kelsey SM, Newland AC, Colston KW. The role of vitamin D derivatives and retinoids in the differentiation of human leukaemia cells. Biochem Pharmacol. 1997;54(5):625–634. doi: 10.1016/s0006-2952(97)00195-0. [DOI] [PubMed] [Google Scholar]
- 13.Jung CW, Kim ES, Seol JG, Park WH, Lee SJ, Kim BK, et al. Antiproliferative effect of a vitamin D analog, EB1089, on HL 60 cells by the induction of TGF-b receptor. Leuk Res. 1999;23(12):1105–1112. doi: 10.1016/s0145-2126(99)00136-8. [DOI] [PubMed] [Google Scholar]
- 14.James SY, Williams MA, Colston KW. Leukemia cell differentiation: cellular and molecular interactions of retinoids and vitamin D. Gen Pharmacol. 1999;32(1):143–154. doi: 10.1016/s0306-3623(98)00098-6. [DOI] [PubMed] [Google Scholar]
- 15.Yoon JS, Kim JY, Park HK, Kim ES, Ahn KS, Yoon SS, et al. Antileukemic effects of a synthetic vitamin D3 analog, HY-11, with low potential to cause hypocalcaemia. Int J Oncol. 2008;32(2):387–396. [PubMed] [Google Scholar]
- 16.Zhang X, Jiang F, Li P, Li C, Ma Q, Nicosia SV, et al. Growth suppression of ovarian cancer xeno-grafts in nude mice by vitamin D analogue EB1089. Clin Cancer Res. 2005;11(1):323–328. [PubMed] [Google Scholar]
- 17.Banach-Petrosky W, Ouyang X, Gao H, Nader K, Ji Y, Suh N, et al. Vitamin D inhibits the formation of prostatic intraepithelial neoplasia in Nkx3.1;Pten mutant mice. Clin Cancer Res. 2006;12(19):5895–5901. doi: 10.1158/1078-0432.CCR-06-1039. [DOI] [PubMed] [Google Scholar]
- 18.Mellibovsky L, Diez A, Perez-Vila E, Serrano S, Nacher M, Aubia J. Vitamin D treatment in myelo-dysplastic syndromes. Br J Haematol. 1998;100(3):516–520. doi: 10.1046/j.1365-2141.1998.00598.x. [DOI] [PubMed] [Google Scholar]
- 19.Brown AJ, Slatopolsky E. Vitamin D analogs: therapeutic applications and mechanisms for selectivity. Mol Aspects Med. 2008;29(6):433–452. doi: 10.1016/j.mam.2008.04.001. [DOI] [PubMed] [Google Scholar]
- 20.Nakagawa K, Kawaura A, Kato S, Takeda E, Okano T. 1 α, 25-Dihydroxyvitamin D(3) is a preventive factor in the metastasis of lung cancer. Carcinogenesis. 2005;26(2):429–440. doi: 10.1093/carcin/bgh332. [DOI] [PubMed] [Google Scholar]
- 21.Sunn KL, Cock TA, Crofts LA, Eisman JA, Gardiner EM. Novel N-terminal variant of human VDR. Mol Endocrinol. 2001;15(9):1599–1609. doi: 10.1210/mend.15.9.0693. [DOI] [PubMed] [Google Scholar]
- 22.Tagami T, Lutz WH, Kumar R, Jameson JL. The interaction of the vitamin D receptor with nuclear receptor corepressors and coactivators. Biochem Biophys Res Commun. 1998;253(2):358–363. doi: 10.1006/bbrc.1998.9799. [DOI] [PubMed] [Google Scholar]
- 23.Banwell CM, MacCartney DP, Guy M, Miles AE, Uskokovic MR, Mansi J, et al. Altered nuclear receptor corepressor expression attenuates vitamin D receptor signaling in breast cancer cells. Clin Cancer Res. 2006;12(7 Pt 1):2004–2013. doi: 10.1158/1078-0432.CCR-05-1218. [DOI] [PubMed] [Google Scholar]
- 24.Yan W, Chen W, Liu Z, Huang L. BryostatinI: A dendritic cell stimulator for chemokines induction and a promising adjuvant for a peptide based cancer vaccine. Cytokine. 2010;52(3):238–244. doi: 10.1016/j.cyto.2010.08.010. [DOI] [PubMed] [Google Scholar]
- 25.Clamp A, Jayson GC. The clinical development of the bryostatins. Anti-cancer Drugs. 2002;13(7):673–683. doi: 10.1097/00001813-200208000-00001. [DOI] [PubMed] [Google Scholar]
- 26.Wang S, Guo C-Y, Castillo A, Dent P, Grant S. Effect of bryostatin 1 on taxol-induced apoptosis and cytotoxicity in human leukemia cells (U937) Biochem Pharmacol. 1998;56(5):635–644. doi: 10.1016/s0006-2952(98)00188-9. [DOI] [PubMed] [Google Scholar]
- 27.Asiedu C, Biggs J, Lilly M, Kraft AS. Inhibition of leukemic cell growth by the protein kinase C activator bryostatin 1 correlates with the dephosphorylation of cyclin-dependent kinase 2. Cancer Res. 1995;55(17):3716–3720. [PubMed] [Google Scholar]
- 28.Roberts JD, Smith MR, Feldman EJ, Cragg L, Millenson MM, Roboz GJ. Phase I study of bryostatin 1 and fludarabine in patients with chronic lymphocytic leukemia and indolent (non-Hodgkin's) lymphoma. Clin Cancer Res. 2006;12(19):5809–5816. doi: 10.1158/1078-0432.CCR-05-2730. [DOI] [PubMed] [Google Scholar]
- 29.Faderl S, Lotan R, Kantarjian HP, Harris D, Van Q, Estrov Z. N-(4 Hydroxylphenyl)retinamide (fenretinide, 4-HPR), a retinoid compound with antileukemic and proapoptotic activity in acute lymphoblastic leukemia (ALL) Leuk Res. 2003;27(3):259–266. doi: 10.1016/s0145-2126(02)00162-5. [DOI] [PubMed] [Google Scholar]
- 30.Matsui W, Smith BD, Vala M, Beal N, Huff CA, Diehl LF, et al. Requirement for myeloid growth factors in the differentiation of acute promyelocytic leukaemia. Br J Haematol. 2005;128(6):853–862. doi: 10.1111/j.1365-2141.2005.05395.x. [DOI] [PubMed] [Google Scholar]
- 31.Matsui WH, Gladstone DE, Vala MS, Barber JP, Brodsky RA, Smith BD, et al. The role of growth factors in the activity of pharmacological differentiation agents. Cell Growth Differ. 2002;13(6):275–283. [PubMed] [Google Scholar]
- 32.Das A, Banik NL, Ray SK. Retinoids induced astrocytic differentiation with down regulation of telomerase activity and enhanced sensitivity to taxol for apoptosis in human glioblastoma T98G and U87MG cells. J Neurooncol. 2008;87(1):9–22. doi: 10.1007/s11060-007-9485-1. [DOI] [PubMed] [Google Scholar]
- 33.Wagner KD, Wagner N, Sukhatme VP, Scholz H. Activation of vitamin D receptor by the Wilms’ tumor gene product mediates apoptosis of renal cells. J Am Soc Nephrol. 2001;12(6):1188–1196. doi: 10.1681/ASN.V1261188. [DOI] [PubMed] [Google Scholar]
- 34.Soleymani S, Jeddi-Tehrani M, Akhondi MM, Hashemi M, Ardekani A. Flow cytometric analysis of 4-HPR-induced apoptosis and cell cycle arrest in acute myelocytic leukemia cell line (NB-4) Avicenna J Med Biotech. 2010;2(1):53–61. [PMC free article] [PubMed] [Google Scholar]
- 35.Wagner N, Wagner KD, Schley G, Badiali L, Theres H, Scholz H. 1,25-dihydroxyvitamin D-induced apoptosis of retinoblastoma cells is associated with reciprocal changes of Bcl-2 and bax. Exp Eye Res. 2003;77(1):1–9. doi: 10.1016/s0014-4835(03)00108-8. [DOI] [PubMed] [Google Scholar]
- 36.Bastie JN, Balitrand N, Guillemot I, Chomienne C, Delva L. Cooperative action of 1α,25-dihydroxyvitamin D and retinoic acid in NB4 acute promyelo-cytic leukemia cell differentiation is transcriptionally controlled. Exp Cell Res. 2005;310(2):319–330. doi: 10.1016/j.yexcr.2005.08.001. [DOI] [PubMed] [Google Scholar]
- 37.Taimi M, Chateau MT, Cabane S, Marti J. Synergistic effect of retinoic acid and 1,25-dihydroxyvitamin D3 on the differentiation of the human mono-cytic cell line U937. Leuk Res. 1991;15(12):1145–1152. doi: 10.1016/0145-2126(91)90183-t. [DOI] [PubMed] [Google Scholar]
- 38.Leszczyniecka M, Roberts T, Dent P, Grant S, Fisher PB. Differentiation therapy of human cancer: basic science and clinical applications. Pharmacol Ther. 2001;90(2-3):105–156. doi: 10.1016/s0163-7258(01)00132-2. [DOI] [PubMed] [Google Scholar]
- 39.Hotfʱlder M, Rottgers S, Rosemann A, Jurgens H, Harbott J, Vormoor J. Immature CD34 + CD19 progenitor/stem cells in TEL/ AML1-positive acute lymphoblastic leukemia are genetically and functionally normal. Blood. 2002;100(2):640–646. doi: 10.1182/blood.v100.2.640. [DOI] [PubMed] [Google Scholar]
- 40.Castor A, Nilsson L, Astrand-Grundstrom I, Buitenhuis M, Ramirez C, Anderson K, et al. Distinct patterns of hematopoietic stem cell involvement in acute lymphoblastic leukemia. Nat Med. 2005;11(6):630–637. doi: 10.1038/nm1253. [DOI] [PubMed] [Google Scholar]
- 41.Hotʱlder M, Rottgers S, Rosemann A, Schrauder A, Schrappe M, Pieters R, et al. Leukemic stem cells in childhood high-risk ALL/ t(9;22) and t (4;11) are present in primitive lymphoid-restricted CD34 + CD19 cells. Cancer Res. 2005;65(4):1442–1449. doi: 10.1158/0008-5472.CAN-04-1356. [DOI] [PubMed] [Google Scholar]
- 42.Sato S, Miller AS, Howard MC, Tedder TF. Regulation of B lymphocyte development and activation by the CD19/CD21/ CD81/Leu 13 complex requires the cytoplasmic domain of CD19. J Immunol. 1997;159(7):3278–3287. [PubMed] [Google Scholar]
- 43.Fujimoto M, Poe JC, Hasegawa M, Tedder TF. CD19 regulates intrinsic B lymphocyte signal transduction and activation through a novel mechanism of processive amplification. Immunol Res. 2000;22(2-3):281–298. doi: 10.1385/IR:22:2-3:281. [DOI] [PubMed] [Google Scholar]
- 44.Donis-Hernandez FR, Parkhouse RM, Santos-Argumedo L. Ontogeny, distribution and function of CD38-expressing B lymphocytes in mice. Eur J Immunol. 2001;31(4):1261–1267. doi: 10.1002/1521-4141(200104)31:4<1261::AID-IMMU1261>3.0.CO;2-H. [DOI] [PMC free article] [PubMed] [Google Scholar]
- 45.Springer LN, Stewart BW. N-(4-Hydroxyphenyl) retinamide-induced death in human lymphoblastoid cells: 50 kb DNA breakage as a means of distinguishing apoptosis from necrosis. Cancer Lett. 1998;128(2):189–196. doi: 10.1016/s0304-3835(98)00071-8. [DOI] [PubMed] [Google Scholar]
- 46.Cao J, Xu D, Wang D, Wu R, Zhang L, Zhu H, et al. ROS-driven Akt dephosphorylation at Ser-473 is involved in 4-HPR-mediated apoptosis in NB4 cells. Free Radic Biol Med. 2009;47(5):536–547. doi: 10.1016/j.freeradbiomed.2009.05.024. [DOI] [PubMed] [Google Scholar]
- 47.Clark CS, Konyer JE, Meckling KA. 1α,25-dihydroxyvitamin D3 and bryostatin-1 synergize to induce monocytic differentiation of NB4 acute promyelocy tic leukemia cells by modulating cell cycle progression. Exp Cell Res. 2004;294(1):301–311. doi: 10.1016/j.yexcr.2003.11.013. [DOI] [PubMed] [Google Scholar]
- 48.Steube KG, Grunicke D, Ouentmeier H, Drexler HG. Different effects of the two protein kinase C activator bryostatin-1 and TPA on growth and differentiation of human monocytic leukemia cell lines. Leuk Res. 1993;17(10):897–901. doi: 10.1016/0145-2126(93)90156-f. [DOI] [PubMed] [Google Scholar]
- 49.Chelliah J, Freemerman AJ, Wu-Pang S, Jawis WD, Grant S. Potentiation of ara-C-induced apoptosis by the protein kinase C activator bryostatin 1 in human leukemia cells (HL-60) involves a process dependent upon c-Myc. Biochem Pharmacol. 1997;54(5):563–573. doi: 10.1016/s0006-2952(97)00212-8. [DOI] [PubMed] [Google Scholar]
- 50.Jones RJ, Sharkis SJ, Miller CB, Rowinsky EK, Burke P, May WS. Bryostatin 1, a unique biologic response modifier: anti-leukemic activity in vitro. Blood. 1990;75(6):1319–1323. [PubMed] [Google Scholar]
- 51.Liu M, Lee MH, Cohen M, Bommakanti M, Freedman LP. Transcriptional activation of the Cdk inhibitor p21 by vitamin D3 leads to the induced differentiation of the myelomonocytic cell line U937. Genes Dev. 1996;10(2):142–153. doi: 10.1101/gad.10.2.142. [DOI] [PubMed] [Google Scholar]
- 52.O'Donnell PH, Guo WX, Reynolds CP, Maurer BJ. N-(4-hydroxyphenyl) retinamide increases ceramide and is cytotoxic to acute lymphoblastic leukemia cell lines, but not to non-malignant lymphocytes. Leukemia. 2002;16(5):902–910. doi: 10.1038/sj.leu.2402485. [DOI] [PubMed] [Google Scholar]
- 53.Zhang X, Zhang R, Zhao H, Cai H, Gush K, Kerr R, et al. Preclinical pharmacology of the natural product anti-cancer agent bryostatin 1, an activator of protein kinase C. Cancer Res. 1996;56(4):802–808. [PubMed] [Google Scholar]
- 54.Kortmansky J, Schwartz G. Bryostatin-1: A novel PKC inhibitor in clinical development. Cancer Invest. 2003;21(6):924–936. doi: 10.1081/cnv-120025095. [DOI] [PubMed] [Google Scholar]
- 55.Jarvis WD, Povirk LF, Turner AJ, Traylor RS, Gewirtz DA, Pettit GR, et al. Effects of bryostatin 1 and other pharmacological activators of protein kinase C on 1-(beta-D- arabinofuranosyl)cytosine-induced apoptosis in HL-60 human promyelocytic leukemia cells. Biochem Pharmacol. 1994;47(5):839–852. doi: 10.1016/0006-2952(94)90484-7. [DOI] [PubMed] [Google Scholar]
- 56.Grant S, Turner AJ, Freemerman AJ, Wang Z, Kramer L, Jarvis WD. Modulation of protein kinase C activity and calcium-sensitive isoform expression in human myeloid leukemia cells by bryostatin 1: relationship to differentiation and ara-C-induced apoptosis. Exp Cell Res. 1996;228(1):65–75. doi: 10.1006/excr.1996.0300. [DOI] [PubMed] [Google Scholar]
- 57.Vrana JA, Saunders AM, Chellappan SP, Grant S. Divergent effects of bryostatin 1 and phorbol myristate acetate on cell cycle arrest and maturation in human myelomonocytic leukemia cells (U937) Differentiation. 1998;63(1):33–42. doi: 10.1046/j.1432-0436.1998.6310033.x. [DOI] [PubMed] [Google Scholar]
- 58.Wall NR, Mohammad RM, Nabha SM, Pettit GR, Al-Katib AM. Modulation of cIAP-1 by novel anti-tubulin agents when combined with bryostatin 1 result in increased apoptosis in the human early pre-B acute lymphoblastic leukemia cell line Reh. Biochem Biophys Res Commun. 1999;266(1):76–80. doi: 10.1006/bbrc.1999.1768. [DOI] [PubMed] [Google Scholar]
- 59.Leszczyniecka M, Roberts T, Dent P, Grant S, Fisher PB. Differentiation therapy of human cancer: basic science and clinical applications. Pharmacol Ther. 2001;90(2-3):105–156. doi: 10.1016/s0163-7258(01)00132-2. [DOI] [PubMed] [Google Scholar]
- 60.Studzinski GP, Harrison LE. Differentiation-related changes in the cell cycle traverse. Int Rev Cytol. 1999;189:1–58. doi: 10.1016/s0074-7696(08)61384-4. [DOI] [PubMed] [Google Scholar]
- 61.Wu JM, DiPietrantonio AM, Hsieh TC. Mechanism of fenretinide (4-HPR)-induced cell death. Apoptosis. 2001;6(5):377–388. doi: 10.1023/a:1011342220621. [DOI] [PubMed] [Google Scholar]
- 62.Rao AS, Freemerman AJ, Jarvis WD, Chelliah J, Bear HD, Mikkelsen R, et al. Effect of AS101 on bryostatin 1-mediated differentiation induction, cell cycle arrest, and modulation of drug-induced apoptosis in human myeloid leukemia cells. Leukemia. 1996;10(7):1150–1158. [PubMed] [Google Scholar]
- 63.Bastie JN, Balitrand N, Guidez F, Guillemot I, Larghero J, Calabresse C, et al. 1α,25-dihydroxyvitamin D3 transrepresses retinoic acid transcriptional activity via vitamin D receptor in myeloid cells. Mol Endocrinol. 2004;18(11):2685–2699. doi: 10.1210/me.2003-0412. [DOI] [PubMed] [Google Scholar]
- 64.Janardhanan R, Butler JT, Banik NL, Ray SK. N-(4-Hydroxyphenyl) retinamide potentiated paclitaxel for cell cycle arrest and apoptosis in glioblastoma C6 and RG2 cells. Brain Res. 2009;1268:142–153. doi: 10.1016/j.brainres.2009.02.064. [DOI] [PMC free article] [PubMed] [Google Scholar]
- 65.Reddy CD, Guttapalli A, Adamson PC, Vemuri MC, O'Rourke D, Sutton LN, et al. Anti-cancer effects of fenretinide in human medulloblastoma. Cancer Lett. 2006;231(2):262–269. doi: 10.1016/j.canlet.2005.02.013. [DOI] [PubMed] [Google Scholar]
- 66.Janardhanan R, Banik NL, Ray SK. N-(4-Hydroxyphenyl) retinamide induced differentiation with repression of telomerase and cell cycle to increase interferon-c sensitivity for apoptosis in human glioblastoma cells. Cancer Lett. 2008;261(1):26–36. doi: 10.1016/j.canlet.2007.11.016. [DOI] [PMC free article] [PubMed] [Google Scholar]
- 67.Wang S, Wang Z, Boise LH, Dent P, Grant S. Bryostatin 1 enhances paclitaxel-induced mitochondrial dysfunction and apoptosis in human leukemia cells (U937) ectopically expressing Bcl-x. Leukemia. 1999;13(10):1564–1573. doi: 10.1038/sj.leu.2401532. [DOI] [PubMed] [Google Scholar]
- 68.Mohammad RM, Diwakaran H, Maki A, Emara MA, Pettit GR, Redman B, et al. Bryostatin 1 induced apoptosis and augments inhibitory effects of Vincristine in human diffuse large cell lymphoma. Leuk Res. 1995;19(9):667–673. doi: 10.1016/0145-2126(95)00037-o. [DOI] [PubMed] [Google Scholar]
- 69.Artaza JN, Sirad F, Ferrini MG, Norris KC. 1α,25 (OH)2vitamin D3 inhibits cell proliferation by promoting cell cycle arrest without inducing apoptosis and modifies cell morphology of mesenchymal multipotent cells. J Steroid Biochem Mol Biol. 2010;119(1-2):73–83. doi: 10.1016/j.jsbmb.2010.01.001. [DOI] [PMC free article] [PubMed] [Google Scholar]
- 70.Elstner E, Linker-Israeli M, Umiel T, Le J, Grillier I, Said J, et al. Combination of a potent 20-epi-vitamin D3 analogue (KH1060) with 9-cis retinoic acid irreversibly inhibits clonal growth, decreases bcl-2 expression, and induces apoptosis in HL-60 leukemic cells. Cancer Res. 1996;56(15):3570–3576. [PubMed] [Google Scholar]
- 71.James SY, Turner A, Colston KW. Induction of apoptosis in human leukemia cells is differentially regulated by vitamin D derivatives and retinoids. Hematology. 1997;2:289–301. doi: 10.1080/10245332.1997.11746348. [DOI] [PubMed] [Google Scholar]
- 72.Rajapakse R, Mousli M, Pfaff AW, Uring-Lambert B, Marcellin L, Bronner C, et al. 1α,25-Dihydroxy-vitamin D3 induces splenocyte apoptosis and enhances BALB/c mice sensitivity to toxoplasmosis. J Steroid Biochem Mol Biol. 2005;96(2):179–185. doi: 10.1016/j.jsbmb.2005.03.002. [DOI] [PubMed] [Google Scholar]
- 73.Flynn G, Chung I, Yu WD, Romano M, Modzelewski RA, Johnson CS, et al. Calcitriol (1,25-dihydroxycholecalciferol) selectively inhibits proliferation of freshly isolated tumor-derived endothelial cells and induces apoptosis. Oncology. 2006;70(6):447–457. doi: 10.1159/000098872. [DOI] [PubMed] [Google Scholar]
- 74.Hail N, Jr, Kim HJ, Lotan R. Mechanisms of fenretinide-induced apoptosis. Apoptosis. 2006;11(10):1677–1694. doi: 10.1007/s10495-006-9289-3. [DOI] [PubMed] [Google Scholar]
- 75.Sun SY, Yue P, Kelloff GJ, Steele VE, Lippman SM, Hong WK, et al. Identification of retinamides that are more potent than N-(4-hydroxyphenyl) retinamide in inhibiting growth and inducing apoptosis of human head and neck and lung cancer cells. Cancer Epidemiol Biomarkers Prev. 2001;10(6):595–601. [PubMed] [Google Scholar]
- 76.Holmes WF, Soprano DR, Soprano KJ. Comparison of the mechanism of induction of apoptosis in ovarian carcinoma cells by the conformationally restricted synthetic retinoids CD437 and 4-HPR. J Cell Biochem. 2003;89(2):262–278. doi: 10.1002/jcb.10505. [DOI] [PubMed] [Google Scholar]
- 77.Boya P, Morales MC, Gonzalez-Polo RA, Andreaux K, Gourdier I, Perfettini JL, et al. The chemo-preventive agent N-(4-hydroxyphenyl) retinamide induces apoptosis through a mitochondrial pathway regulated by proteins from the Bcl-2 family. Oncogene. 2003;22(40):6220–6230. doi: 10.1038/sj.onc.1206827. [DOI] [PubMed] [Google Scholar]
- 78.da Costa Alfonso ZZ, de Souza MA, de Castro S, Neumann J, Nardi NB. Monoclonal antibodies detecting differentiation antigens on human leukocytes. Immunol Lett. 2003 3;86(1):53–55. doi: 10.1016/s0165-2478(02)00267-5. [DOI] [PubMed] [Google Scholar]
- 79.Lin TL, Vala MS, Barber JP, Karp JE, Smith BD, Matsui W, et al. Induction of acute lymphocytic leukemia differentiation by maintenance therapy. Leukemia. 2007;21(9):1915–1920. doi: 10.1038/sj.leu.2404823. [DOI] [PMC free article] [PubMed] [Google Scholar]
- 80.Cox CV, Evely RS, Oakhill A, Pamphilon DH, Goulden NJ, Blair A. Characterization of acute lymphoblastic leukemia progenitor cells. Blood. 2004;104(9):2919–2925. doi: 10.1182/blood-2004-03-0901. [DOI] [PubMed] [Google Scholar]
- 81.Stoeckler JD, Stoeckler HA, Kouttab N, Maizel AL. 1alpha, 25Dihydroxyvitamin D3 modulates CD38 expression on human lymphocytes. J Immunol. 1996;157(11):4908–4917. [PubMed] [Google Scholar]
- 82.Campana D, Behm FG. Immunophenotyping of leukemia. J Immunol Methods. 2000;243(1-2):59–75. doi: 10.1016/s0022-1759(00)00228-3. [DOI] [PubMed] [Google Scholar]
- 83.Lewis RE, Cruse JM, Sanders CM, Webb RN, Tillman BF, Beason KL, et al. The immunophenotype of pre-TALL/LBL revisited. Exp Mol Pathol. 2006;81(2):162–165. doi: 10.1016/j.yexmp.2006.06.006. [DOI] [PubMed] [Google Scholar]
- 84.Popov AM, Verzhbitskaia TIu, Tsaur GA, Shorikov EV, Savel'ev LI, Tsvirenko SV, et al. Minimal residual disease monitoring by flow cytometry in children with acute lymphoblastic leukemia. Klin Lab Diagn. 2010;8:36–41. [PubMed] [Google Scholar]
- 85.Babusikova O, Stevulova L, Fajtova M. Immuno-phenotyping parameters as prognostic factors in T- acute leukemia patients. Neoplasma. 2009;56(6):508–513. doi: 10.4149/neo_2009_06_508. [DOI] [PubMed] [Google Scholar]
- 86.al-Katib A, Mohammad RM, Khan K, Dan ME, Pettit GR, Sensenbrenner LL. Bryostatin 1-induced modulation of the acute lymphoblastic leukemia cell line Reh. J Immunother Emphasis Tumor Immunol. 1993;14(1):33–42. doi: 10.1097/00002371-199307000-00005. [DOI] [PubMed] [Google Scholar]
- 87.Wall NR, Mohammad RM, Al-Katib AM. Mitogen-activated protein kinase is required for bryostatin 1-induced differentiation of the human acute lymphoblastic leukemia cell line Reh. Cell Growth Differ. 2001;12(12):641–647. [PubMed] [Google Scholar]