Abstract
A cell separation strategy capable of the systematic isolation and collection of moderate to large numbers (25–400) of single cells into a targeted microwell is demonstrated. An array of microfabricated, releasable, transparent micron-scale pedestals termed pallets and an array of microwells in poly(dimethylsiloxane) (PDMS) were mated to enable selective release and retrieval of individual cells. Cells cultured on a pallet array mounted on a custom designed stage permitted the array to be positioned independently of the microwell locations. Individual pallets containing cells were detached in a targeted fashion using a pulsed Nd:YAG laser. The location of the laser focal point was optimized to transfer individual pallets to designated microwells. In a large-scale sort (n = 401), the accuracy, defined as placing a pallet in the intended well, was 94% and the collection efficiency was 100%. Multiple pallets were observed in only 4% of the targeted wells. In cell sorting experiments, the technique provided a yield and purity of target cells identified by their fluorescence signature of 91% and 93%, respectively. Cell viability based on single-cell cloning efficiency at 72 h post collection was 77%.
1. Introduction
Cells are highly heterogeneous in their genetic, proteomic, metabolic and behavioral traits, even among individual cells within a clonal population.1–6 Many of the techniques to measure these traits require bulk samples where the admixture of cells with different characteristics presents a source of bias. Individual cells contained in heterogeneous cellular ensembles can be analyzed using microscopy, patch clamp methods, or microanalytical chemical separations techniques. Bulk assays, such as western blotting, protein and oligonucleotide microarrays, and standard PCR techniques can benefit from sorting cells into a homogeneous population prior to analysis.1–3, 7–9 Thus, substantial effort has historically been directed toward separating and collecting cells to create homogeneous populations for further study or expansion.
Cell sorting can be broken down into three steps: identification, separation and collection; with approaches for cell sorting generally divided into two formats -- bulk or single-cell. Bulk sorting is usually an enrichment technique when a large sample size is required and the provided purity is acceptable. Conventional approaches include gradient centrifugation, magnetic cell sorting, and panning.10–12 More challenging is single-cell sorting wherein each cell is identified individually based on one or more characteristics and is then independently separated from the population and placed in a unique location. Sorting by fluorescence activated cell sorting (FACS) utilizing a flow sorter capable of generating piezoelectric-induced droplets places single cells into the individual wells of a multi-well plate. FACS requires an expensive instrument and works only with cells in suspension such as nonadherent cells or adherent cells detached from a surface utilizing potentially cell-altering proteolytic enzymes. FACS is also limited to single time-point measurements.13 Limiting dilution and cloning rings require little technology to isolate single cells, but are very low throughput, labor intensive, and are generally not paired with an identification step.10 A variety of reports have used the principles of ink-jet printing and related technologies to deposit single cells at defined locations, typically for arraying purposes, although upstream identification and separation prior to deposition has not been demonstrated.14–18 Sophisticated techniques have been developed using pulsed lasers for the direct transfer of single cells from one vessel to another, chiefly laser-induced forward transfer (LIFT) and laser microdissection with laser pressure catapulting (LMPC).19, 20 LIFT was first described for the deposition of copper metal patterns inside a vacuum chamber, but subsequent modifications of the process have enabled the technique to be used to array cells.21–23 While the technique is suitable for transfer of random cells suspended in buffer, identification of cells followed by selective transfer is problematic. Many cell types grow adherently and are stressed by the processes needed to place them into suspension; therefore approaches to isolate cells while remaining in an adherent state have been sought.24 Laser microdissection is one such approach, although it is used predominantly to obtain tissue sections for genetic and proteomic studies due to the need to dehydrate the specimen.25 LMPC, a derivative of this approach, uses laser-based “catapulting” of a dissected sample into an overlying tube.26 Modifications of this protocol enable a thin film of liquid to remain during dissection, but the UV-absorbing polymer foil needed to protect the cells from damage hampers imaging, and shear stresses on the cells during catapulting are detrimental to cell health.20, 27
The emergence of microfabricated platforms is expected to bring a number of advances in this area by sorting very small samples and efficiently manipulating individual cells.28–31 Flow switching by hydrodynamic or electrokinetic means has been shown in a number of studies, although target cells are usually collected as an enriched population into a downstream reservoir rather than individually.32–35 Cell separation by differential passage through a bed of microstructures as a result of differences in the size or adhesive properties of the cells has been successfully exploited in a number of devices, but suffers from the problem of releasing and collecting the cells in a viable state.36, 37 Cells have also been selected by deflection or trapping using dielectrophoretic, magnetic, or optical methods. In these cases, collection is simplified by the ability to switch on and off capture forces, although challenges in manipulating cells individually and efficiently have meant that most demonstrations have been for enrichment instead of isolation of single cells.29 Droplet microfluidics is a microfluidic format that produces high-throughput, emulsion-based compartmentalization for chemical and biological assays.38 Cells have been entrapped and sorted using dielectrophoresis, although single-cell collection followed by culture to form colonies has not yet been reported.39, 40 Optical tweezers have been combined with microfabricated cell capture wells to enable microscopic analysis and selection of specific cells by optically levitating individual cells into a flow stream that carries the cell into a downstream reservoir.41 In practice, purity has been limited due to non-target cells being swept from the array into the collection reservoir, and while theoretically capable of single cell isolation, this has yet to be demonstrated.
The Allbritton Group has pursued the development of a microarray format designed to permit analysis and sorting while cells remain attached to their culture surface.42, 43 The elements of the array (termed pallets) are fabricated from a biocompatible photoresist on a glass substrate using standard photolithography. A pulsed laser focused at the interface of the substrate and base of the pallet is used to disrupt the adhesion of the pallet to its glass substrate making it possible to release individual pallets for collection with high cell viability.43, 44 While release and collection of viable single cells or colonies can be accomplished with high efficiency, the segregation of the detached elements requires the pallets to be released and collected sequentially to maintain the clonality of the collected cells. An improved system for collecting and segregating large numbers of individual cells/colonies from the pallet array would extend the usefulness of this cell sorting technology.
To this end, we describe an efficient strategy to systematically place hundreds of single pallets into selected microwells following laser-based release of the pallets from their substrate. A microscope-mounted system enabling the mating and alignment of an array containing 10,000 pallets with an array of microwells was developed. Experiments were carried out to optimize the targeting of individual pallets into selected microwells by controlling the location of the laser focal point with respect to the pallet. To demonstrate the feasibility of this cell separation and collection method, viable cells were isolated based on their fluorescence signature. Yield, purity and viability of the collected cells were determined.
2. Experimental
2.1 Array Fabrication by Photolithography and Soft Lithography
Pallet arrays were fabricated as previously described.42, 45 Briefly, arrays (typically 104 pallets) composed of pallets of varying dimensions with 50 µm gaps, unless otherwise specified, were fabricated by photolithography using 1002F photoresist.45 After fabrication, an organosilane ([heptadecafluoro-1,1’, 2, 2’-tetrahydrodecyl] trichlorosilane, Gelest, Morrisville, PA) layer was applied by vapor-deposition in a vacuum chamber.46 This hydrophobic organosilane layer was applied in order to produce heterogeneous wetting of the array when it was submerged in media. The resulting air entrapped between the pallets, termed a virtual air wall, served to restrict cells to the upper surface of the pallets during cell plating. A 12 mm × 12 mm × 12 mm ring formed from molded PDMS was created and then plasma treated for 2 min (200 mTorr, 200 W). The ring was attached to the glass substrate to form an open reservoir surrounding the array. The master mold for the microwells was fabricated in a similar fashion to the pallet arrays and is described in greater detail in the Supplemental Information as is the production of the PDMS microwell array.
2.2 Plating and Culture of Cells on the Pallet Array
Cell lines used in this work were: HeLa, a human cervical carcinoma cell line; A2058, human melanoma cells stably transfected with Lifeact-tdTomato (kindly provided by James Baer, UNC-Chapel Hill); and H1299, human lung carcinoma cells stably transfected with green fluorescent protein (GFP) (kindly provided by Adrian Cox, UNC-Chapel Hill). Before seeding cells onto pallets, arrays were sterilized with 75% ethanol for 30 min. Arrays were then coated with fibronectin as previously described with minor modification.43 Briefly, the pallet array was incubated in 1 mL of 25 µg/ml human plasma fibronectin (Millipore, Billerica, MA) in phosphate buffered saline (PBS, 137mM NaCl, 2.7 mM KCl, 10 mM Na2HPO4, 1.75 mM KH2PO4, pH 7.4) for 45 min. The solution was aspirated and the array rinsed ×3 with PBS. Arrays were allowed to dry before cell suspensions were added. To plate cells, 1 mL of the suspension at the desired cell density was added and cells were allowed to settle and adhere overnight in a tissue culture incubator until ready for use. Conditioned media for use in viability experiments was prepared as previously described.43 The conditioned media was mixed 1:1 with DMEM supplemented with 50% FBS and 1% Pen:Strep, and was utilized during both collection and culture.
2.3 Preparation of the Microwell Array for Cell Retrieval
After fabrication, microwell arrays were rinsed several times with 75% ethanol and blown dry with nitrogen. Arrays were then plasma treated for 4 min and submersed in PBS in a 60 × 15 mm Petri-dish (BD Falcon, Franklin Lakes, NJ) in order to retain the PDMS hydrophilicity. The arrays were sterilized by UV exposure for 30 min. The PBS was then removed and the microwell array was incubated in 1 mL of 25 µg/mL fibronectin solution for 2 h. The fibronectin solution was aspirated and the coated microwell arrays were rinsed ×2 with 1 mL PBS, then ×1 with 1 mL cell culture media or conditioned media. The microwell array was covered with 1 mL media, which made contact with the pallet arrays when they were aligned. After this preparation, the microwell array was mounted on a rotary stage that would allow multiple microwell arrays to be sequentially aligned with a pallet array for successive cell retrieval if desired (see Supplemental Information).
2.4 Pallet Release and Collection
An upright epifluorescence microscope (Eclipse E800, Nikon, Melville, NY) integrated with a pulsed Nd:YAG laser (see below) was used for imaging the array and release of the pallets. The microscope was enclosed in a custom-built Plexiglas® housing with humidity and temperature controls provided by an Air-Therm ATX-H Controller (75% humidity, 37°C, World Precision Instruments, Sarasota, FL) and CO2 control provided by a ProCO2 Controller (4% CO2, Biospherix, Lacona, NY). The Plexiglas® housing was cleaned with ethanol to assist in maintaining sterility. Prior to pallet release and collection, both the pallet array mount and the rotary collection disk were disinfected with 75% ethanol for 30 min. Using sterile technique, microwell arrays were placed on the rotary disk, covered with a Petri-dish, and transferred to the microscope enclosure. Pallet arrays containing cells and culture media were gently aspirated and rinsed ×3 with 1 mL PBS followed by a rinse and final immersion in 1 mL culture media or conditioned media. For the experiment, the pallet array was adhered to the PDMS surface of the pallet array mount, and the PDMS reservoir surrounding the pallet array was removed. The pallet array was covered with a Petri dish to maintain sterility, and the assembly was moved to the microscope enclosure. Once in the sterilized microscope enclosure, the covering Petri dishes were removed from the microwell and pallet arrays. No microbial contamination was seen in any experiments following the antiseptic procedures listed above. The pallet array mount was then attached to the microscope stage via a fixed rail with the pallet array now in an inverted orientation. The mount was aligned with one of the microwell arrays on the rotary disk, fixed in place, and lowered into the media contained in the microwell array reservoir. The distance from the microwells to the pallet array was set with a PDMS spacer or by using the micrometer of the microscope’s focus knob to determine the z-position of the two arrays.
Once the pallet and microwells were aligned, pallets were released into microwells with single laser pulses (3.8 µJ, 5 ns pulse width, λ=532 nm) from a frequency-doubled Q-switched Nd:YAG laser (ACL-1, New Wave Research, Fremont, CA) focused at the glass/pallet interface as previously described42 using a 20×, 0.45NA, objective (Nikon, Melville, NY). After the desired number of pallets were released and collected, the pallet array holder was raised and removed from the microscope stage leaving the microwell array on the rotary disk. The microwell array was imaged or moved to a tissue culture incubator depending on the experiment.
2.5 Measurements of Pallet Travel Distance and Angle
Pallets were released as described above with a separation distance of 2 mm created by placing a 20 mm × 20 mm × 2 mm PDMS reservoir between the pallet array substrate and a flat PDMS substrate. Water was used to fill the reservoir. Images were taken of the pallets’ release location and final location on the PDMS substrate after release. Using ImageJ software47 (NIH, Bethesda, MD), the pallet’s lateral distance of travel was calculated and the lateral angle of release was determined (zero degrees being defined as directly east of pallet center before release).
2.6 Pallet Collection Efficiency, Accuracy and Cross-Talk
Collection efficiency was defined as the percentage of released pallets collected within the microwell array. Pallets were released using the procedure described above with the intent of collection into a specific microwell. Accuracy was defined as the percentage of pallets collected in their intended microwells. Cross-talk was defined as pallets collected in an undesired well.
2.7 Purity of Cells after Release and Collection
A mixed population (6000 cells) composed of equal numbers of H1299 (green fluorescence) and A2058 (red fluorescence) cells were plated on a pallet array such that the majority of pallets contained ≤1 cell as previously described.43 After 24 h, 50 pallets containing single cells fluorescing in the red were released from the pallet array and collected in the microwell array. Wells containing the released pallets were then examined for cells with red or green fluorescence.
2.8 Cell Viability after Release and Collection
HeLa cells expressing a GFP-histone fusion protein (5000 cells) were plated on a pallet array at ≤1 cell per pallet. After 24 h, 25 pallets (each 50 µm × 50 µm × 50 µm) with an adherent, GFP-expressing HeLa cell were released into the microwell array. Microwell arrays were then placed in a Petri dish, filled with conditioned media, and transferred to a tissue culture incubator for 72 h. Wells containing released pallets were then examined for cell viability. Viable cells were defined as those that were able to divide and form a clonal colony (i.e. single-cell cloning efficiency). The ability to form a clonal colony was assessed by counting the number of cells in the microwell over time.
3. Results and Discussion
3.1 Pallet Trajectory Following Release
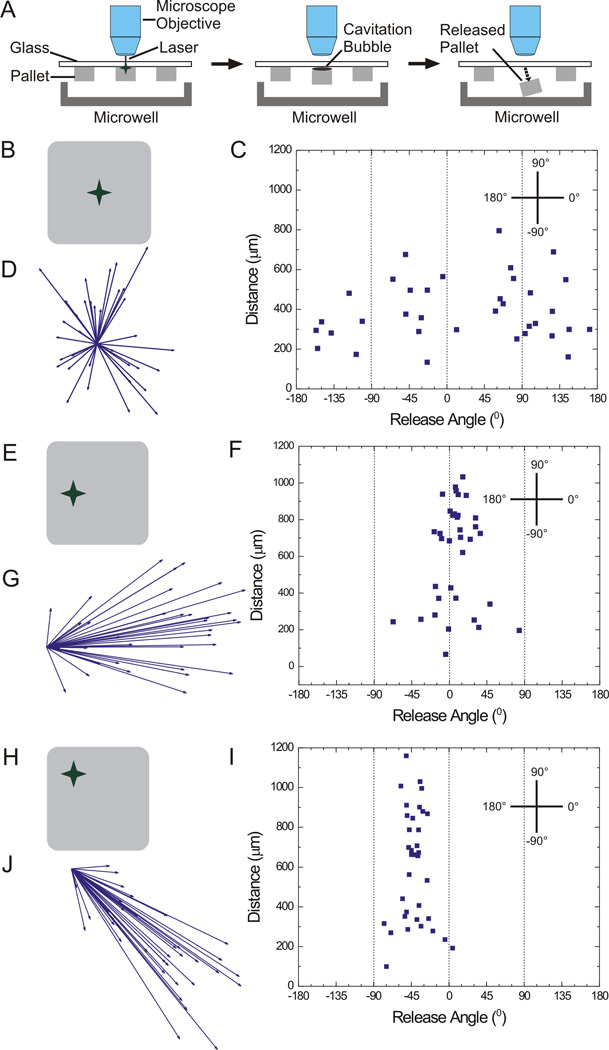
Pallets were released from the array by focusing the laser on the center of the pallet at the interface of the pallet and glass substrate. The deposition of energy creates a cavitation bubble that disrupts the pallet’s adhesion to the glass (Fig. 1A).44 Pallets followed random trajectories with lateral spreads of up to 800 µm over the 2-mm distance traveled to the collection surface (Fig. 1B-D). The average lateral distance traveled was 397 µm ± 159 µm (n = 35 pallets) and the average angle was 18° ± 100°. This random release trajectory was likely the result of non-directional expansion of the cavitation bubble ejecting the pallet in random directions.44, 48 Under these conditions, 68.3% of released pallets fell into an area of 0.97 mm2 (average ± 1 standard deviation) on the collection surface. This substantial spread in the pallet trajectories would necessitate very large wells (1 mm × 1 mm) in order to place each released pallet in its own collection container.
Fig. 1.
Examination of various pallet release angles and travel distances upon laser-based release. A) Schematic of pallet release by a single laser pulse. B) Schematic demonstrating the central location of the laser focal point used for (C, D). C) Scatter plot of release angle and distance travelled for 50 µm × 50 µm × 50 µm pallets (n = 35) released as in “B”. D) Vector diagram of release angle and distance travelled for pallets shown in “C”. E) Schematic showing the focal point on central left edge of pallets as used for (F, G). F) Scatter plot of release angle and distance travelled for 50 µm × 50 µm × 50 µm pallets (n = 35) released as in “E”. G) Vector diagram of release angle and distance travelled for pallets shown in “F”. H) Schematic of the focal point used for (I, J). I) Scatter plot of release angle and distance travelled for 50 µm × 50 µm × 50 µm pallets (n = 35) released as in “H”. J) Vector diagram of release angle and distance travelled for pallets shown in “I”.
3.2 Pallet Trajectory Dependence on Laser Focal Point Location
Based on random pallet trajectories following centrally focused laser release, it was hypothesized that positioning the laser focal point away from the center of the pallet might provide a controllable trajectory (and more limited surface area for pallet collection) since the gas bubble may expand the shortest distance available to escape into the medium.44 The dependence of pallet trajectory on the laser focal point location was assessed for pallets (50 µm × 50 µm × 50 µm) released with the focal point centered along the edge or at a corner of the pallet (Fig. 1 B-D, E-G and H-J, respectively). For those pallets targeted at their edge (n = 35), the average release angle was 7.7° ± 26°, and the average travel distance was 614 ± 281 µm (Fig. 1F, G). Under these conditions, 68.3% of released pallets fell within an area of 0.27 mm2 on the collection surface. The average release angle and distance traveled for pallets released at their corner (n = 35) was −41° ± 16° and 603 ± 284 µm (Fig. 1I, J). For this release strategy, 68.3% of released pallets fell within an area of 0.19 mm2 on the collection surface. These data suggested that it was possible to impart a desired trajectory to the pallet, enhancing the likelihood of placement into a defined collection area. Both the side and corner-release strategies placed the pallets is a similar-sized area which was 3–5× smaller in size than that for the pallets released with a centered focal point.
3.3 Impact of Pallet Height on Pallet Trajectory
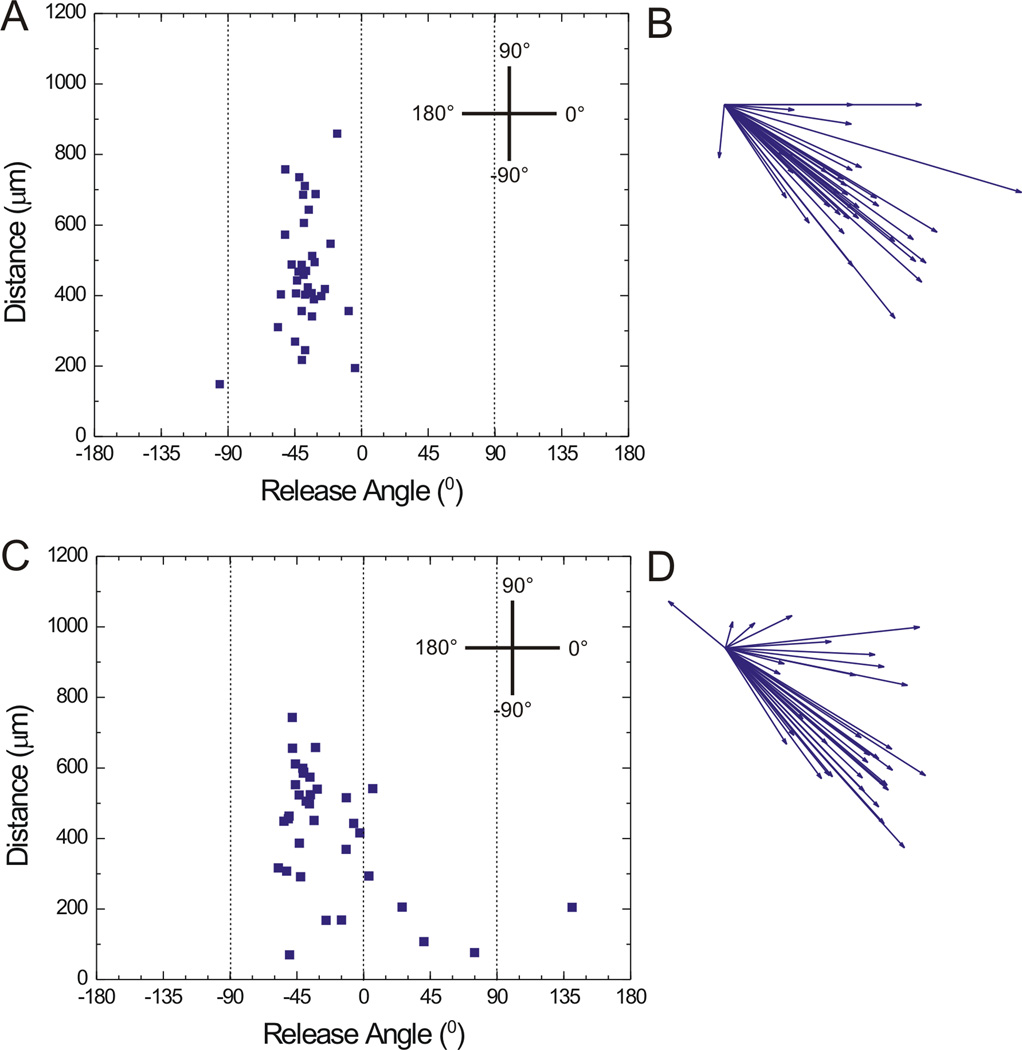
Immediately following release, pallets travel a path with the adjacent pallets imposing a potential boundary on the released pallet’s trajectory. Larger aspect ratio pallets may create a more restricted pallet flight path. For this reason, the impact of pallet height on the trajectory of pallets of three different heights (50, 100, and 150 µm) was assessed when released using a laser pulse positioned at their corner as described above. Pallets demonstrated release angles/travel distances of −41° ± 17°/603 µm ± 284 µm, −38° ± 15°/466 µm ± 168 µm, and −22° ± 41°/425 µm ± 178 µm for pallets of heights of 50 µm (Fig. 1 I, J), 100 µm (Fig. 2 A, B), and 150 µm (Fig. 2 C, D) respectively. Under these conditions the height of the pallet had minimal influence on the pallet trajectory. Thus it was unlikely that the pallets neighboring the released pallet acted as a guide or boundary for pallet movement during release. Geometric considerations based on the lateral travel of the released pallet and the pallet height, interpallet spacing, and the substrate-pallet array distance also support this conclusion.
Fig. 2.
Examination of the impact of pallet height on release angle and travel distance. A) Scatter plot of release angle and distance travelled for 50 µm × 50 µm × 100 µm pallets (n = 35). B) Vector diagram of release angle and distance travelled for pallets shown in “A”. C) Scatter plot of release angle and distance travelled for 50 µm × 50 µm × 150 µm pallets (n = 35). D) Vector diagram of release angle and distance travelled for pallets shown in “C”.
3.4 Design of a Collection System
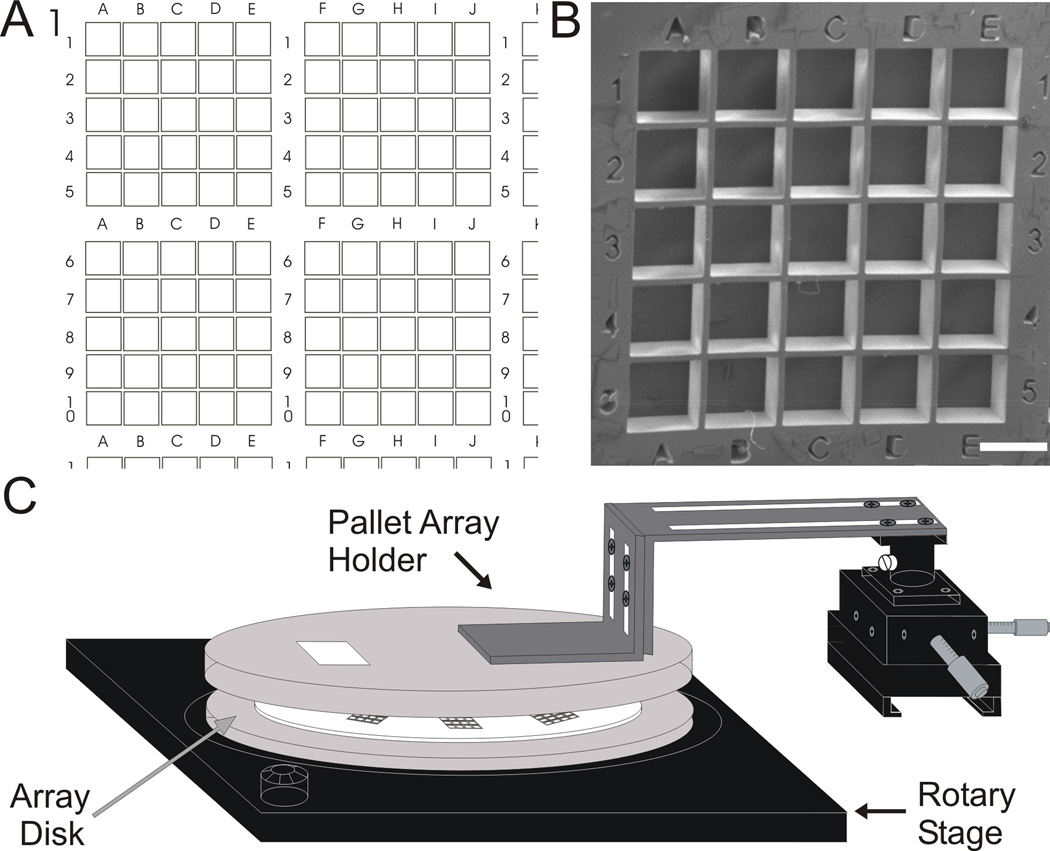
A pattern of microwells that facilitated individual pallet capture was designed. The plate incorporated a series of 4 × 4 sub-sections each composed of 5 × 5 arrays of microwells (Fig. 3A). An alphanumeric code patterned in the array provided a unique address for each section and well. Well depth was 300 ± 20 µm (Fig. 3B). To minimize the area of the individual microwells, the distance between the pallet array and collection substrate was decreased from 2 mm to 650 µm. For edge-released pallets, this redesign decreased the observed spatial spread of the released pallets on the collection surface to 0.09 and 0.18 mm2 (for 68.3% and 95.4% pallets collected, respectively). Square microwells with a 450-µm side (0.20 mm2 area) were predicted to yield a high capture rate.
Fig. 3.
Description of the collection system. A) Schematic of a microwell array showing four of the 16 sub-arrays each containing 25 individual microwells. B) Electron micrograph of one sub-array containing 25 microwells (450 µm × 450 µm × 300 µm, scale bar is 450 µm). C) Schematic of rotary stage for the microwell array aligned with the pallet array holder.
The pallet array was incorporated in an inverted position onto a mount over an array of microwells. While the footprint of the pallet array and microwell plate were the same (1 cm × 1 cm), the lack of correspondence in the number of pallets (10,000) to wells (400) on each array limited the number of cells that could be collected individually in any one experiment. Consequently a rotational stage was developed to hold a series of microwell arrays below the pallet array. Sequential collection of pallets/cells into multiple microwell arrays could be performed by rotating the microwell arrays beneath the stationary pallet array (see Supplementary Information, Fig. S1, Fig 3C). A PDMS layer (1 mm) was used to attach pallet arrays to an acrylic disk. Once cured, this PDMS layer enabled self-adhesion of the pallet array’s glass substrate to the mount (Fig. S2). The PDMS was readily cleaned with ethanol and could be used repeatedly. Slots in one of the two aluminum “L” braces allowed coarse positioning of the pallet array mount before the experiment, and a 3-axis micromanipulator controlled movement of the pallet array independent of the microscope stage to enable fine adjustment of pallet position for targeted release.
3.5 Pallet Collection Accuracy, Efficiency, Cross-Talk, and Retention
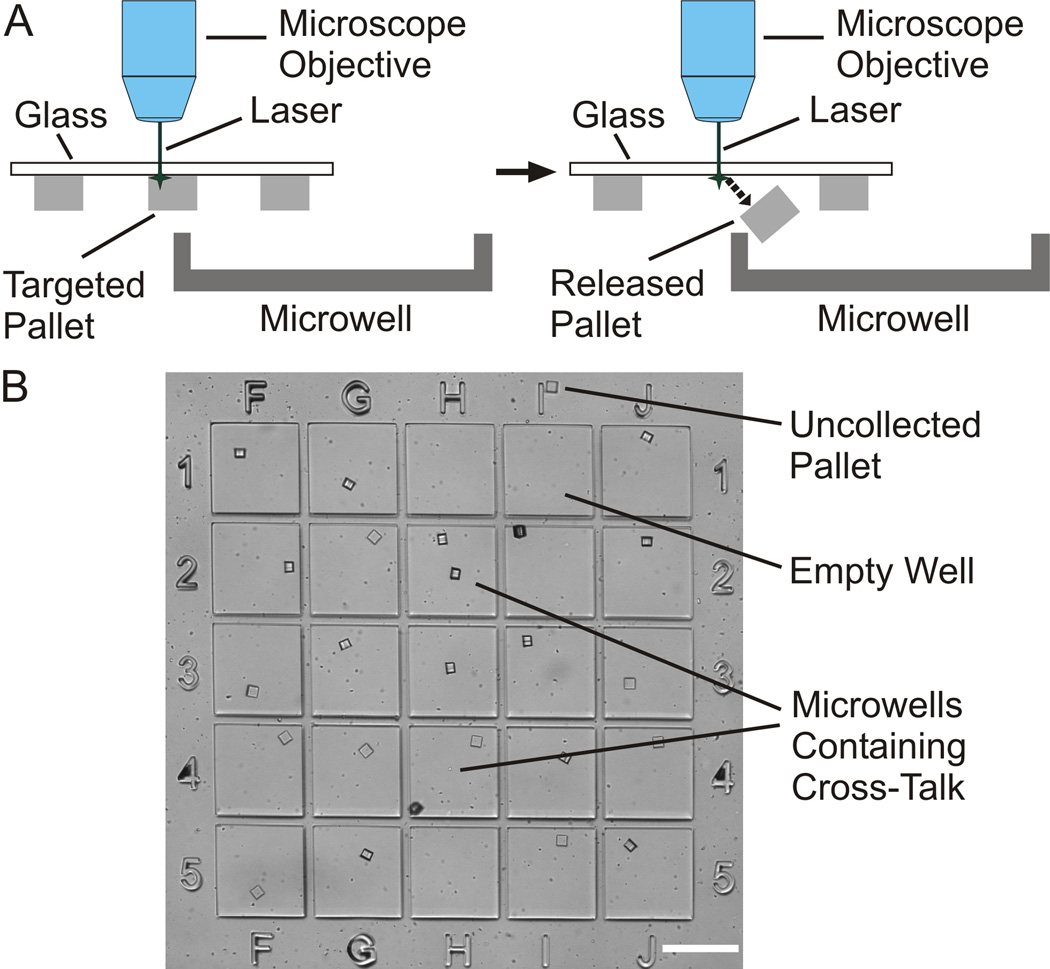
To evaluate the overall effectiveness of the collection system, small-scale release and collection experiments were first conducted. In each trial, 25 pallets (50 µm × 50 µm × 50 µm) were released with the laser focused at their left central edge and targeted to 25 defined wells (Fig. 4A). Initially, microwells of 450 µm × 450 µm and 200 µm deep were employed, but it was noted that movement of the arrays after collection led to loss of pallets from a significant number of wells with only 20% of the pallets retained in their original well. Subsequent experiments employed 300-µm-deep wells. In three independent experiments, 95% ± 6% of the pallets were collected accurately, with only 4% ± 4% of the wells expressing cross-talk (Fig. 4B). The overall collection efficiency of these experiments was 99% ± 2%. Arrays were then carried by hand to a different microscope and re-imaged to evaluate the impact of moving the array on pallet retention. The percentage of pallets retained in their original wells was 99% ± 2%.
Fig. 4.
Determination of accuracy, efficiency, and cross-talk during pallet collection. A) Schematic demonstrating release and collection technique of a pallet aligned with the edge of a microwell and released with a laser pulse focused near the pallet edge. B) Image of 5×5 microwell sub-array containing 25 pallets demonstrating pallets collected in target wells, an uncollected pallet (above “1I”), and microwells with cross-talk (“1H&2H” and “4H&5H”). Empty wells resulting from cross-talk and an uncollected pallet are seen in “1H&I” and “5H”. (scale bar is 450 µm).
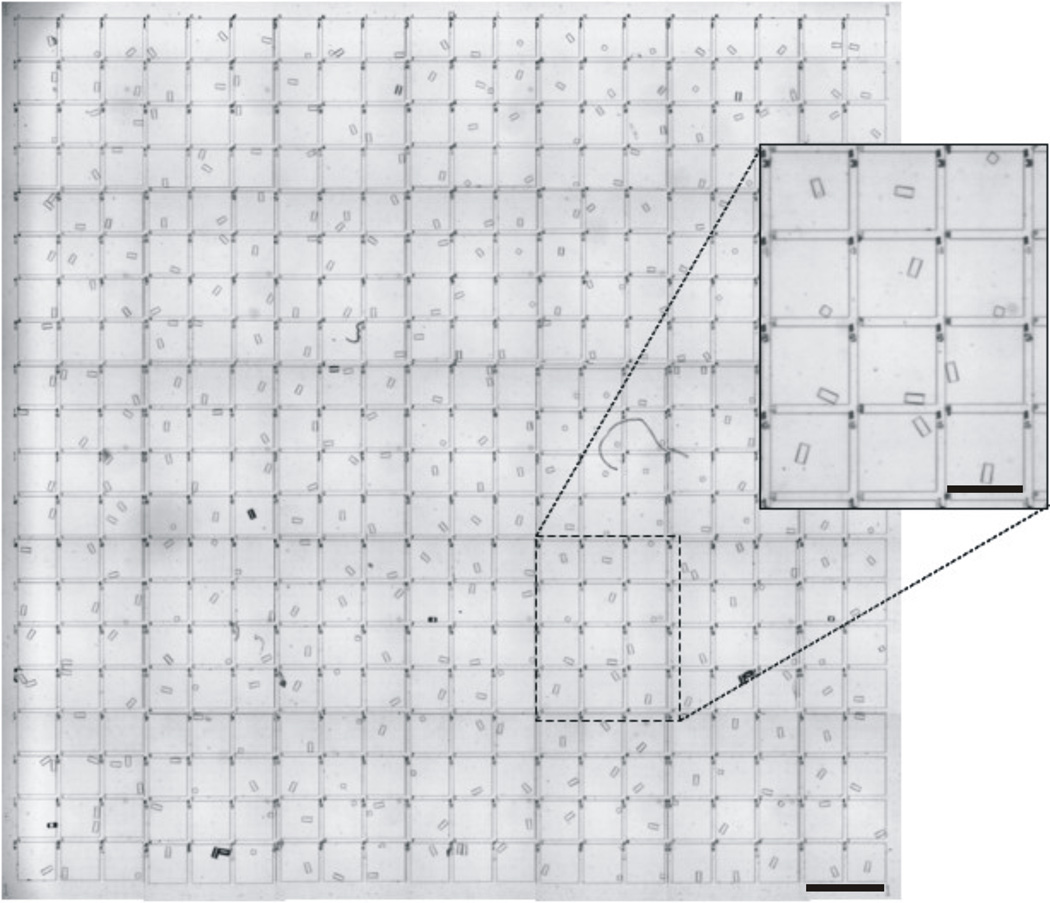
To demonstrate the feasibility of large-scale pallet release and collection, 401 pallets were consecutively released with the laser focused at their central left edge and collected (Fig. 5) using the optimized method. In this experiment, 94% of the pallets were accurately collected into the desired microwell, with 6% of pallets in non-targeted wells. Overall collection efficiency and retention were both 100%. These findings compared well with the results of the small-scale experiments, demonstrating the feasibility of large-scale pallet release and collection using the platform.
Fig. 5.
Demonstration of large-scale pallet release and collection. Image of 400 microwells (addresses omitted) containing 401 pallets collected to demonstrate feasibility of large-scale pallet release and collection (scale bar is 900 µm) with inset of magnified view of microwells (scale bar is 450 µm).
3.6 Purity of Cells after Release and Collection
To assess the purity of cells isolated with the collection system, a mixed population of fluorescent cells (H1299 [green] and A2058 [red]) was seeded onto arrays of pallets (50 µm × 50 µm × 50 µm) at ≤1 cell per pallet. In each of 3 independent experiments, 50 pallets possessing cells fluorescing in the red were targeted for collection. Each pallet was aligned with the center of the left edge of the desired microwell. The pallets were released with a single laser pulse focused just inside of the pallet’s central left edge. After collection, the microwell array was imaged for both green and red fluorescence to determine the type of cell collected in each microwell. The yield as determined by wells that contained pallets with a red cell was 91% ± 1%. In 7% ± 1% of microwells there was a single pallet, but both red and green fluorescent cells were present. On average, 2% of the wells did not contain pallets. The presence of undesired GFP-expressing cells in the occasional microwell was likely due to free cells that had detached from the pallet array and settled onto the microwell array during the collection procedure.
3.7 Cell Viability Post-Release and Collection
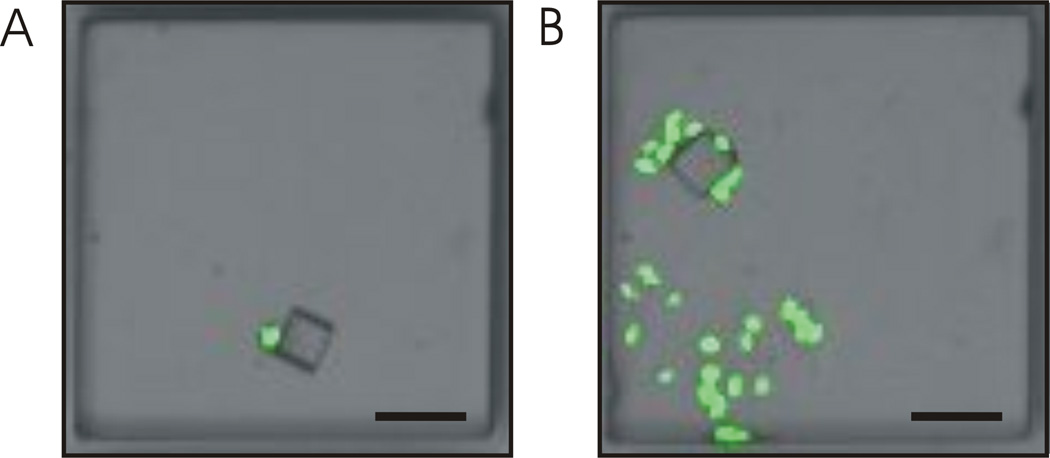
The viability of cells was determined by assessing the single cell’s ability to form a clonal colony after collection into a microwell. Three independent experiments were conducted in which 25 pallets (50 µm × 50 µm × 50 µm) possessing a GFP HeLa cell were released with the laser focused at their central left edge and collected. Microwells containing pallets with cells were imaged immediately after collection (Fig. 6A), then placed in culture for 72 h and re-imaged (Fig. 6B). In these experiments, 77% ± 7% of the collected cells were viable as determined by the expansion of collected single cells into colonies. These data are comparable to similar cell viability studies using the pallet technology.43, 49 The doubling time of the GFP-HeLa cells that were released, collected, and cultured in a microwell was 33 h. GFP-HeLa cells that were directly seeded and cultured in the PDMS microwells possessed a doubling time of 46 h. The slower doubling time of the GFP-HeLa cells that were not sorted was likely due to an initial delay time required for the cells to adhere to the multiwell plate (before they could begin to grow and divide). In contrast, cells attached to pallets and sorted into the multiwell plates immediately began to grow and divide since they were already adherent to a surface. An additional advantage of this sorting technique is that cells are handled while adherent to a surface enabling them to re-enter the cell cycle immediately post sorting.
Fig. 6.
Cell viability after release and collection. Overlaid bright field and fluorescence images of a pallet containing a GFP-expressing HeLa cell at 0 h (A) and at 72 h (B) after collection (scale bar is 100 µm).
4. Conclusions
An efficient system was designed and demonstrated for the selective release and collection of micron-scale elements from a planar array. A laser-based procedure was optimized to specifically target released pallets into desired microwells. The procedure enabled isolation of hundreds of pallets with high accuracy and efficiency. The system was successfully demonstrated for cell sorting with high yield, purity and viability. In addition, the technique will be amenable to cell sorting experiments using a variety of selection criteria, including but not limited to cell size, morphology, and fluorescence attributes. Further opportunities to improve this system could include the use of various materials for microwell fabrication. The use of materials other than PDMS for microwell fabrication could expand the number of cells types capable of being collected and cultured in the microwells, as PDMS may not be a suitable growth surface for all cell types. Additionally, the integration of motorized stage controls would improve collection accuracy and efficiency while reducing cross-talk by facilitating alignment and collection with finer stage control compared to the current manual controls.
Supplementary Material
Acknowledgements
This research was supported by the NIH (HG004843, EB012549).
REFERENCES
- 1.Davis JE, Eberwine JH, Hinkle DA, Marciano PG, Meaney DF, McIntosh TK. Neurochem. Res. 2004;29:1113–1121. doi: 10.1023/b:nere.0000023598.04937.83. [DOI] [PubMed] [Google Scholar]
- 2.Dovichi NJ, Hu S. Curr. Opin. Chem. Biol. 2003;7:603–608. doi: 10.1016/j.cbpa.2003.08.012. [DOI] [PubMed] [Google Scholar]
- 3.Lefievre L, Barratt CL, Harper CV, Conner SJ, Flesch FM, Deeks E, Moseley FL, Pixton KL, Brewis IA, Publicover SJ. Serono. Sym. 2003;7:419–427. doi: 10.1016/s1472-6483(10)61885-8. [DOI] [PubMed] [Google Scholar]
- 4.Li H, Sims CE, Kaluzova M, Stanbridge EJ, Allbritton NL. Biochemistry-U.S. 2004;43:1599–1608. doi: 10.1021/bi035597k. [DOI] [PubMed] [Google Scholar]
- 5.Negulescu PA, Shastri N, Cahalan MD. P Nat. Acad. Sci., U.S.A. 1994;91:2873–2877. doi: 10.1073/pnas.91.7.2873. [DOI] [PMC free article] [PubMed] [Google Scholar]
- 6.Schneggenburger R, Sakaba T, Neher E. Trends Neurosci. 2002;25:206–212. doi: 10.1016/s0166-2236(02)02139-2. [DOI] [PubMed] [Google Scholar]
- 7.Fend F, Raffeld M. J Clin. Pathol. 2000;53:666–672. doi: 10.1136/jcp.53.9.666. [DOI] [PMC free article] [PubMed] [Google Scholar]
- 8.Hack CJ. Brief. Funct. Genomic Proteomic. 2004;3:212–219. doi: 10.1093/bfgp/3.3.212. [DOI] [PubMed] [Google Scholar]
- 9.Kaern M, Elston TC, Blake WJ, Collins JJ. Nat. Rev. Genet. 2005;6:451–464. doi: 10.1038/nrg1615. [DOI] [PubMed] [Google Scholar]
- 10.Freshney RI. Culture of Animal Cells. Hoboken: Wiley-Liss; 2005. [Google Scholar]
- 11.Safarik I, Safarikova M. J Chromatogr. B. 1999;722:33–53. [PubMed] [Google Scholar]
- 12.Wysocki LJ, Sato VL. P Nat. Acad. Sci., U.S.A. 1978;75:2844–2848. doi: 10.1073/pnas.75.6.2844. [DOI] [PMC free article] [PubMed] [Google Scholar]
- 13.Shapiro HM. Practical Flow Cytometry. Hoboken: Wiley-Liss; 2003. [Google Scholar]
- 14.Calvert P. Science. 2007;318:208–209. doi: 10.1126/science.1144212. [DOI] [PubMed] [Google Scholar]
- 15.Demirci U, Montesano G. Lab Chip. 2007;7:1139–1145. doi: 10.1039/b704965j. [DOI] [PubMed] [Google Scholar]
- 16.Liberski AR, Delaney JTJ, Schubert US. ACS Comb. Sci. 2011;13:190–195. doi: 10.1021/co100061c. [DOI] [PubMed] [Google Scholar]
- 17.Cui X, Dean D, Ruggeri ZM, Boland T. Biotechnol. Bioeng. 2010;106:963–969. doi: 10.1002/bit.22762. [DOI] [PubMed] [Google Scholar]
- 18.Yusof A, Keegan H, Spillane CD, Sheils OM, Martin CM, O'Leary JJ, Zengerle R, Koltay P. Lab Chip. 2011;11:2447–2454. doi: 10.1039/c1lc20176j. [DOI] [PubMed] [Google Scholar]
- 19.Arnold CB, Serra P, Pique A. MRS Bulletin. 2007;32:23–31. [Google Scholar]
- 20.Vogel AH, Lorenz V, Linz K, Huettman N, Gebert A. Method. Cell Biol. 2007;82:153–205. doi: 10.1016/S0091-679X(06)82005-4. [DOI] [PubMed] [Google Scholar]
- 21.Bohandy J, Kim BF, Adrian FJ. J. Appl. Phys. 1986;60:1538–1539. [Google Scholar]
- 22.Hopp B, Smausz T, Kresz N, Barna N, Bor Z, Kolozsvari L, Chrisey DB, Szabo A, Nogradi A. Tissue Eng. 2005;11:1817–1823. doi: 10.1089/ten.2005.11.1817. [DOI] [PubMed] [Google Scholar]
- 23.Barron JA, Krizman DB, Ringeisen BR. Ann. Biomed. Eng. 2005;33:121–130. doi: 10.1007/s10439-005-8971-x. [DOI] [PubMed] [Google Scholar]
- 24.Sims CE, Bachman M, Li GP, Allbritton NL. Anal. Bioanal. Chem. 2006 doi: 10.1007/s00216-006-0612-1. [DOI] [PubMed] [Google Scholar]
- 25.Wittliff JL, Erlander MG. Method. Enzymol. 2002;356:12–25. doi: 10.1016/s0076-6879(02)56919-6. [DOI] [PubMed] [Google Scholar]
- 26.Schutze K, Niyaz Y, Stich M, Buchstaller A. Method. Cell Biol. 2007;82:649–673. doi: 10.1016/S0091-679X(06)82023-6. [DOI] [PubMed] [Google Scholar]
- 27.Mayer A, Stich M, Brocksch D, Schutze K, Lahr G. Method. Enzymol. 2002;356:25–33. doi: 10.1016/s0076-6879(02)56920-2. [DOI] [PubMed] [Google Scholar]
- 28.Toner M, Irimia D. Annu. Rev. of Biomed. Eng. 2005;7:77–103. doi: 10.1146/annurev.bioeng.7.011205.135108. [DOI] [PMC free article] [PubMed] [Google Scholar]
- 29.Sims CE, Allbritton NL. In: Biological Applications of Microfluidics. Gomez F, editor. New York: Wiley; 2008. pp. 29–64. ch. 3. [Google Scholar]
- 30.Lindstrom S, Andersson-Svahn H. Lab Chip. 2010;10:3363–3372. doi: 10.1039/c0lc00150c. [DOI] [PubMed] [Google Scholar]
- 31.Tan SJ, Li Q, Lim CT. Method Cell Biol. 2010;98:79–96. doi: 10.1016/S0091-679X(10)98004-7. [DOI] [PubMed] [Google Scholar]
- 32.Bang H, Chung C, Kim JK, Kim SH, Chung S, Park J, Lee WG, Yun H, Lee J, Cho K, Han D-C, Chang JK. Microsyst. Technol. 2006;12:746–753. [Google Scholar]
- 33.Yang S-Y, Hsiung S-K, Hung Y-C, Chang C-M, Liao T-L, Lee G-B. Meas. Sci. Technol. 2006;17:2001–2009. [Google Scholar]
- 34.Dittrich PS, Schwille P. Anal. Chem. 2003;75:5767–5774. doi: 10.1021/ac034568c. [DOI] [PubMed] [Google Scholar]
- 35.Fu AY, Spence C, Scherer A, Arnold FH, Quake SR. Nat. Biotechnol. 1999;17:1109–1111. doi: 10.1038/15095. [DOI] [PubMed] [Google Scholar]
- 36.Murthy SK, Sin A, Tompkins RG, Toner M. Langmuir. 2004;20:11649–11655. doi: 10.1021/la048047b. [DOI] [PubMed] [Google Scholar]
- 37.Didar TF, Tabrizian M. Lab Chip. 2010;10:3043–3053. doi: 10.1039/c0lc00130a. [DOI] [PubMed] [Google Scholar]
- 38.Zagnoni M, Cooper JM. Method. Cell Biol. 2011;102:25–48. doi: 10.1016/B978-0-12-374912-3.00002-X. [DOI] [PubMed] [Google Scholar]
- 39.Baret JC, Miller OJ, Taly V, Ryckelynck M, El-Harrak A, Frenz L, Rick C, Samuels ML, Hutchison JB, Agresti JJ, Link DR, Weitz DA, Griffiths AD. Lab Chip. 2009;9:1850–1858. doi: 10.1039/b902504a. [DOI] [PubMed] [Google Scholar]
- 40.Lee AP. Conf. Proc. IEEE Eng. Med. Biol. Soc. 2009. 2009:4147–4149. doi: 10.1109/IEMBS.2009.5332389. [DOI] [PubMed] [Google Scholar]
- 41.Kovac JR, Voldman J. Anal. Chem. 2007;79:9321–9330. doi: 10.1021/ac071366y. [DOI] [PMC free article] [PubMed] [Google Scholar]
- 42.Salazar GT, Wang Y, Young G, Bachman M, Sims CE, Li GP, Allbritton NL. Anal. Chem. 2007;79:682–687. doi: 10.1021/ac0615706. [DOI] [PubMed] [Google Scholar]
- 43.Wang Y, Young G, Bachman M, Sims CE, Li GP, Allbritton NL. Anal. Chem. 2007;79:2359–2366. doi: 10.1021/ac062180m. [DOI] [PubMed] [Google Scholar]
- 44.Quinto-Su PA, Salazar GT, Sims CE, Allbritton NL, Venugopalan V. Anal. Chem. 2008;80:4675–4679. doi: 10.1021/ac800129a. [DOI] [PMC free article] [PubMed] [Google Scholar]
- 45.Pai JH, Wang Y, Salazar GT, Sims CE, Bachman M, Li GP, Allbritton NL. Anal. Chem. 2007;79:8774–8780. doi: 10.1021/ac071528q. [DOI] [PMC free article] [PubMed] [Google Scholar]
- 46.Wang Y, Sims CE, Marc P, Bachman M, Li GP, Allbritton NL. Langmuir. 2006;22:8257–8262. doi: 10.1021/la061602k. [DOI] [PubMed] [Google Scholar]
- 47.Schneider CA, Rasband WS, Eliceiri KW. Nat. Methods. 2012;9:671–675. doi: 10.1038/nmeth.2089. [DOI] [PMC free article] [PubMed] [Google Scholar]
- 48.Ma H, Mismar W, Wang Y, Small DW, Ras M, Allbritton NL, Sims CE, Venugopalan V. J. R. Soc. Interface. 2012;9:1156–1167. doi: 10.1098/rsif.2011.0691. [DOI] [PMC free article] [PubMed] [Google Scholar]
- 49.Gach P, Sims CE, Allbritton NL. Biomaterials. 2010;31:8810–8817. doi: 10.1016/j.biomaterials.2010.07.087. [DOI] [PMC free article] [PubMed] [Google Scholar]
Associated Data
This section collects any data citations, data availability statements, or supplementary materials included in this article.


