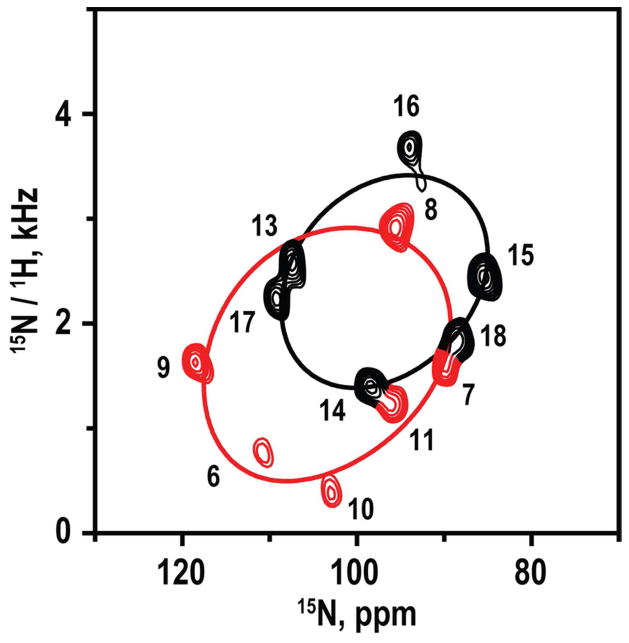
Figure 5.
SAMPI4 spectrum for 15N-labeled residues 6–11 and 13–18 GWALP23-P12 in magnetically oriented DM-o-PC/DH-o-PC bicelle bilayers. The spectrum was recorded from a single sample. Peaks were assigned by comparison with the spectrum for residue 13–17 (Figure 4) and are colored red for residues N-terminal to the proline. Helical (“PISA”) wheel patterns are superimposed to represent the orientations of the N-terminal and C-terminal segments (Table 4).

