

Abstract
Pleiotropy is the well-established phenomenon of a single gene affecting multiple traits. It has long played a central role in theoretical, experimental, and clinical research in genetics, development, molecular biology, evolution, and medicine. In recent years, genomic techniques have brought data to bear on fundamental questions about the nature and extent of pleiotropy. However, these efforts are plagued by conceptual difficulties derived from disparate meanings and interpretations of pleiotropy. Here, we describe distinct uses of the pleiotropy concept and explain the pitfalls associated with applying empirical data to them. We conclude that for any question about the nature or extent of pleiotropy, the appropriate answer is always, “What do you mean?”
Keywords: pleiotropy, universal pleiotropy, phenotype, fitness
Multiple traits, multiple meanings
Pleiotropy refers to the phenomenon of a single gene affecting multiple traits, and as that manifestly ambiguous definition reveals, pleiotropy is a single word with multiple meanings. As biologists in different disciplines turn new genomic techniques toward questions of pleiotropy, the need to carefully discriminate between different meanings of the concept has become imperative.
Here we first review the alternative meanings of pleiotropy and point to situations where they define unrelated phenomena. Then we discuss the nature and quality of empirical data brought to bear on questions about pleiotropy in its many guises. Finally we focus on how better to frame pleiotropy research, underscoring the continuing importance of this slippery concept.
What is pleiotropy?
At its essence, pleiotropy implies a mapping from one thing at the genetic level to multiple things at a phenotypic level. The natures of the things differ in different contexts. We identify three broad classes of question that employ the word pleiotropy to refer to very different kinds of one-to-many maps. The classifications are not mutually exclusive—indeed, they typically overlap—but they do represent different and potentially contradictory perspectives.
In Molecular-Gene Pleiotropy, the question is about the number of functions a molecular gene has. These functions can be defined genetically, by the number of measured traits affected by a knockout, but also biochemically, for example, by the number of protein-protein interactors a gene has or the number of reactions it catalyzes.
In Developmental Pleiotropy, mutations –not molecular genes –are the relevant units. Developmental pleiotropy is a feature of the genotype-phenotype map that defines the genetic and evolutionary autonomy of aspects of phenotype, independent of fitness. This is the mutational pleiotropy underlying the diverse manifestations of syndromic diseases, the ontogenetic pleiotropy that underlies classical questions about allometry and heterochrony, and molecular pleiotropy that underlies questions about relative importance of cis-regulatory vs. protein-coding variants.
In Selectional Pleiotropy, the question is about the number of separate components of fitness a mutation affects. In some cases, the multiple fitness components are life-history traits of a single individual, which is at the heart of the antagonistic pleiotropy model for the evolution of aging [1]. In other cases, the mutational effects are manifest in different individuals in a population, which is the basis for sexually antagonistic pleiotropy and pleiotropic trade-offs underlying local adaptation. A key feature of selectional pleiotropy is that traits are defined by the action of selection and not by the intrinsic attributes of the organism.
Recent years have seen a surge of genome-scale analyses of empirical data designed to address questions about the scope of pleiotropy, and particularly to test hypotheses of universal pleiotropy (Boxes 1–3). However, given the incongruence between molecular-gene, developmental, and selectional pleiotropy, data that reflect on pleiotropy in one setting may be uninformative or positively misleading in another. When considering the relevance of data to each of these classes of pleiotropy, four issues are critical.
Box 1. What, if anything, is universal pleiotropy?
The Hypothesis of Universal Pleiotropy has several different meanings. Neither Fisher [55] nor Wright [13], who are typically cited as its advocates (see Box 2), actually endorsed the most literal interpretation, i.e., that every mutation affects every trait (SHUP, the Strong Hypothesis of Universal Pleiotropy). The SHUP draws credence from consideration of the unified network architecture of the cell — all molecular genes compete for a common pool of polymerase, ribosomes, and dNTPs, among other things. Mutations that alter gene activity — or even just sequence — impinge on this central nexus and so alter activities of all other genes. This principle finds its clearest endorsement in the writing of Kacser and Burns in the paper [56] that defines much of modern systems biology:
“We have already remarked that very low coefficients will often be attached to enzymes kinetically “distant” from the particular flux considered. This is the reason for the well known observation that mutations in a different part of the map may have no detectable effect on one character even when another character is seriously affected. This apparent independence of most characters makes simple Mendelian genetics possible, but conceals the fact that there is universal pleiotropy. All characters should be viewed as “quantitative” since, in principle, variation anywhere in the genome affects every character.”
Kacser and Burns 1981 (p. 649)
The SHUP resembles models of diffuse coevolution or competition, wherein phenomena arise because everything affects everything, but not very much and not to the exclusion of a smaller number of much larger and more individually significant relationships.
Critiques of the SHUP point out that trivial effects mediated by shared metabolite pools are biologically meaningless, and detectable pleiotropy is empirically restricted and perhaps highly structured, as proposed under the Hypothesis of Modular Pleiotropy [57]. Under the HMP, mutations are generally constrained to affect traits that are part of the same functional complex, and this hypothesis has been invoked to explain modular relationships observed between sets of genes and sets of traits [15]. As Kacser and Burns’ description of universal pleiotropy makes clear, however, SHUP is a logical deduction consistent with the absence of detectable effects. It can be both true and inconsequential. The SHUP may be paraphrased, “there is a single gene network”.
Box 2. Wright, Fisher, and the Weak Hypothesis of Universal Pleiotropy (WHUP).
Sewall Wright, who approached pleiotropy from the dual perspectives of population genetics and physiological genetics, drew on network architecture to advocate what we might call the WHUP. The text of the locus classicus [13] is worth quoting:
“There are a number of broad generalizations that follow from this netlike relationship between genome and complex characters. These are all fairly obvious but it may be well to state them explicitly.
The variations of most characters are affected by a great many loci (the multiple factor hypothesis).
In general, each gene replacement has effects on many characters (the principle of universal pleiotropy).”
Wright 1968 (p. 59–60).
In his other writings, Wright was careful to qualify universal pleiotropy, as in [58], which refers variously to “practically,” “nearly,” and “almost universal pleiotropy”. Consequently, Wright should be cited as an advocate for the importance and ubiquity of pleiotropy but not in any literal sense for its universality.
The other common source for claims of universal pleiotropy is R. A. Fisher’s geometric model of adaptation [55], although this toy phenotype-fitness model makes no strong claim about the empirical structure of the genotype-phenotype map; it is simply a model to motivate analysis. As usually explicated, the model holds that mutations are random vectors in a phenotype space, which means that they may affect multiple phenotypes without excluding the possibility that they affect only subsets; indeed, Fisher’s WHUP is sometimes described as the notion that a mutation “can potentially affect all phenotypic traits” (e.g., [59, 60]). Most importantly, the axes of Fisher’s model are orthogonal traits under selection, with distances defined in fitness units, not simple morphological or life-history traits. Connecting Fisher’s model to developmental pleiotropy depends on mapping the axes of selection onto measurable phenotypes, which is not trivial. Most such efforts have suggested that there are just a handful of selectable axes defined by linear combinations of measureable traits [42, 49, 61, 62]. This is why efforts to estimate the dimensionality of organisms (i.e., the number of axes in Fisher’s model) yield unintuitive results, on the order of 2 for worms and flies and cows [47, 63]. In other words, there is no intrinsic relationship between the axes of Fisher’s model and the genotype-phenotype map for measurable characters. Fisher’s WHUP is thus the notion that mutations usually affect multiple aspects of fitness, without any claims about the number of affected developmental phenotypes.
Box 3. How can we test the hypothesis of universal pleiotropy?
Given its slipperiness, universal pleiotropy poses problems for the conventional hypothesis testing framework. Advocates of the HMP (Box 1) [64] argue that universal pleiotropy is untestable, and that a hypothesis of “no gene effect” is the appropriate experimental null model. That the physiological SHUP of Kacser and Burns (Box 1) is untestable is clear from its description; it is an ontological assertion and not a model at all. But a WHUP (Box 2) tailored to measureable traits (i.e., for questions about developmental pleiotropy), with each mutation potentially affecting each trait according to a distribution of effect sizes (including zero), can provide quantitative predictions against which alternative models, such as the HMP, can be tested. Differences between the models in predictions about the multivariate distribution of effect sizes across traits may provide a statistical toehold [65]. In this framework, as the HMP can be treated as a submodel of the WHUP, likelihood ratio tests hold promise, as do Bayesian frameworks [66].
At the same time, alternative models of pleiotropy make predictions beyond effect detection patterns. Given the acknowledged deficiencies of QTL mapping, particularly its low power, quantitative genetic approaches that are not limited to large-effect loci might be more informative about the global structure of pleiotropy. These include the artificial selection methods described elsewhere in the paper [42, 46]. Particularly in the evolutionary context that Fisher and Wright were working in, these selection-based tests for the extent of pleiotropy are better tests of the WHUP than underpowered QTL studies of arbitrary morphological traits.
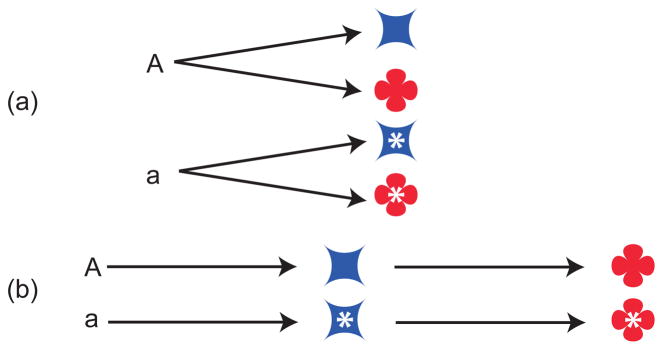
First, are we discussing the genotype-phenotype map, or the genotype-fitness map? Instances of selectional pleiotropy can involve mutations that have only one molecular function or phenotypic effect but impact multiple aspects of fitness. For example, a mutation that changes the rate of organism metabolism may affect early and late life reproduction differently despite the unitary molecular mechanism, and a mutation that changes expression of a transporter on a yeast cell may be beneficial in one environment and deleterious in another, despite the total absence of any multiplicity in the genotype-phenotype map (Figure 1). A mutation with identical molecular and developmental effects in males and females is a typical cause of sexually antagonistic pleiotropy, yet it is the antithesis of molecular-gene pleiotropy.
Figure 1.

Different meanings of pleiotropy denote unrelated biological phenomena. Here, considering a single locus with alternate alleles (A and a) in a haploid organism, we represent genotype:gene function:phenotype:fitness mappings for alternate alleles that illustrate a few of the possible relationships. (a) Pleiotropy by all accounts. A loss-of-function mutation in a multifunctional protein abolishes two molecular activities that affect two different morphological phenotypes that in turn affect two independent aspects of fitness. (b) Molecular-gene pleiotropy occurs when a gene product carries out multiple independent biochemical functions. A gene deletion may abolish both functions, but if they are both redundant there may be no measureable phenotype (in this genetic background). (c) Genes vs. mutations: A mutation in a multifunctional gene may affect only one function, in which case this instance of molecular-gene pleiotropy does not correspond to any developmental or selectional pleiotropy. (d) Developmental pleiotropy occurs when a mutation affects two aspects of phenotype. This phenomenon does not require any multifunctionality at the level of the molecular gene nor any particular pattern of impact on fitness. (e) A mutation that affects only a single phenotype may nevertheless yield selectional pleiotropy if the phenotype has varied effects on fitness in different circumstances –different environments or sexes, for example. (f) Perhaps the least intuitive case is a mutation that affects only a single phenotype and has identical effects on orthogonal fitness components. Because these fitness components are independent traits in the selectional context, a mutation with uniform effects on more than one is necessarily pleiotropic.
Second, are we discussing a molecular gene or a mutation? Failure to distinguish between effects of a mutation and functions of a gene is at the heart of much confusion [2]. From an evolutionary perspective, the molecular gene is inconsequential. Mutations may affect only specific aspects of a gene’s function, so that pleiotropic molecular genes may be subject to less-pleiotropic mutations [2]. At the other end of the spectrum, mutations that alter multiple molecular genes, whether by deleting large regions, hitting shared regulatory regions, or altering operon structure, are authentic sources of developmental and selectional pleiotropy. Even mutations that don’t directly alter any molecular genes can be pleiotropic, by titrating limiting regulators; such mutations could be changes in DNA copy number of protein-binding motifs, for example, or structural changes that alter chromatin architecture. Thus molecular-gene pleiotropy may be uninformative about developmental and selectional pleiotropy, and vice versa.
Third, how are we enumerating traits? Mutations can have “the same” or “different” effects at the level of individual cells, tissues, organs, individuals, or populations. Is a mutation pleiotropic if it acts in a tissue that occurs in multiple parts of the body, but does so in the same molecular way in each part? Answers to this kind of question form the basis for elaborate taxonomies of molecular-gene pleiotropy [3–5]. Things get further complicated when we consider traits that cannot be enumerated, such as function-valued traits, particularly ontogenetic trajectories or traits defined as relationships between measureable traits. Is a mutation more pleiotropic if it affects two traits uniformly, preserving the proportions between them, or if it affects one trait only, altering their relative sizes? In other realms of evolutionary biology, “multiple traits” has yet another dimension, as we consider the effects of a mutation in different individuals or populations, including different sexes, environments, and genetic backgrounds. These phenomena are commonly treated as pleiotropy, but they are also instances of genotype-by-sex, –environment, or -genotype interactions, which are the subject of an independent theoretical tradition (Figure 1e). Moreover, pleiotropic effects within individuals have different evolutionary implications than pleiotropic effects among individuals (e.g., [6]).
Finally, what do we mean when we say that a gene or mutation “affects” multiple traits? Here, discussion has centered on the molecular basis for pleiotropy and its biological implications. Many authors [3–5, 7–11] have distinguished between multiple independent effects of a mutation and multiple effects that depend on one another in a cascade (Figure 2). In the functional view of molecular-gene pleiotropy, only the former is meaningful while the latter has been termed “spurious” [3]. Other authors have named these distinctions “horizontal” and “vertical pleiotropy” [9], or “mosaic” and “relational” [4]; see [10]. In the context of statistical inference, these modes are “independent” and “reactive” [12]. Wright [13] noted that “from the standpoint of population genetics, these distinctions are, however, unimportant. There is pleiotropy if two effects contribute differently to selective value” (p. 61). Yet, the distinction between authentic/horizontal/mosaic/independent pleiotropy on the one hand and spurious/vertical/relational/reactive pleiotropy on the other hand may hold evolutionary relevance, insofar as the latter scenario produces phenotypic correlations between traits even in the absence of genetic variation (e.g., [14]).
Figure 2.
Two ways mutations can affect multiple traits. (a) An allelic difference (A/a) independently affects the blue trait and the red trait. (b) An allelic difference affects the blue trait, which in turn influences the red trait. The former case may be more susceptible to genetic modifiers of pleiotropy. In the latter case, independent environmental and genetic perturbations that affect the blue trait also affect the red trait.
The data: How much pleiotropy is there and how do we know?
In the past few years, it has become possible to generate empirical datasets that can, in principle, estimate genome-wide levels of pleiotropy. The major sources of data are reverse-genetic screens and QTL mapping studies, and the results have been synthesized recently with the interpretation that “in all cases the pleiotropy distribution is largely L-shaped, with a low median degree of pleiotropy” [11] (Figure 3). Even as these findings are surprisingly consistent [10], their interpretation is contentious (Box 3). Major concerns include statistical power (how do we declare that a gene has no effect on a trait?), trait delineation (what counts as a separate trait?), mutation spectrum (are we considering spontaneous mutations, gene deletions, or segregating variation?), and model structure (what should we expect to see under different hypotheses?).
Figure 3.

Distributions of pleiotropy for single-gene deletions. Previous estimates of pleiotropy have suggested that most genes have few effects, and the distribution of effects per gene is L-shaped. The data responsible for those estimates [15] are replotted here in blue: most deletions affect few traits, and a few deletions affect many. Data excluded from those estimates, plotted in red, shows that the distribution of genic pleiotropy is actually U-shaped, with a second mode at maximal pleiotropy. (a) Yeast deletions affect a fraction of the 253 measured morphological traits, if one excludes those deletions that affect all 253 traits (lethals, red bar at “all”). Deletions with no detectable effects constitute an even larger fraction of genes (red bar at “none”). (b) Yeast deletions affect growth rate in only a small fraction of environments, excluding lethals, which affect growth rate in all 21 studied environments (“all”). In this dataset, the large category of genes with no detectable effect (“none”) actually includes genes that uniformly decrease growth rate in all environments; only deletions exhibiting gene-by-environment interactions were counted as pleiotropic. (c) A live-imaging study of C. elegans embryos in which 661 essential genes had been knocked down by RNAi found that each knockdown resulted in only a subset of 44 possible embryonic phenotypes. (d) If any number of adult traits or life-history traits are included in the analysis of the 661 genes plotted in panel c, each gene is maximally pleiotropic –all traits are affected as –every gene result in embryonic lethality.
Reverse Genetics
Genome-wide reverse-genetic screens, in which phenotypes are measured in single-gene null mutants one-by-one, form the major class of experimental result. In an influential systematic analysis of published large-scale datasets from yeast and worms (and one less systematic dataset from mice), a recent study [15] concluded that relatively low proportions of genes, when disrupted, affected multiple phenotypes, and even then, the number of affected traits was small. We briefly consider each of the datasets.
The most comprehensive surveys were performed in yeast, in which a deletion library was used to measure both morphological traits (developmental pleiotropy) and growth rate phenotypes (selectional pleiotropy). Of 4,718 gene deletion mutants tested for 254 morphological characters, more than a third had statistically significant effects on two or more traits, which the original authors interpreted as widespread pleiotropy [16]. When assayed for growth rates across 21 different environments, however, most mutants showed phenotypes in zero or one environment, and only 5% produced phenotypes in three or more environments [17]. Notably, only differences in growth rate between normal and experimental conditions counted as phenotypes, such that a mutant growing slowly on all environments except the control was highly pleiotropic, but a universally slow-growing mutant had zero pleiotropy. This method is literally scoring gene-by-environment interactions for growth rate. These interactions underlie antagonistic pleiotropy, but synergistic pleiotropy — as in the case of a mutation that is deleterious in every environment — does not register. And it is worth re-emphasizing that pleiotropy measured across environments can result from mutations that affect just a single mechanism or phenotype at the molecular or developmental levels (Figure 1f).
It is also important to note that these screens excluded lethal mutations, of which there are 1,105 in the yeast deletion collection [18]. If molecular genes are the unit of analysis, logic requires including essential genes, and under any definition of developmental or selectional pleiotropy, these are maximally pleiotropic –any two traits will both differ between wild-type and mutant. Inclusion of this large class of genes substantially alters the distribution of pleiotropy from L-shaped to U-shaped (Figure 3). It might be argued that lethal alleles are irrelevant to developmental or selectional pleiotropy, but the contribution of small-effect mutations in essential genes to evolution and development is simply unknown; the relevant data do not exist. At the same time, some of the best-known mutations underlying evolution of development are mutations in essential genes that only affect subsets of the gene’s activities; in sticklebacks, pitx-1 and kitl are essential genes that underlie evolution of pelvic reduction and pigmentation [19, 20], and in Drosophila, mutations in ultrabithorax underlie the evolution of trichome patterns [21].
Also excluded from these pleiotropy estimates were “genes that do not affect any trait and traits that are not affected by any gene” [15]. From the molecular-gene pleiotropy perspective, genes that have no detectable effect on any measured phenotype are an interesting class with undefined pleiotropy. From the developmental and selectional pleiotropy perspectives, these simply do not register as mutations. At the same time, their abundance (Figure 3) raises questions about the power of the experimental data to detect effects; to a first approximation, every gene should affect fitness, or it would become a pseudogene [22].
Pleiotropy estimates from the nematode dataset are no less ambiguous. The original RNAi screen identified hundreds of genes that induced at least one of 45 phenotypic defects in the first four embryonic cell divisions [23]. In the systematic analysis of pleiotropy [15], the average gene was associated with 4.6 defects, which was described as consistent with low pleiotropy (Figure 3c). However, another group examined the same data and found that the average gene induced seven defects, and concluded that pleiotropy “occurs extensively among genes” [24]. Clearly there is room for interpretation not only in what is “low” or “high”, but in how to do the counting. Procedures that require counting significant effects from vast datasets pose serious statistical concerns, and a recent critique of the systematic analysis shows that its statistical assumptions preclude any possibility of finding evidence for high pleiotropy, as patterns of restricted pleiotropy are inferred from data simulated with pervasive pleiotropy [25]. Finally, as the genes in this case are embryonic lethal, from a developmental or selectional pleiotropy perspective, these data are consistent with the most extreme form of universal pleiotropy (Figure 3d).
A final caveat about reverse-genetics approaches is whether molecular-gene null mutations permit meaningful estimates of developmental and selectional pleiotropy, which draw from the spectrum of spontaneous mutations. Whole-gene deletions are expected to be much more pleiotropic than most point mutations [2], upwardly biasing estimates of pleiotropy [11]. In some cases, however, natural mutations will be more pleiotropic, as when deletions affect multiple genes or large-scale chromatin structure. In other cases, null mutations will be caused by transposon insertions that may have their own phenotypic effects beyond abrogating gene function [26]. Finally, a significant fraction of natural mutations are gain-of-function, and these are often dominant or semi-dominant and hence immediately visible to selection. Positively selected gain-of-function mutations include those responsible for solitary foraging in C. elegans [27] and for lactase persistence in humans [28]. The former exhibits extensive developmental pleiotropy (e.g., [29]), and the latter arguably as well (e.g., on the viability of pastoralism). Mutations responsible for protein-aggregation diseases (e.g., Huntington’s) are also pleiotropic gain-of-function mutations that belie the simple assumption that null mutations are maximally pleiotropic.
QTL approaches
QTL are another category of empirical data that have been used to estimate genome-wide pleiotropy. These data fit squarely in the context of developmental pleiotropy, and they represent loci that harbor phenotypically penetrant alleles segregating in populations, which may be quite different in their effects from deletion alleles or spontaneous mutations. A QTL detected for multiple traits is said to be pleiotropic. A recent summary of QTL pleiotropy data concluded that most loci affect only a few traits, in a pattern similar to that observed in reverse genetic screens [11].
Probably the most comprehensive QTL survey for pleiotropy involved mapping 70 skeletal traits in recombinant inbred mice, which identified a total of 102 QTL and for which the maximum number of traits affected was 30 and the average 7.8 [30]. Similar work on 54 body shape traits in sticklebacks [31] identified 26 QTL, approximately half of which only influenced one trait, and the average number of traits affected was 3.5.
Gene expression QTLs (eQTLs) have also been used to infer levels of genome-wide pleiotropy. Most eQTL appear to affect a small number of gene expression traits, but typically a handful of eQTL hotspots affect abundances of hundreds to thousands of transcripts. Such patterns have been observed in yeast [32], mice [33], humans [34], nematode worms [35], and Arabidopsis [36].
Despite the abundance of QTL data, their utility for questions about the global pattern of pleiotropy is doubtful. The gravest problem is power; in almost every study, the majority of heritable variation is unexplained. The eQTL data in particular imply that an enormous number of gene-phenotype links are simply undetected because of inadequate statistical power [37]. In this line-cross experimental setting, the only explanation is a large number of variants with pleiotropic but very modest effects. Genome-wide association studies exhibit similar patterns and probably yield to the same explanation [38]. Adoption of arbitrary thresholds for significance is a viable method for evaluating pleiotropy only if we are prepared to stipulate that effects beneath our detection limits are inconsequential, but ample evidence suggests that most causal genetic variation may be beneath practical detection limits [39]. The power issue certainly dwarfs any bias from interpreting linked loci as single pleiotropic loci, which has been invoked as a source of upward bias in pleiotropy estimates [11]. Further, some genetic architectures will cause this bias to be downward, for example, if highly pleiotropic alleles tend to accumulate linked suppressors of their pleiotropic effects. In most developmental and selectional pleiotropy contexts, the distinction between linkage and pleiotropy is not fundamental (Box 4). Finally, effect size has important implications for evolution. Genetic architectures with many highly pleiotropic small-effect loci may be unconstrained because the pleiotropic effects cancel out, whereas those with small numbers of large-effect pleiotropic loci typically induce strong genetic correlations (e.g., [40]).
Box 4. Does the distinction between pleiotropy and close linkage matter?
Substantial effort in the QTL field is devoted to distinguishing between pleiotropy and tight linkage as the cause of QTL colocalization (e.g., [67–71]). In agricultural contexts, the goal is to determine if genetic correlations between traits of agronomic interest are breakable, as expected in the case of linkage, or are inherent, as expected in the case of pleiotropy. However, both sources of correlation are subject to modification, the former by recombination and the latter by segregating modifiers [60, 72] or mutation, including the well-studied case of duplication and subfunctionalization [73, 74]. If the distinction between linkage and pleiotropy matters evolutionarily, it will be because these occur at different rates. But do they? Modifiers of pleiotropy are not rare [7, 13, 72, 75]. By contrast, linkage can be so tight as to be immune to recombination, as in some chromosomal rearrangement, organellar genomes, or Y-chromosomes. In those cases, genetic correlations caused by linked loci may be more likely to be altered by epistatic modifiers than by recombination. Ultimately, the evolutionary features that matter are the relative rates of recombination and modifier mutation (or the segregating frequencies of modifiers), which will depend on the details of the trait and the genetic distance separating the loci. That is, the evolutionary implications of linkage versus pleiotropy vary case by case.
The deletion and QTL datasets measure fundamentally unrelated phenomena, in neither case with any great efficacy. How, then, can they all produce similar L-shaped distributions (excluding lethals)? One possibility is that these data are revealing a fundamental unity of pleiotropy. An alternative is that these L-shaped patterns are artifacts of limited statistical power, a result well-established for QTL data [41] and now for reverse genetics [25].
How else can we estimate pleiotropy?
Classical quantitative genetic methods provide evidence of extensive pleiotropy without relying on detection of single locus effects. One striking observation is that the rate of accumulation of phenotypic variance by mutation for a single arbitrary metric trait implies a mutation rate per trait of about one-tenth the total genomic mutation rate [42, 43]. Consequently, there cannot be a very large number of mutationally independent traits. This inference lends credence to the commonplace observation that there are a finite number of molecular genes and an effectively infinite number of traits. Statistical genetic analyses supporting extensive polygeny — thousands of loci affecting individual traits [38, 44] — reinforce the notion that the mutational independence of traits must be quite limited.
Predictions about pleiotropy can also be tested by artificial selection. These methods are predicated on the simple assumption that a locus controlling some trait under selection will have other pleiotropic effects that reduce fitness [45]. The expected response to selection is simple to predict from the heritability of the focal trait, so the degree to which the response falls short is a measure of the extent of pleiotropy [46, 47]. This principle has been demonstrated in Drosophila [48]. In some cases, pleiotropy will simply prevent any response to selection [49, 50].
Evolutionary predictions can also facilitate improved single-locus estimates of pleiotropy. If pleiotropy tethers positive and negative fitness effects together across multiple traits, then one method for screening for pleiotropic loci would be to look for gene disruptions that increase some measure of fitness. Assuming gene disruption is an easy genetic change to acquire, and that natural selection would fix a disrupted allele if it had strictly beneficial effects, then the persistence of the wild-type allele must indicate the existence of some trade-off between traits. This has essentially been done exhaustively for lifespan, in which systems like flies and worms have been screened for mutations that increase longevity. The result is that under careful examination, longevity alleles routinely show pleiotropy, most commonly with reproductive and stress tolerance phenotypes (e.g. [51], but see [52]).
The road forward
Given its diverse meanings, pleiotropy cannot be treated as a unitary concept with a definable prevalence. It must instead be treated as a suite of conceptually related but empirically independent phenomena, whose extent and consequences depend on the precise definition. The extent of molecular-gene pleiotropy –how many reactions does a protein catalyze, for example –is not informative about the evolutionary independence of morphological traits or of life-history components. To be useful, pleiotropy must be precisely defined. We point to two examples of empirically successful hypotheses that invoke precise definitions of pleiotropy.
First, the hypothesis that cis-regulatory variants contribute more to the evolution of animal morphology than protein-coding variants invokes the greater pleiotropy of the latter as a constraint [2, 53]. Because cis-regulatory mutations often affect only a subset of a gene’s expression domains, they are less pleiotropic than protein-coding mutations, which affect the protein everywhere it is expressed. The hypothesis is focused specifically on quantifying developmental pleiotropy by assessing the number (or fraction) of different gene expression domains affected by a mutation.
A second example draws on the theory of antagonistic pleiotropy for life-history traits. This theory describes how senescence can result from evolutionary pressure on selectionally pleiotropic alleles. If an allele increases fitness early in life by improving reproductive success, but decreases fitness later by promoting senescence, then natural selection will favor it and result in an organism with a prescribed lifespan [1]. This hypothesis yields a vast array of testable predictions, and a major focus in biology of aging research now includes mapping the effects of mutations onto physiology and life history [54].
The concept of pleiotropy has generated hypotheses that touch upon every aspect of the relationship between genes and phenotypes. Testing these can address important outstanding questions –the road ahead is long and wide, and we are only becoming more equipped to travel it. However, even well-defined hypotheses about the nature and extent of pleiotropy are challenged by empirical limitations. The most informative work will test alternatives while avoiding the limits imposed by experimental power.
Acknowledgments
We gratefully acknowledge the support of the National Institutes of Health (R01GM089972 and 5F32GM090557), the Ellison Medical Foundation (AG-NS-0615), the Human Frontier Science Program (RPG0045/2010), and the Charles H. Revson Foundation.
Footnotes
Publisher's Disclaimer: This is a PDF file of an unedited manuscript that has been accepted for publication. As a service to our customers we are providing this early version of the manuscript. The manuscript will undergo copyediting, typesetting, and review of the resulting proof before it is published in its final citable form. Please note that during the production process errors may be discovered which could affect the content, and all legal disclaimers that apply to the journal pertain.
References
- 1.Williams GC. Pleiotropy, natural selection, and the evolution of senescence. Evolution. 1957;11:398–411. [Google Scholar]
- 2.Stern DL. Evolutionary developmental biology and the problem of variation. Evolution. 2000;54:1079–1091. doi: 10.1111/j.0014-3820.2000.tb00544.x. [DOI] [PubMed] [Google Scholar]
- 3.Gruneberg H. An analysis of the “pleiotropic” effects of a new lethal mutation in the rat (Mus norvegicus) Proc R Soc Lond B. 1938;125:123–144. [Google Scholar]
- 4.Hadorn E. Developmental Genetics and Lethal Factors. London: Methuen and Company; 1961. [Google Scholar]
- 5.Hodgkin J. Seven types of pleiotropy. Int J Dev Biol. 1998;42:501–505. [PubMed] [Google Scholar]
- 6.Turelli M, Barton NH. Polygenic variation maintained by balancing selection: Pleiotropy, sex-dependent allelic effects and GxE interactions. Genetics. 2004;166:1053–1079. doi: 10.1093/genetics/166.2.1053. [DOI] [PMC free article] [PubMed] [Google Scholar]
- 7.Pyeritz RE. Pleiotropy Revisited - Molecular Explanations of a Classic Concept. American Journal of Medical Genetics. 1989;34:124–134. doi: 10.1002/ajmg.1320340120. [DOI] [PubMed] [Google Scholar]
- 8.Emerson KJ, et al. Complications of complexity: integrating environmental, genetic and hormonal control of insect diapause. Trends Genet. 2009;25:217–225. doi: 10.1016/j.tig.2009.03.009. [DOI] [PubMed] [Google Scholar]
- 9.Tyler AL, et al. Shadows of complexity: what biological networks reveal about epistasis and pleiotropy. Bioessays. 2009;31:220–227. doi: 10.1002/bies.200800022. [DOI] [PMC free article] [PubMed] [Google Scholar]
- 10.Stearns FW. One hundred years of pleiotropy: a retrospective. Genetics. 2010;186:767–773. doi: 10.1534/genetics.110.122549. [DOI] [PMC free article] [PubMed] [Google Scholar]
- 11.Wagner GP, Zhang J. The pleiotropic structure of the genotype-phenotype map: the evolvability of complex organisms. Nat Rev Genet. 2011;12:204–213. doi: 10.1038/nrg2949. [DOI] [PubMed] [Google Scholar]
- 12.Schadt EE, et al. An integrative genomics approach to infer causal associations between gene expression and disease. Nat Genet. 2005;37:710–717. doi: 10.1038/ng1589. [DOI] [PMC free article] [PubMed] [Google Scholar]
- 13.Wright S. Genetics and biometric foundations. Vol. 1. Chicago: University of Chicago Press; 1968. Evolution and the genetics of populations. [Google Scholar]
- 14.Gove RP, et al. Effects of causal networks on the structure and stability of resource allocation trait correlations. Journal of Theoretical Biology. 2012;293:1–14. doi: 10.1016/j.jtbi.2011.09.034. [DOI] [PubMed] [Google Scholar]
- 15.Wang Z, et al. Genomic patterns of pleiotropy and the evolution of complexity. Proc Natl Acad Sci U S A. 2010;107:18034–18039. doi: 10.1073/pnas.1004666107. [DOI] [PMC free article] [PubMed] [Google Scholar]
- 16.Ohya Y, et al. High-dimensional and large-scale phenotyping of yeast mutants. Proc Natl Acad Sci U S A. 2005;102:19015–19020. doi: 10.1073/pnas.0509436102. [DOI] [PMC free article] [PubMed] [Google Scholar]
- 17.Dudley AM, et al. A global view of pleiotropy and phenotypically derived gene function in yeast. Molecular Systems Biology. 2005:1. doi: 10.1038/msb4100004. [DOI] [PMC free article] [PubMed] [Google Scholar]
- 18.Giaever G, et al. Functional profiling of the Saccharomyces cerevisiae genome. Nature. 2002;418:387–391. doi: 10.1038/nature00935. [DOI] [PubMed] [Google Scholar]
- 19.Shapiro MD, et al. Genetic and developmental basis of evolutionary pelvic reduction in threespine sticklebacks. Nature. 2004;428:717–723. doi: 10.1038/nature02415. [DOI] [PubMed] [Google Scholar]
- 20.Miller CT, et al. cis-regulatory changes in kit ligand expression and parallel evolution of pigmentation in sticklebacks and humans. Cell. 2007;131:1179–1189. doi: 10.1016/j.cell.2007.10.055. [DOI] [PMC free article] [PubMed] [Google Scholar]
- 21.Stern DL. A role of Ultrabithorax in morphological differences between Drosophila species. Nature. 1998;396:463–466. doi: 10.1038/24863. [DOI] [PMC free article] [PubMed] [Google Scholar]
- 22.Weiss KM. Tilting at quixotic trait loci (QTL): an evolutionary perspective on genetic causation. Genetics. 2008;179:1741–1756. doi: 10.1534/genetics.108.094128. [DOI] [PMC free article] [PubMed] [Google Scholar]
- 23.Sonnichsen B, et al. Full-genome RNAi profiling of early embryogenesis in Caenorhabditis elegans. Nature. 2005;434:462–469. doi: 10.1038/nature03353. [DOI] [PubMed] [Google Scholar]
- 24.Zou L, et al. Systematic analysis of pleiotropy in C. elegans early embryogenesis. PLoS Comput Biol. 2008;4:e1000003. doi: 10.1371/journal.pcbi.1000003. [DOI] [PMC free article] [PubMed] [Google Scholar]
- 25.Hill WG, Zhang XS. On the pleiotropic structure of the genotype-phenotype map and the evolvability of complex organisms. Genetics. 2012;190:1131–1137. doi: 10.1534/genetics.111.135681. [DOI] [PMC free article] [PubMed] [Google Scholar]
- 26.Dennis S, et al. C. elegans germ cells show temperature and age-dependent expression of Cer1, a Gypsy/Ty3-related retrotransposon. PLoS Pathog. 2012;8:e1002591. doi: 10.1371/journal.ppat.1002591. [DOI] [PMC free article] [PubMed] [Google Scholar]
- 27.McGrath PT, et al. Quantitative mapping of a digenic behavioral trait implicates globin variation in C. elegans sensory behaviors. Neuron. 2009;61:692–699. doi: 10.1016/j.neuron.2009.02.012. [DOI] [PMC free article] [PubMed] [Google Scholar]
- 28.Tishkoff SA, et al. Convergent adaptation of human lactase persistence in Africa and Europe. Nature Genetics. 2007;39:31–40. doi: 10.1038/ng1946. [DOI] [PMC free article] [PubMed] [Google Scholar]
- 29.Reddy KC, et al. A Polymorphism in npr-1 Is a Behavioral Determinant of Pathogen Susceptibility in C-elegans. Science. 2009;323:382–384. doi: 10.1126/science.1166527. [DOI] [PMC free article] [PubMed] [Google Scholar]
- 30.Wagner GP, et al. Pleiotropic scaling of gene effects and the 'cost of complexity'. Nature. 2008;452:470–U479. doi: 10.1038/nature06756. [DOI] [PubMed] [Google Scholar]
- 31.Albert AY, et al. The genetics of adaptive shape shift in stickleback: pleiotropy and effect size. Evolution. 2008;62:76–85. doi: 10.1111/j.1558-5646.2007.00259.x. [DOI] [PubMed] [Google Scholar]
- 32.Brem RB, et al. Genetic dissection of transcriptional regulation in budding yeast. Science. 2002;296:752–755. doi: 10.1126/science.1069516. [DOI] [PubMed] [Google Scholar]
- 33.Schadt EE, et al. Genetics of gene expression surveyed in maize, mouse and man. Nature. 2003;422:297–302. doi: 10.1038/nature01434. [DOI] [PubMed] [Google Scholar]
- 34.Morley M, et al. Genetic analysis of genome-wide variation in human gene expression. Nature. 2004;430:743–747. doi: 10.1038/nature02797. [DOI] [PMC free article] [PubMed] [Google Scholar]
- 35.Li Y, et al. Mapping determinants of gene expression plasticity by genetical genomics in C. elegans. PLoS Genet. 2006;2:e222. doi: 10.1371/journal.pgen.0020222. [DOI] [PMC free article] [PubMed] [Google Scholar]
- 36.West MA, et al. Global eQTL mapping reveals the complex genetic architecture of transcript-level variation in Arabidopsis. Genetics. 2007;175:1441–1450. doi: 10.1534/genetics.106.064972. [DOI] [PMC free article] [PubMed] [Google Scholar]
- 37.Brem RB, Kruglyak L. The landscape of genetic complexity across 5,700 gene expression traits in yeast. Proc Natl Acad Sci U S A. 2005;102:1572–1577. doi: 10.1073/pnas.0408709102. [DOI] [PMC free article] [PubMed] [Google Scholar]
- 38.Purcell SM, et al. Common polygenic variation contributes to risk of schizophrenia and bipolar disorder. Nature. 2009;460:748–752. doi: 10.1038/nature08185. [DOI] [PMC free article] [PubMed] [Google Scholar]
- 39.Rockman MV. The QTN program and the alleles that matter for evolution: all that's gold does not glitter. Evolution. 2012;66:1–17. doi: 10.1111/j.1558-5646.2011.01486.x. [DOI] [PMC free article] [PubMed] [Google Scholar]
- 40.Pavlicev M, Hansen TF. Genotype-Phenotype Maps Maximizing Evolvability: Modularity Revisited. Evolutionary Biology. 2011;38:371–389. [Google Scholar]
- 41.Bost B, et al. Genetic and nongenetic bases for the L-shaped distribution of quantitative trait loci effects. Genetics. 2001;157:1773–1787. doi: 10.1093/genetics/157.4.1773. [DOI] [PMC free article] [PubMed] [Google Scholar]
- 42.Barton NH. Pleiotropic Models of Quantitative Variation. Genetics. 1990;124:773–782. doi: 10.1093/genetics/124.3.773. [DOI] [PMC free article] [PubMed] [Google Scholar]
- 43.Johnson T, Barton N. Theoretical models of selection and mutation on quantitative traits. Philos Trans R Soc Lond B Biol Sci. 2005;360:1411–1425. doi: 10.1098/rstb.2005.1667. [DOI] [PMC free article] [PubMed] [Google Scholar]
- 44.VanRaden PM, et al. Invited review: reliability of genomic predictions for North American Holstein bulls. J Dairy Sci. 2009;92:16–24. doi: 10.3168/jds.2008-1514. [DOI] [PubMed] [Google Scholar]
- 45.Keightley PD, Hill WG. Variation maintained in quantitative traits with mutation-selection balance: pleiotropic side-effects on fitness traits. Proc R Soc Lond B. 1990;242:95–100. [Google Scholar]
- 46.Otto SP. Two steps forward, one step back: the pleiotropic effects of favoured alleles. Proceedings of the Royal Society of London Series B-Biological Sciences. 2004;271:705–714. doi: 10.1098/rspb.2003.2635. [DOI] [PMC free article] [PubMed] [Google Scholar]
- 47.Kirkpatrick M. Patterns of quantitative genetic variation in multiple dimensions. Genetica. 2009;136:271–284. doi: 10.1007/s10709-008-9302-6. [DOI] [PubMed] [Google Scholar]
- 48.Clayton GA, et al. An experimental check on quantitative genetical theory. I. Short-term responses to selection. J Genet. 1956:131–151. [Google Scholar]
- 49.McGuigan K, et al. Pleiotropy, apparent stabilizing selection and uncovering fitness optima. Trends Ecol Evol. 2011;26:22–29. doi: 10.1016/j.tree.2010.10.008. [DOI] [PubMed] [Google Scholar]
- 50.Walsh B, Blows MW. Abundant Genetic Variation plus Strong Selection = Multivariate Genetic Constraints: A Geometric View of Adaptation. Annual Review of Ecology Evolution and Systematics. 2009;40:41–59. [Google Scholar]
- 51.Paaby AB, Schmidt PS. Dissecting the genetics of longevity in Drosophila melanogaster. Fly (Austin) 2009;3:29–38. doi: 10.4161/fly.3.1.7771. [DOI] [PubMed] [Google Scholar]
- 52.Partridge L, et al. Sex and death: what is the connection? Cell. 2005;120:461–472. doi: 10.1016/j.cell.2005.01.026. [DOI] [PubMed] [Google Scholar]
- 53.Carroll SB. Evo-devo and an expanding evolutionary synthesis: A genetic theory of morphological evolution. Cell. 2008;134:25–36. doi: 10.1016/j.cell.2008.06.030. [DOI] [PubMed] [Google Scholar]
- 54.Flatt T. Survival costs of reproduction in Drosophila. Exp Gerontol. 2011;46:369–375. doi: 10.1016/j.exger.2010.10.008. [DOI] [PubMed] [Google Scholar]
- 55.Fisher RA. The genetical theory of natural selection. Oxford: Oxford University Press; 1930. [Google Scholar]
- 56.Kacser H, Burns JA. The molecular basis of dominance. Genetics. 1981;97:639–666. doi: 10.1093/genetics/97.3-4.639. [DOI] [PMC free article] [PubMed] [Google Scholar]
- 57.Wagner GP, et al. The road to modularity. Nat Rev Genet. 2007;8:921–931. doi: 10.1038/nrg2267. [DOI] [PubMed] [Google Scholar]
- 58.Wright S. Pleiotropy in the evolution of structural reduction and of dominance. Am Nat. 1964;98:65–69. [Google Scholar]
- 59.Su Z, et al. A preliminary analysis of gene pleiotropy estimated from protein sequences. J Exp Zool B Mol Dev Evol. 2010;314:115–122. doi: 10.1002/jez.b.21315. [DOI] [PubMed] [Google Scholar]
- 60.Pavlicev M, Wagner GP. A model of developmental evolution: selection, pleiotropy and compensation. Trends Ecol Evol. 2012;27:316–322. doi: 10.1016/j.tree.2012.01.016. [DOI] [PubMed] [Google Scholar]
- 61.Zhang XS, Hill WG. Multivariate stabilizing selection and pleiotropy in the maintenance of quantitative genetic variation. Evolution. 2003;57:1761–1775. doi: 10.1111/j.0014-3820.2003.tb00584.x. [DOI] [PubMed] [Google Scholar]
- 62.Waxman D, Welch JJ. Fisher's microscope and Haldane's ellipse. Am Nat. 2005;166:447–457. doi: 10.1086/444404. [DOI] [PubMed] [Google Scholar]
- 63.Martin G, Lenormand T. A general multivariate extension of Fisher's geometrical model and the distribution of mutation fitness effects across species. Evolution. 2006;60:893–907. [PubMed] [Google Scholar]
- 64.Wagner GPZJ. Universal pleiotropy is not a valid null hypothesis: reply to Hill and Zhang. Nat Rev Genet. 2012:13. [Google Scholar]
- 65.Hill WG, Zhang XS. Assessing pleiotropy and its evolutionary consequences: pleiotropy is not necessarily limited, nor need it hinder the evolution of complexity. Nat Rev Genet. 2012;13:296. doi: 10.1038/nrg2949-c1. author reply 296. [DOI] [PubMed] [Google Scholar]
- 66.Balestre M, et al. Bayesian mapping of multiple traits in maize: the importance of pleiotropic effects in studying the inheritance of quantitative traits. Theor Appl Genet. 2012;125:479–493. doi: 10.1007/s00122-012-1847-1. [DOI] [PubMed] [Google Scholar]
- 67.Jiang CJ, Zeng ZB. Multiple-Trait Analysis of Genetic-Mapping for Quantitative Trait Loci. Genetics. 1995;140:1111–1127. doi: 10.1093/genetics/140.3.1111. [DOI] [PMC free article] [PubMed] [Google Scholar]
- 68.Almasy L, et al. Bivariate quantitative trait linkage analysis: pleiotropy versus co-incident linkages. Genet Epidemiol. 1997;14:953–958. doi: 10.1002/(SICI)1098-2272(1997)14:6<953::AID-GEPI65>3.0.CO;2-K. [DOI] [PubMed] [Google Scholar]
- 69.Lebreton CM, et al. A nonparametric bootstrap method for testing close linkage vs. pleiotropy of coincident quantitative trait loci. Genetics. 1998;150:931–943. doi: 10.1093/genetics/150.2.931. [DOI] [PMC free article] [PubMed] [Google Scholar]
- 70.Knott SA, Haley CS. Multitrait least squares for quantitative trait loci detection. Genetics. 2000;156:899–911. doi: 10.1093/genetics/156.2.899. [DOI] [PMC free article] [PubMed] [Google Scholar]
- 71.Varona L, et al. Derivation of a Bayes factor to distinguish between linked or pleiotropic quantitative trait loci. Genetics. 2004;166:1025–1035. doi: 10.1093/genetics/166.2.1025. [DOI] [PMC free article] [PubMed] [Google Scholar]
- 72.Pavlicev M, et al. Genetic variation in pleiotropy: Differential epistasis as a source of variation in the allometric relationship between long bone lengths and body weight. Evolution. 2008;62:199–213. doi: 10.1111/j.1558-5646.2007.00255.x. [DOI] [PubMed] [Google Scholar]
- 73.Lynch M, Force A. The probability of duplicate gene preservation by subfunctionalization. Genetics. 2000;154:459–473. doi: 10.1093/genetics/154.1.459. [DOI] [PMC free article] [PubMed] [Google Scholar]
- 74.Des Marais DL, Rausher MD. Escape from adaptive conflict after duplication in an anthocyanin pathway gene. Nature. 2008;454:762–765. doi: 10.1038/nature07092. [DOI] [PubMed] [Google Scholar]
- 75.Wolf JB, et al. The contribution of epistatic pleiotropy to the genetic architecture of covariation among polygenic traits in mice. Evol Dev. 2006;8:468–476. doi: 10.1111/j.1525-142X.2006.00120.x. [DOI] [PubMed] [Google Scholar]