

Abstract
Loss of function mutations in THAP1 have been associated with primary generalized and focal dystonia in children and adults. THAP1 encodes a transcription factor (THAP1) that harbors an atypical zinc finger domain and plays a critical role in G1-S cell cycle control. Current thinking suggests that dystonia may be a neurodevelopmental circuit disorder. Hence, THAP1 may participate in the development of the nervous system. Herein, we report the neurodevelopmental expression patterns of Thap1 transcript and THAP1 protein from the early postnatal period through adulthood in rat brain, spinal cord and dorsal root ganglia (DRG). We detected Thap1 transcript and THAP1-immunoreactivity (IR) in cerebral cortex, cerebellum, striatum, substantia nigra, thalamus, spinal cord and DRG. Thap1 transcript expression was higher in brain than in spinal cord and DRG at P1 and P7 and declined to similar levels at P14 and later time points in all regions except cerebellum, where it remained high through adulthood. In brain, THAP1 expression was highest in early development, particularly in cerebellum at P7. In addition to Purkinje cells in the cerebellum, THAP1-IR was also localized to pyramidal neurons in cerebral cortex, relay neurons in thalamus, medium spiny and cholinergic neurons in striatum, dopaminergic neurons in substantia nigra, and pyramidal and interneurons in hippocampus. In cerebellar cortex, THAP1-IR was prominently distributed in the perikarya and proximal dendrites of Purkinje cells at early time-points. In contrast, it was more diffusely distributed throughout the dendritic arbor of adult Purkinje cells producing a moderate diffuse staining pattern in the molecular layer. At all time points, nuclear IR was weaker than cytoplasmic IR. The prominent cytoplasmic and developmentally-regulated expression of THAP1 suggests that THAP1 may function as part of a cell surface-nucleus signaling cascade involved in terminal neural differentiation.
Keywords: THAP1, Purkinje cells, cerebellum, dystonia, DYT6, transcription factor
INTRODUCTION
Over 60 distinct mutations in human THAP1 have been associated with varied anatomical distributions of primary dystonia (Fuchs et al., 2009, Xiao et al., 2010, Blanchard et al., 2011, LeDoux et al., 2012). Mean age of onset is 16.8 years and ranges from 3 years to the seventh decade of life (LeDoux et al., 2012). Human THAP1 maps to Chr. 8p11.21 and encodes a transcription factor which contains a sequence-specific zinc-dependent DNA binding THAP domain (1-81aa), a proline-rich region, a nuclear localization signal (146-162aa) and a coiled-coil domain (Bessiere et al., 2008). THAP1 plays an important role in transcriptional regulation in the context of cell proliferation and the pRb/E2F G1-S cell cycle pathway (Cayrol et al., 2007, Bessiere et al., 2008). Most THAP1 mutations appear to manifest via loss of function (LeDoux et al., 2012). The roles of THAP1 in motor system molecular biology and the pathophysiology of THAP1 dystonia are unidentified.
Suggestions regarding the function of THAP1 in neural tissues can be derived from studies of angiogenesis. In particular, THAP1 expression is central to endothelial cell proliferation (Cayrol et al., 2007). The anti-proliferative effects of THAP1 on endothelial cells are not dependent on apoptosis but progression from the G1 to S phases of the cell cycle. Overexpression of THAP1 in human endothelial cells inhibits cell-cycle progression at the G1-S transition due to repression of pRb/E2F cell-cycle target genes (Cayrol et al., 2007). THAP1 co-localizes with the proapoptotic leucine-zipper protein Par-4 and potentiates TNFα-induced apoptosis (Roussigne et al., 2003). These data suggest that neuronal THAP1 may function in concert with other proteins during neurodevelopment through regulation of the G1-S transition and apoptosis.
There are 12 THAP genes in human genome (THAP0-11). THAP family members harbor similar N-terminal zinc finger domains, but recognize different DNA target sequences (Bessiere et al., 2008). The THAP family appears to function as sequence-specific DNA-binding factors with roles in proliferation, apoptosis, G1-S cell-cycle control, chromatin modification, and transcriptional regulation (Gau et al., 2008, Balakrishnan et al., 2009, Mazars et al., 2010, Trollmann et al., 2010, Cilenti et al., 2011).
At present, little is known regarding the temporal and spatial distribution of THAP1 in brain. Understanding the development expression of THAP1 in sensorimotor regions of brain is of utmost importance given that primary dystonia may be a neurodevelopment network disorder (Carbon and Eidelberg, 2009, Niethammer et al., 2011, Zhao et al., 2011, LeDoux et al., 2012). Other dystonia-related proteins have shown distinct expression patterns and neurodevelopmental profiles in the central nervous system. TorsinA, for instance, it expressed at high levels in striatal cholinergic neurons and cerebellar Purkinje cells at P14 (Xiao et al., 2004), and TAF1, a transcription factor associated with X-linked dystonia-Parkinsonism, shows preferential expression in striatal medium spiny neurons located in the striosomal compartments of the striatum (Sako et al., 2011). Herein, we investigated the expression of rat Thap1 transcript and THAP1 protein from the early postnatal period through adulthood in rat brain, spinal cord and dorsal root ganglia (DRG). These data should form a platform for analysis of corresponding animal models and facilitate studies of THAP1 neurodevelopmental biology.
EXPERIMENTAL PROCEDURES
Experimental animals
All experiments were performed in accordance with the National Institutes of Health’s Guide for the Care and Use of Laboratory Animals and approved by our Institutional Animal Care and Use Committee. Male Sprague-Dawley rats (Harlan, Indianapolis, IN, USA) were used for all experiments described herein.
Tissue collection
Rats were rapidly and deeply anesthetized with 5% isoflurane in a bell-jar prior to decapitation and tissue harvesting for RNA and protein extraction. Using a three-person technique, tissue samples were harvested from all regions within 3 min after decapitation. For in situ hybridization, rats were rapidly and deeply anesthetized with 5% isoflurane prior to decapitation, brain removal and freezing in isopentane chilled to −40 °C. For immunohistochemistry, rats were overdosed with pentobarbital (100 mg/kg, i.p.) prior to transcardiac perfusion with heparinized saline and then 4 % paraformaldehyde/0.1 M phosphate buffer (PB). Brains were post-fixed for 2 h, blocked and incubated in a cryoprotectant solution (30% sucrose/0.1 M PB, pH 7.4) for at least 48 h. Blocks for in situ hybridization were sectioned at 16 μm on a cryostat and sections were collected onto SuperFrost®-Plus glass slides (Fisher Scientific, Pittsburgh, PA, USA). Slides were stored at −80 °C in sealed slide boxes with desiccant capsules. Blocks for immunohistochemistry were sectioned at 20 μm, collected onto SuperFrost®-Plus glass slides and allowed to dry on a slide warmer for 10 min prior to placement in phosphate-buffered saline (PBS). At least three rats were used for tissue collection at each developmental time point for each analysis.
Relative quantitative reverse transcription PCR (QRT-PCR)
Total RNA was extracted with TRI reagent® (Ambion, Austin, TX, USA). Genomic DNA was removed with DNA-free™ (Ambion, Austin, TX, USA) prior to reverse transcription of RNA. Total RNA quality was examined with agarose gel electrophoresis and a NanoDrop® ND-1000 spectrophotometer (NanoDrop Technologies, Wilmington, DE, USA). Reverse transcription was performed with Ambion’s RETROscript™ kit using 500 ng total RNA as template. The reaction mixture was incubated at 44 °C for 1 hr and then at 92 °C for 10 min. QRT-PCR was performed using the Roche LightCycler 480 with gene specific primers and Universal Taqman® probes for both the target genes (Thap1 isoform 1 and Thap1 isoform 2) and 18S endogenous control (Table 1). The chosen control (18S) showed the least temporal and spatial variability among a panel of 6 endogenous control genes. The specificity of Thap1 primers was established with agarose gel electrophoresis and Sanger sequencing of PCR products.
Table 1.
Probe and Primers Used for QRT-PCR and Primers Used for the Generation of In Situ Hybridization Probes
| Name | Sequence (5′→3′) | Locus (NM_001008340) | Usage | Product (bp) |
|---|---|---|---|---|
| Thap1_Is1F | ccggtacgataaggacaagc | 269 – 288nt | QRT-PCR | |
| Thap1_Is1R | agactgggacgagtaagaggaa | 328 – 307nt | QRT-PCR | 60 (with IS1F) |
| Thap1_Is1P | ctccttcc | 293 – 300nt | QRT-PCR probe | |
| Thap1_Is2F | cccgtctccttccacaaaag | 288 – 304nt + 505–507nt | QRT-PCR | |
| Thap1_Is2R | tggtcacagaaaactgagaggtt | 628 – 606nt | QRT-PCR | 141 (with IS2F) |
| Thap1_Is2P | tcctctcc | 587 – 594nt | QRT-PCR probe | |
| Thap1_AF | atggtgcagtcctgttccg | 234 – 252nt | In Situ probe | |
| Thap1_AR | gataatacgactcactatagggtcatgctggcacttcaacaat | 866 – 846nt | In Situ probe | 633 (with AF) |
| Thap1_SF | gataatacgactcactatagggatggtgcagtcctgttccg | 234 – 252nt | In Situ sense probe | |
| Thap1_SR | tcatgctggcacttcaacaat | 866 – 846nt | In Situ sense probe | 633 (with SF) |
The promoter sequence for T7 RNA polymerase is indicated with bold text.
Radioactive in situ hybridization
Radiolabeled (35S-UTP) complementary RNA (cRNA) probes were used to localize Thap1 in cryostat sections of rat brain. To begin with, a PCR strategy was used to add a T7 RNA polymerase promoter site to DNA templates for in vitro transcription of cRNA. Rat cerebellar cortex cDNA derived from reverse transcription served as PCR template. For confirmation, double-stranded cDNA was gel purified and Sanger sequenced in the forward and reverse directions. Both the sense and antisense radiolabeled (35S-UTP) cRNA probes were synthesized with Ambion’s MEGAscript® T7 Kit. The probes were then column purified with ProbeQuant G-50 Micro Columns (Amersham Biosciences, Piscataway, NJ, USA) and quantified with a liquid scintillation counter. A detailed hybridization protocol from our laboratory was previously published (Xiao et al., 2004). Briefly, after fixation, acetylation and dehydration through a graded series of ethanol, slides were incubated overnight in the hybridization buffer with radioactive probes (final concentration, 3×10⁴ cpm/μl). After treatment with RNase A (Sigma-Aldrich, St. Louis, MO, USA) at 37 °C for 30 min followed by a high stringency wash at 60 °C for 1 h, slides were dehydrated and then exposed to Kodak Biomax MR Film along with 14C Microscale™ autoradiography standards (ARC0146, American Radiolabeled Chemicals Inc., Saint Louis, MO, USA) for 21 days. Each sheet of film was exposed to microscopic slides from all of the developmental time points tested. Autoradiographic images were acquired in transmission mode (ScanMaker 9800 XL, Microtek, Carson, CA, USA) and imported into ImageJ (Java version of NIH Image, http://rsb.info.nih.gov/ij/) for region of interest (ROI) quantification of radioactivity. Optical density was calibrated to the set of autoradiography standards to generate measures of radioactivity (nCi/g tissue) for each ROI. At each developmental time point (P1, P7, P14, and 2M), at least 30 radioactivity measures were made from each area of interest (cerebral cortex, cerebellum, thalamus, striatum and hippocampus); 5 to 8 of these measures were made from each of the five brains used at each developmental time point. Regions of interest (ROIs) were drawn to encompass the entirety of a particular structure without inclusion of contiguous neural tissue. Furthermore, ROIs were spaced along the medial-to-lateral brain axis to sample much of each structure’s characteristics. Data was analyzed with a mixed-model analysis of variance with mean radioactivity (nCi/g) within an ROI as the dependent variable and developmental time point (P1, P7, P14, and 2M) and ROI (cerebral cortex, cerebellum, thalamus, striatum and hippocampus) as the independent variables. ROI was treated as a repeated measure since radioactivity intensities from each brain were presumed to be correlated. All statistical analyses were performed with SAS (SAS Institute, Cary, NC, USA). The Huyn-Feldt epsilon (εH-F) is provided for repeated measures since we did not assume sphericity.
Generation of human THAP1 vector
The Invitrogen Gateway system was used to generate a human THAP1 (hTHAP1) vector. The coding sequence of human wild-type THAP1 was amplified with Pfu DNA polymerase (Stratagene, La Jolla, California, USA) using cDNA generated from human whole brain total RNA as template. Then, hTHAP1 was cloned into the entry vector using pENTR™/D-TOPO® cloning kit (Invitrogen, Carlsbad, CA, USA). A positive hTHAP1 entry clone was verified by sequencing with the M13 forward primer using an Applied Biosystems 3130XL Genetic Analyzer. The coding sequence of hTHAP1 was then transferred from the entry vector to the pcDNA™3.2/V5-DEST expression vector using the Gateway recombination cloning technique. The recombinant protein included full-length hTHAP1 with a V5 epitope tag at the C-terminus. The positive expression clone was sequenced along with the T7 promoter primer to ensure that hTHAP1 was in frame with the C-terminal V5 epitope.
Cell culture and transfection
HEK293T cells were grown in DMEM (Cellgro, Manassas, VA, USA) supplemented with 10% heat-inactivated fetal bovine serum (Sigma) and 25mM HEPES (Sigma) at 37°C in a humidified atmosphere of 5% CO2. Cells were transfected with empty vector, hTHAP1, and hTHAP1-RNAi (s30274, Ambion) at 50% confluence by using Lipofectamine 2000 (Invitrogen). Two days after transfection, cells were harvested for protein extraction and subsequent immunoblot analyses.
Protein harvesting and Western blot analysis
Proteins from the transfected HEK293T cells were extracted with chilled NE-PER Nuclear and Cytoplasmic Extraction Reagents (Thermo Scientific, Rockford, IL, USA) with a protease inhibitor cocktail (Sigma). Protein concentrations were established with the Bio-Rad DC Protein Assay kit using BSA standards. Approximately 10 μg of nuclear protein was denatured at 70 °C for 10 min in 4X sample buffer with 10X reducing reagent, electrophoretically resolved on NuPAGE® Novex 4–12% Bis-Tris Midi precast gels (Invitrogen) and transferred to PVDF membranes. Membranes were then blotted with an affinity-purified ProteinTech rabbit anti-THAP1 polyclonal antibody (1:5000; ProteinTech, Chicago, IL), Novus rabbit anti-THAP1 polyclonal MaxPab® antibody D01P (1:500; Novus, Littleton, CO), ProteinTech rabbit anti-THAP1 polyclonal antibody pre-absorbed with 5X recombinant protein (1:5000; ProteinTech), a mouse anti-V5 monoclonal antibody (1:5000; Invitrogen) or a mouse anti-β-tubulin monoclonal antibody (1:5000; Chemicon International, Temecula, CA, USA). Horseradish peroxidase-conjugated secondary antibodies (1:5000; GE Healthcare, Pittsburgh, PA, USA) and the ECL Plus detection system from GE Healthcare were used to visualize the target proteins.
Multiple tissue and time point Western blots
For quantitative western blot analysis, small tissue blocks from fresh rat brain were rinsed in PBS and homogenized in chilled M-PER Mammalian Protein Extraction Reagent (Thermo Scientific) with protease inhibitor cocktail. Affinity-purified ProteinTech rabbit anti-THAP1 polyclonal (1:5000) and mouse anti-β-tubulin monoclonal (1:5000) antibodies were incubated simultaneously. IRDye® 800CW donkey anti-mouse and IRDye 680 donkey anti-rabbit were used as the secondary antibodies. The membranes were scanned and signal intensities were analyzed by using the Odyssey® Infrared Imaging System (Li-Cor, Lincoln, Nebraska, USA).
Immunocytochemistry
Equivalent sections from five developmental time points (P7, P14, P21, 2M [2 months], and 6M) were processed simultaneously. After endogenous peroxidases were quenched, slides were blocked and exposed to the primary ProteinTech rabbit anti-THAP1 antibody (1:500) or Novus rabbit anti-THAP1 polyclonal antibody (1:100) overnight. After rinsing with PBS, slides were exposed to biotinylated goat anti-rabbit antibody (1:500) for 4 hrs, rinsed and then exposed to streptavidin for 1 hr. Labeling was visualized with nickel-intensified 3, 3′-diaminobenzidine (DAB) solution (Vector, Burlingame, CA, USA). For double-label fluorescent immunocytochemistry, mouse anti-calbindin monoclonal (1:1500; Sigma-aldrich), mouse anti-parvalbumin monoclonal (1:1000; Sigma-aldrich), mouse anti-tyrosine hydroxylase (TH) polyclonal (1:500; Chemicon International), mouse anti-lamin A&C monoclonal (1:100; Abcam, San Francisco, CA, USA), mouse anti-histone 1 monoclonal (1:500) or a goat anti-choline acetyltransferase (ChAT) polyclonal (1:50; Chemicon International) antibodies were used in combination with rabbit anti-THAP1 (1:300). The secondary antibodies were Cy2-tagged donkey anti-rabbit (1:250), and rhodamine red-X (RRX)-tagged donkey anti-mouse or anti-goat (1:250; Jackson ImmunoResearch Laboratories, West Grove, PA, USA). Sections were incubated with secondary antibodies for 4 h and then rinsed, dehydrated, cleared and coverslipped with 1, 3 diethyl-8-phenylxanthine mounting compound (DPX; Sigma). Sections were visualized with both epifluorescence (Leica DM 6000B) and confocal laser-scanning (Zeiss LSM 710, Thornwood, NY) microscopes.
RESULTS
QRT-PCR
Thap1 transcript was detected in all tissues studied (Fig. 1). Using 18S ribosomal RNA as the endogenous control, the major transcript of Thap1, isoform 1, was expressed at higher levels in brain than in DRG at early development time points (P1, and P7; Fig. 1A). At P14 and later time points, with the exception of cerebellum, expression of Thap1 isoform 1 in brain was comparable to that in spinal cord and DRG. In addition, Thap1 isoform 1 was highest at P7 in most brain regions (cerebral cortex, hippocampus, thalamus and cerebellum) except striatum, where Thap1 isoform 1 reached its peak at P14.
Fig. 1.

Relative quantitative real-time RT-PCR for Thap1. (A) Relative expression of Thap1 isoform 1 normalized to P21 cerebral cortex. (B) Relative percent contribution of Thap1 isoform 2 to total Thap1 transcripts.
Relative to isoform 1, Thap1 isoform 2 was expressed at low levels in neural tissues (Fig. 1B). In cerebral cortex, it contributed to 4.5% of total Thap1 transcript at P1 and then declined to 1% at P14 and later developmental stages. In contrast, the expression of isoform 2 was more constant in cerebellum than in cerebral cortex during development. In cerebellum, isoform 2 contributed 4% of total Thap1 transcripts at P1, and 2% at P7 and later time points.
Quantitative in situ hybridization
In rat brain, Thap1 mRNA showed widespread neuronal distribution and modest temporal variation (Fig. 2). Overall, signal intensity was greatest in regions with high neuronal density such as the granular cell layer of the cerebellum, pyramidal cell layer and dentate gyrus of the hippocampus. The signal intensity was relatively strong in striatum, cerebral cortex and pontine nuclei. Transcript was also weakly localized to the superior and inferior colliculi, thalamus, along with medulla and midbrain.
Fig. 2.

In situ hybridization for Thap1 at E15, P1, P7, P14, P21, P28, 2M, and 6M developmental time points. Roughly equivalent autoradiographic images of parasagittal sections hybridized with radiolabeled (35S-UTP) anti-sense cRNA probes are shown along with a parasagittal P14 brain section hybridized with a Thap1 sense probe. Scale bar, 5 mm.
With quantitative analysis of radioactivity in cerebral cortex, cerebellum, thalamus, striatum, and hippocampus at P1, P7, P14, and 2M, there were strong effects of age (F3,16=68.23, p<0.0001), ROI (F4,64=25.72, p<0.0001, εH-F=0.75), and the age x ROI interaction (F12,64=7.54, p<0.0001, εH-F=0.75) on radioactivity (Table 2). The effect of age on radioactivity was apparent for all ROIs (p<0.0001, for all). When averaged across all ROIs, radioactivity was over five-fold higher at P1 (M=115.31 nCi/g) than at 2M (M=21.05 nCi/g). In addition, all individual contrasts between P1 and P7, P14, 2M ROIs were significant (p<0.0001, for all). Furthermore, individual contrasts between P7 and 2M ROIs were also significant in cerebral cortex and cerebellum (p<0.05).
Table 2.
Quantitative in situ hybridization for Thap1.
| Age | Cerebellum | Cerebral cortex | Striatum | Thalamus | Hippocampus |
|---|---|---|---|---|---|
| P1 | 121.24 ± 15.23a | 153.72 ± 9.90a | 86.12 ± 6.75a | 99.13 ± 13.80a | 116.33 ± 11.17a |
| P7 | 56.10 ± 8.83b | 43.13 ± 6.44b | 25.13 ± 1.86 | 24.05 ± 1.89 | 32.37 ± 3.80 |
| P14 | 39.33 ± 1.62 | 30.17 ± 2.43 | 22.03 ± 1.47 | 19.80 ± 0.75 | 25.50 ± 1.63 |
| 2M | 25.63 ± 3.35 | 20.20 ± 2.11 | 18.10 ± 1.54 | 20.90 ± 1.02 | 20.43 ± 1.68 |
All values are expressed as ηCi/g tissue ± standard error of the mean.
p < 0.0001 for contrast between P1 and all other ages.
p < 0.05 for contrast between P7 and 2M.
Multiple tissue and time point Western blots
The signal specificities of the ProteinTech and Novus rabbit anti-THAP1 polyclonal antibodies were examined and compared with HEK293 nuclear protein extracts (Fig. 3A), rat brain total protein extracts and tissue sections from rat cerebellar cortex. A band of approximately 32 kD band was detected with the rabbit anti-THAP1 polyclonal antibodies in hTHAP1 transfected HEK293 protein extracts but not in the vector only or THAP1-RNAi transfected protein extracts. In addition, the same bands were detected with the mouse anti-V5 monoclonal antibody. Signal was reduced after the ProteinTech antibody was pre-absorbed with 5X recombinant THAP1 protein. The ProteinTech antibody was more sensitive than the Novus antibody and was able to detect a band of approximately 27 kD consistent with the size of endogenous hTHAP1. Expression was reduced approximately 80% with THAP1 specific RNAi. Both rabbit antibodies detected well-defined 27 kD bands in rat striatum, thalamus, hippocampus, cerebellum and cerebral cortex extracts (Fig. 3B). Furthermore, the immunostaining patterns of the two rabbit anti-THAP1 antibodies were similar with both Western blotting and immunohistochemistry (Fig. 3A–C). In aggregate, these data support the specificity of the rabbit anti-THAP1 polyclonal antibody used in our study for Western blotting and immunocytochemistry.
Fig. 3.

Western blot analysis with ProteinTech affinity-purified rabbit anti-THAP1 polyclonal antibody. (A) Signal specificity was evaluated in HEK293 protein extracts without and with antibody pre-absorption. THAP1 was also detected with mouse anti-V5 and Novus affinity-purified polyclonal rabbit anti-THAP1 antibodies. β-tubulin served as the endogenous control. (B) A single band was seen with protein extracts from striatum, thalamus, hippocampus, cerebellum and cerebral cortex. β-tubulin was the endogenous control. (C) Immunohistochemical staining patterns in P14 and 2M rat cerebellum were similar with ProteinTech and Novus anti-THAP1 antibodies. Scale bar, 100 μm. (D) Relative THAP1 expression in comparison to 2M cerebral cortex with β-tubulin as the endogenous control.
THAP1 immunoreactivity (IR) was present in all brain tissues tested and spinal cord at P7, P14, P21, 2M and 6M. Using β-tubulin as the loading control, THAP1 expression was highest in early development, particularly in cerebellum at P7 (Fig. 3D).
Immunocytochemistry
THAP1 showed a mildly heterogeneous pattern of nuclear staining in transfected HEK293 cells (Fig. 4). THAP1-IR was not concentrated near the nuclear envelope. In cell culture, minimal cytoplasmic signal was apparent. No significant endogenous THAP1-IR was detected with the blank vector.
Fig. 4.

Immunofluorescence localization of THAP1 in hTHAP1 transfected HEK293 cells. THAP1 was detected with affinity-purified polyclonal rabbit anti-THAP1 antibody. Nuclei were counterstained with DAPI, and cells were visualized by differential interference contrast (DIC) microscopy. MERGE is an overlay of the THAP1, DAPI, and DIC images. Scale bar, 10 μm.
THAP1-IR was present in rat brain, spinal cord and DRG at P7, P14, P21, 2M and 6M (Fig. 5–7). In brain, THAP1-IR was present in pyramidal neurons in cerebral cortex, relay neurons in thalamus, medium spiny and cholinergic neurons in striatum, dopaminergic neurons in ventral midbrain, and pyramidal and interneurons in hippocampus. In addition, THAP1-IR was also present in motor neurons in spinal cord and sensory ganglion cells in DRG. THAP1-IR was very striking in early development at P7 and P14. At later developmental time points, THAP1-IR decreased in other brain regions except cerebellum, where it remained high in adult brains. In cerebellar cortex, THAP co-localized with calbindin-IR in the Purkinje cells (Fig. 8). THAP1-IR was prominent in the perikarya and proximal dendrites of Purkinje cells at early postnatal time-points. In contrast, THAP1-IR was more diffusely distributed throughout the dendritic arbors of adult Purkinje cells producing a moderately strong diffuse staining pattern in the molecular layer. At all time points, nuclear IR was weaker than cytoplasmic IR. In a subset of Purkinje cells, THAP1-IR appeared concentrated near the nuclear envelope and co-localized with histone 1 and lamin A&C-IR (Fig. 9). Moreover, THAP1 was not co-localized with parvalbumin-IR in the stellate cells in the molecular layer (Fig. 10). In other brain regions, THAP1-IR was present in the TH-positive dopaminergic neurons in substantial nigra and ChAT-positive cholinergic neurons in striatum (Fig. 11).
Fig. 5.

Nickel-intensified DAB THAP1-IR in rat brain at multiple developmental time points. m, molecular layer; p, Purkinje cell layer; g, granular cell layer. Scale bar, 200 μm.
Fig. 7.

THAP1-IR in spinal cord and DRG. THAP1-IR was also present in motor neurons in spinal cord (left panel) and sensory ganglion cells in DRG (right panel) with high level in early development and weaker expression in adulthood. Scale bars, 100 μm in spinal cord; 50 μm in DRG.
Fig. 8.

Double-label fluorescent immunocytochemistry for simultaneous detection of Purkinje cell marker calbindin (red) and THAP1 (green) in rat cerebellum. THAP1-IR was prominent in the perikarya and proximal dendrites of Purkinje cells at early postnatal time points. In contrast, THAP1-IR was more diffusely distributed throughout the dendritic arbors of adult Purkinje cells producing a moderately strong diffuse staining pattern in the molecular layer. m, molecular layer; p, Purkinje cell layer; g, granular cell layer. Scale bar, 50 μm.
Fig. 9.
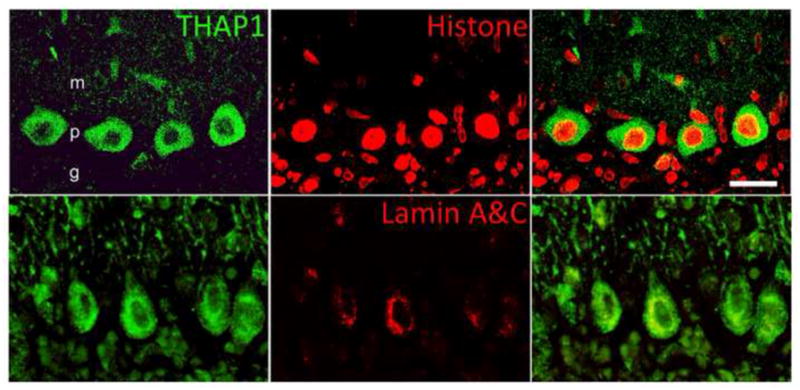
Subcellular localization of THAP1-IR. Double-label fluorescent immunocytochemistry for simultaneous detection of THAP1 (green) with histone 1 (red) or lamin A&C (red). Some THAP1-IR appeared concentrated near the nuclear envelope within the nucleus and showed modest co-localization with histone 1, and minimal co-localization with lamin A&C. Scale bar, 25 μm.
Fig. 10.
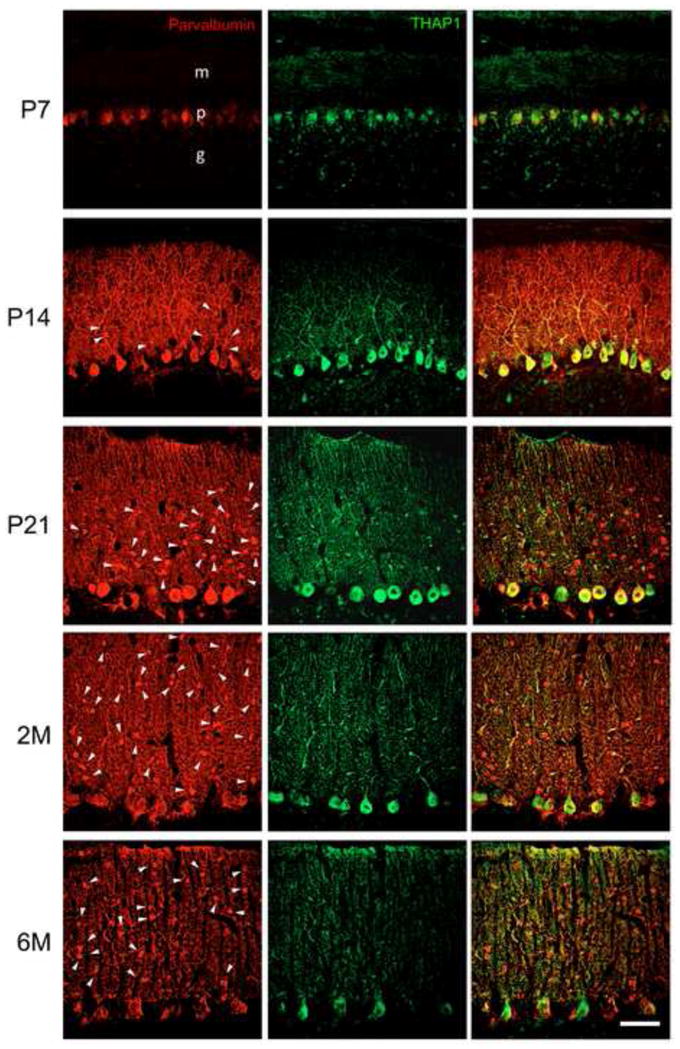
Double-label fluorescent immunocytochemistry for simultaneous detection of THAP1 (green) and parvalbumin (red) in rat cerebellum. THAP1-IR was not localized to interneurons within molecular layer. Arrows are used to mark a subset of neurons within the molecular layer. m, molecular layer; p, Purkinje cell layer; g, granular cell layer. Scale bar, 50 μm.
Fig. 11.
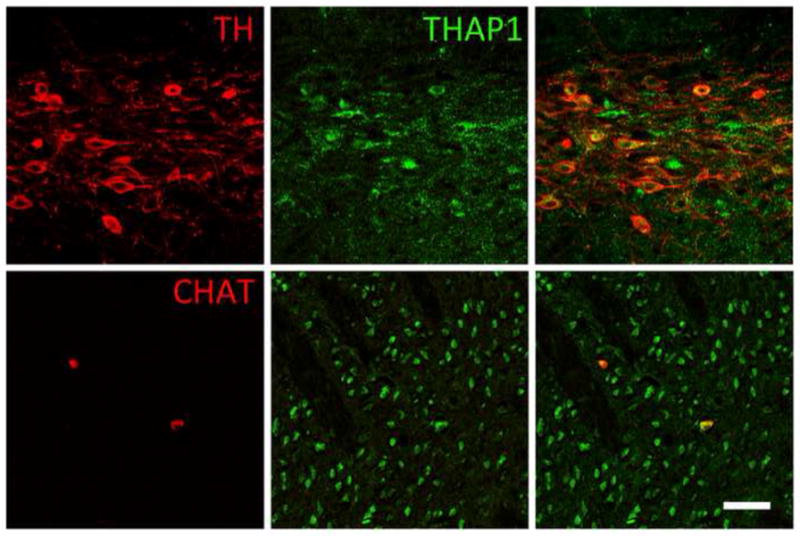
Double-label fluorescent immunocytochemistry for simultaneous detection of THAP1 (green) with TH or ChAT (red) in P14 rat brain. THAP1-IR was present in TH-positive dopaminergic neurons in substantial nigra and ChAT-positive cholinergic neurons in striatum. Scale bar, 50 μm.
DISCUSSION
THAP1 transcript is expressed in neural and non-neural tissues including blood, testis, liver, lung, heart, kidney and skeletal muscle (symatlas.gnf.org). In previous work, Northern blot analysis revealed the presence of two bands below a bona fide 2.2-kb THAP1 mRNA band, likely due to distinct polyadenylation signals in the THAP1 3′UTR (Cayrol et al., 2007). Northern blotting showed the strongest signals in heart, skeletal muscle, kidney, brain and liver. In adult mouse brain, Thap1 mRNA is concentrated in cerebellar Purkinje and Golgi cells (Allen Atlas). In mouse, modest transcript expression is also apparent in the hippocampus with weaker expression in other brain regions. Previously published literature did not address the temporal, regional and subcellular expression of THAP1 protein in brain. Herein, we detailed expression of Thap1 transcript and THAP1 protein in cerebral cortex, cerebellum, striatum, substantia nigra, thalamus, spinal cord and DRG. THAP1 expression was tightly regulated during development, with the highest levels noted during early development in the central nervous system followed by a gradual decline to relatively stable levels by P14 in all regions except cerebellum, where expression remained relatively high until adulthood. In cerebellar cortex, THAP1-IR was prominently distributed in the perikarya and proximal dendrites of Purkinje cells at early time points. In the more mature nervous system, however, THAP1 was more diffusely distributed throughout the dendritic arbor of Purkinje cells producing a moderate diffuse staining pattern in the molecular layer.
The temporal and topological details of THAP1 protein and Thap1 transcript expression may facilitate mechanistic formulations of the cellular and systems biology of dystonia. First of all, THAP1 protein expression reaches its peak in cerebellar Purkinje cells at P14, a period of extensive dendritic arborization. Second, our work suggests that there is a relative mismatch between levels of THAP1 protein and Thap1 transcript in adult cerebellar cortex. A pool of readily-available Thap1 transcript may be needed for translation during sensorimotor learning. In this regard, many proteins involved in neurodevelopmental processes are also required for learning-based plasticity in adult brain.
The 12 THAP genes in human genome (THAP0-11) harbor similar N-terminal zinc finger domains, but recognize different DNA target sequences (Bessiere et al., 2008). The THAP family appears to function as sequence-specific DNA-binding factors with roles in proliferation, apoptosis, G1-S cell-cycle control, chromatin modification, and transcriptional regulation. Mouse Thap2 is expressed in developing brain and down-regulated after systemic hypoxia (Trollmann et al., 2010). THAP3 is also expressed in brain and shares cellular binding partners with THAP1. Mazars and his colleagues (2010) reported that THAP1 and THAP3 interact with HCF-1, a potent transcriptional co-activator and cell-cycle regulator. THAP4 is upregulated in response to heat shock in porcine semen (Gau et al., 2008). THAP5, a cardiac-specific transcriptional suppressor also expressed at low levels in brain, protects cells from apoptosis (Balakrishnan et al., 2009, Cilenti et al., 2011). When integrated with the data presented herein, the THAP family of proteins likely contributes to cell-cycle regulation during development and the response of the adult nervous system to stress.
In vitro studies indicate that THAP1 regulates G1-S progression through the pRB/E2F pathway. Cayrol and co-workers (2007) identified potential intracellular targets of THAP1 with overexpression and silenced expression in endothelial cells. Importantly, the effects of knock-down with RNAi were similar to the effects of overexpression with a retroviral expression vector. In particular, significant decreases in the expression of pRB/E2F cell-cycle target genes (RRM1, MAD2, BIRC5, HMMR, RRM2, CDC2, CCNB1 and DLG7) were seen in both THAP1 overexpression and knock-down endothelial cells. In addition, RRM1 was found to be a direct transcriptional target of THAP1. Potential THAP1 binding sites have also been identified in the promoters of other genes including TOR1A (Gavarini et al., 2010; Kaiser et al., 2010).
Two-hybrid and co-immunoprecipitation studies (Roussigne et al., 2003, Rual et al., 2005, Mazars et al., 2010) have identified several protein interactions for THAP1: HCF-1, OGT, Par-4, ZCCHC10, NUP62, PHF1, U2AF2, DVL2, STRBP, GRINL1A, AP2B1, FXR2, and THAP1. This set of interacting proteins suggests that THAP1 may contribute to transcription, splicing, and, possibly, RNA transport and neurite outgrowth. Moreover, several interacting proteins indirectly implicate THAP1 in cerebellar development and synaptic plasticity. For example, AP2B1 (also called β-adaptin), a clathrin-associated cytoplasmic adaptor protein, is highly expressed in cerebellar Purkinje cells (Allen Atlas) and prefrontal cortex, and associated with synaptic transportation in the central nervous system (Martins-de-Souza et al., 2012). NUP62, a component of nuclear pore complex, mediates RNA and protein transportation between cytoplasm and nucleus (Basel-Vanagaite et al., 2006). FXR2, a homologue of the fragile X mental retardation protein (FMRP), is involved in mRNA transport. Deletion of FMRP in mice is associated with cerebellar ultrastructural abnormalities and motor learning deficits (Koekkoek et al., 2005). Finally, DVL2 appears to be involved in the Wnt signaling pathway which is critical for cerebellar morphogenesis (Andersson et al., 2009). Transcription factors often function as terminal selectors in the nervous system, and THAP1 may contribute to neuronal phenotypes in the cerebellum, possibly via combinatorial mechanisms (Hobert, 2011).
Overall, THAP-IR in brain was predominantly cytosolic. Although transcribed in the nucleus, THAP1, like other transcription factors, are translated in the cytoplasm. As such, exclusive nuclear-IR is not possible. Moreover, many transcription factors must first bind a ligand and/or undergo post-translational modifications in the cytoplasm before translocation to the nucleus (Whiteside and Goodbourn, 1993). A classic example is activation of the JAK-STAT signaling pathway by interferon which activates the kinase function of JAK which autophosphorylates itself (Stark and Darnell, 2012). Then, STAT binds autophosphorylated JAK and is phosphorylated. Phosphorylated STAT translocates to the nucleus. THAP1 probably functions as a homodimer and dimerization appears to require the coiled-coiled domain (Campagne et al., 2010, Sengel et al., 2011). Interaction with O-GlcNAc transferase (OGT) may be required for nuclear translocation of THAP1 (Akimoto et al., 2003, Mazars et al., 2010).
In general, transcription factors undergo dynamic changes in expression during development, particularly in brain (Herms et al., 1994, Hayakawa et al., 2007). For example, early growth response protein 1 (EGR1) is expressed at high levels in the striatum during the first postnatal week with a sharp rise in sensorimotor cortex at P10 - P17, and a marked decline in dentate gyrus during the third postnatal week (Herms et al., 1994). Neuronal proliferation, migration and programmed cell death are persistently shifting processes occurring during nervous system development (Oppenheim et al., 1995, Burek and Oppenheim, 1996, Maciejewska et al., 1998, Buss and Oppenheim, 2004, Buss et al., 2006) and temporal-spatial patterns of transcript expression play critical roles in dictating these delicate and intricate processes. THAP1 may contribute to the programmed neuronal death in the development of the nervous system, particularly in the cerebellum (Herrup and Sunter, 1987). Alternatively, THAP1, like E2F1, may function as a cell-cycle suppressor in mature Purkinje cells (Wang et al., 2007). The downstream consequences of either defective THAP1 binding to DNA or THAP1 deficiency would be reduced repression of THAP1 target genes, resulting in aberrant transcription of genes involved in cell-cycle control and growth (Roussigne et al., 2003, Cayrol et al., 2007, Sabogal et al., 2010).
CONCLUSIONS
In summary, Thap1 transcript and THAP1 protein were diffusely distributed in neural tissues and concentrated in cerebellar cortex. In brain, THAP1-IR was localized to pyramidal neurons in cerebral cortex, relay neurons in thalamus, medium spiny and cholinergic neurons in striatum, dopaminergic neurons in substantia nigra, and pyramidal and interneurons in hippocampus. THAP1-IR was also present in motor neurons in spinal cord and sensory ganglion cells in DRG. In addition, THAP1 expression was developmentally regulated in nervous system, with the highest levels in early development, especially at P7 in cerebellum. In cerebellar cortex, THAP1-IR was most prominent within Purkinje cells. THAP1-IR was localized to TH-positive dopaminergic neurons in substantia nigra and ChAT-positive cholinergic neurons in striatum. THAP1-IR was prominent in the perikarya and proximal dendrites at early postnatal time-points. In contrast, THAP1-IR was more diffusely distributed throughout the dendritic arbors producing a moderately strong diffuse staining pattern in layers of neuronal processes. Our findings suggest that THAP1 may require post-translational modification(s) and/or ligand binding prior to nuclear translocation.
Fig. 6.
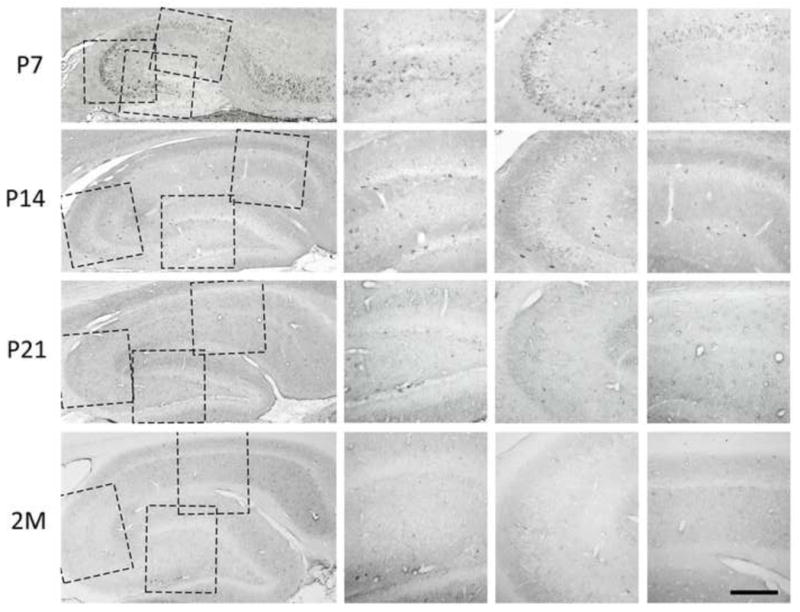
THAP1-IR in hippocampus. THAP1-IR was striking in hippocampal pyramidal and interneuon cell bodies and proximal dendrites, and weak in granule cell layer in dentate gyrus in early development. THAP1-IR was decreased with increase of age especially in pyramidal cells. In adult hippocampus, THAP1-IR was mainly mildly and diffusely distributed in the layers containing neuronal processes with sporadic intermediately stained neuronal bodies. Scale bar, 200 μm.
Highlights.
The neural expression patterns of Thap1 transcript and THAP1 protein were examined in rats.
Thap1 transcript and THAP1 protein are expressed in brain, spinal cord and dorsal root ganglia.
THAP1 expression was highest in early development, particularly in cerebellum at Postnatal Day 7.
THAP1 immunoreactivity was detected in both the nuclear and cytoplasmic compartments of neurons.
Acknowledgments
This work was supported by grants from the Bachmann-Strauss Dystonia & Parkinson Foundation and National Institutes of Health (R01NS069936).
Abbreviations
- Chat
choline acetyl-transferase
- cRNA
complementary RNA
- DRG
dorsal root ganglia
- DXP
1, 3 diethyl-8-phenylxanthine
- IR
immunoreactivity
- MANOVA
mixed-model analysis of variance
- PB
phosphate buffer
- PBS
phosphate-buffered saline
- QRT-PCR
quantitative real-time RT-PCR
- ROI
region of interest
- RRX
rhodamine red-X
- TH
tyrosin hydroxylase
- THAP
THAP domain containing, apoptosis associated protein 1
- εH-F
Huyn-Feldt epsilon
Footnotes
Publisher's Disclaimer: This is a PDF file of an unedited manuscript that has been accepted for publication. As a service to our customers we are providing this early version of the manuscript. The manuscript will undergo copyediting, typesetting, and review of the resulting proof before it is published in its final citable form. Please note that during the production process errors may be discovered which could affect the content, and all legal disclaimers that apply to the journal pertain.
References
- Akimoto Y, Comer FI, Cole RN, Kudo A, Kawakami H, Hirano H, Hart GW. Localization of the O-GlcNAc transferase and O-GlcNAc-modified proteins in rat cerebellar cortex. Brain Res. 2003;966:194–205. doi: 10.1016/s0006-8993(02)04158-6. [DOI] [PubMed] [Google Scholar]
- Andersson T, Sodersten E, Duckworth JK, Cascante A, Fritz N, Sacchetti P, Cervenka I, Bryja V, Hermanson O. CXXC5 is a novel BMP4-regulated modulator of Wnt signaling in neural stem cells. J Biol Chem. 2009;284:3672–3681. doi: 10.1074/jbc.M808119200. [DOI] [PubMed] [Google Scholar]
- Balakrishnan MP, Cilenti L, Mashak Z, Popat P, Alnemri ES, Zervos AS. THAP5 is a human cardiac-specific inhibitor of cell cycle that is cleaved by the proapoptotic Omi/HtrA2 protease during cell death. Am J Physiol Heart Circ Physiol. 2009;297:H643–653. doi: 10.1152/ajpheart.00234.2009. [DOI] [PMC free article] [PubMed] [Google Scholar]
- Basel-Vanagaite L, Muncher L, Straussberg R, Pasmanik-Chor M, Yahav M, Rainshtein L, Walsh CA, Magal N, Taub E, Drasinover V, Shalev H, Attia R, Rechavi G, Simon AJ, Shohat M. Mutated nup62 causes autosomal recessive infantile bilateral striatal necrosis. Ann Neurol. 2006;60:214–222. doi: 10.1002/ana.20902. [DOI] [PubMed] [Google Scholar]
- Bessiere D, Lacroix C, Campagne S, Ecochard V, Guillet V, Mourey L, Lopez F, Czaplicki J, Demange P, Milon A, Girard JP, Gervais V. Structure-function analysis of the THAP zinc finger of THAP1, a large C2CH DNA-binding module linked to Rb/E2F pathways. J Biol Chem. 2008;283:4352–4363. doi: 10.1074/jbc.M707537200. [DOI] [PubMed] [Google Scholar]
- Blanchard A, Ea V, Roubertie A, Martin M, Coquart C, Claustres M, Beroud C, Collod-Beroud G. DYT6 dystonia: review of the literature and creation of the UMD Locus-Specific Database (LSDB) for mutations in the THAP1 gene. Hum Mutat. 2011;32:1213–1224. doi: 10.1002/humu.21564. [DOI] [PubMed] [Google Scholar]
- Burek MJ, Oppenheim RW. Programmed cell death in the developing nervous system. Brain Pathol. 1996;6:427–446. doi: 10.1111/j.1750-3639.1996.tb00874.x. [DOI] [PubMed] [Google Scholar]
- Buss RR, Oppenheim RW. Role of programmed cell death in normal neuronal development and function. Anat Sci Int. 2004;79:191–197. doi: 10.1111/j.1447-073x.2004.00088.x. [DOI] [PubMed] [Google Scholar]
- Buss RR, Sun W, Oppenheim RW. Adaptive roles of programmed cell death during nervous system development. Annu Rev Neurosci. 2006;29:1–35. doi: 10.1146/annurev.neuro.29.051605.112800. [DOI] [PubMed] [Google Scholar]
- Campagne S, Saurel O, Gervais V, Milon A. Structural determinants of specific DNA-recognition by the THAP zinc finger. Nucleic Acids Res. 2010;38:3466–3476. doi: 10.1093/nar/gkq053. [DOI] [PMC free article] [PubMed] [Google Scholar]
- Carbon M, Eidelberg D. Abnormal structure-function relationships in hereditary dystonia. Neuroscience. 2009;164:220–229. doi: 10.1016/j.neuroscience.2008.12.041. [DOI] [PMC free article] [PubMed] [Google Scholar]
- Cayrol C, Lacroix C, Mathe C, Ecochard V, Ceribelli M, Loreau E, Lazar V, Dessen P, Mantovani R, Aguilar L, Girard JP. The THAP-zinc finger protein THAP1 regulates endothelial cell proliferation through modulation of pRB/E2F cell-cycle target genes. Blood. 2007;109:584–594. doi: 10.1182/blood-2006-03-012013. [DOI] [PubMed] [Google Scholar]
- Cilenti L, Balakrishnan MP, Wang XL, Ambivero C, Sterlicchi M, del Monte F, Ma XL, Zervos AS. Regulation of Abro1/KIAA0157 during myocardial infarction and cell death reveals a novel cardioprotective mechanism for Lys63-specific deubiquitination. J Mol Cell Cardiol. 2011;50:652–661. doi: 10.1016/j.yjmcc.2010.12.015. [DOI] [PMC free article] [PubMed] [Google Scholar]
- Fuchs T, Gavarini S, Saunders-Pullman R, Raymond D, Ehrlich ME, Bressman SB, Ozelius LJ. Mutations in the THAP1 gene are responsible for DYT6 primary torsion dystonia. Nat Genet. 2009;41:286–288. doi: 10.1038/ng.304. [DOI] [PubMed] [Google Scholar]
- Gavarini S, Cayrol C, Fuchs T, Lyons N, Ehrlich ME, Girard JP, Ozelius LJ. Direct interaction between causative genes of DYT1 and DYT6 primary dystonia. Ann Neurol. 2010;68:549–553. doi: 10.1002/ana.22138. [DOI] [PMC free article] [PubMed] [Google Scholar]
- Gau BH, Chu IM, Huang MC, Yang KT, Chiou SH, Fan YH, Chen MY, Lin JH, Chuang CK, Huang SY, Lee WC. Transcripts of enriched germ cells responding to heat shock as potential markers for porcine semen quality. Theriogenology. 2008;69:758–766. doi: 10.1016/j.theriogenology.2007.11.020. [DOI] [PubMed] [Google Scholar]
- Hayakawa Y, Itoh M, Yamada A, Mitsuda T, Nakagawa T. Expression and localization of Cayman ataxia-related protein, Caytaxin, is regulated in a developmental- and spatial-dependent manner. Brain Res. 2007;1129:100–109. doi: 10.1016/j.brainres.2006.10.068. [DOI] [PubMed] [Google Scholar]
- Herms J, Zurmohle U, Schlingensiepen R, Brysch W, Schlingensiepen KH. Developmental expression of the transcription factor zif268 in rat brain. Neurosci Lett. 1994;165:171–174. doi: 10.1016/0304-3940(94)90737-4. [DOI] [PubMed] [Google Scholar]
- Herrup K, Sunter K. Numerical matching during cerebellar development: quantitative analysis of granule cell death in staggerer mouse chimeras. J Neurosci. 1987;7:829–836. doi: 10.1523/JNEUROSCI.07-03-00829.1987. [DOI] [PMC free article] [PubMed] [Google Scholar]
- Hobert O. Regulation of terminal differentiation programs in the nervous system. Annu Rev Cell Dev Biol. 2011;27:681–696. doi: 10.1146/annurev-cellbio-092910-154226. [DOI] [PubMed] [Google Scholar]
- Kaiser FJ, Osmanoric A, Rakovic A, Erogullari A, Uflacker N, Braunholz D, Lohnau T, Orolicki S, Albrecht M, Gillessen-Kaesbach G, Klein C, Lohmann K. The dystonia gene DYT1 is repressed by the transcription factor THAP1 (DYT6) Ann Neurol. 2010;68:554–559. doi: 10.1002/ana.22157. [DOI] [PubMed] [Google Scholar]
- Koekkoek SK, Yamaguchi K, Milojkovic BA, Dortland BR, Ruigrok TJ, Maex R, De Graaf W, Smit AE, VanderWerf F, Bakker CE, Willemsen R, Ikeda T, Kakizawa S, Onodera K, Nelson DL, Mientjes E, Joosten M, De Schutter E, Oostra BA, Ito M, De Zeeuw CI. Deletion of FMR1 in Purkinje cells enhances parallel fiber LTD, enlarges spines, and attenuates cerebellar eyelid conditioning in Fragile X syndrome. Neuron. 2005;47:339–352. doi: 10.1016/j.neuron.2005.07.005. [DOI] [PubMed] [Google Scholar]
- LeDoux MS, Xiao J, Rudzińska M, Bastian RW, Wszolek ZK, Van Gerpen JA, Puschmann A, Momčilović D, Vemula SR, Zhao Y. Genotype-phenotype correlations in THAP1 dystonia: molecular foundations and description of new cases. Parkinsonism Relat Disord. 2012;18:414–425. doi: 10.1016/j.parkreldis.2012.02.001. [DOI] [PMC free article] [PubMed] [Google Scholar]
- Maciejewska B, Lipowska M, Kowianski P, Domaradzka-Pytel B, Morys J. Postnatal development of the rat striatum--a study using in situ DNA end labeling technique. Acta Neurobiol Exp (Wars) 1998;58:23–28. doi: 10.55782/ane-1998-1255. [DOI] [PubMed] [Google Scholar]
- Martins-de-Souza D, Guest PC, Mann DM, Roeber S, Rahmoune H, Bauder C, Kretzschmar H, Volk B, Baborie A, Bahn S. Proteomic analysis identifies dysfunction in cellular transport, energy, and protein metabolism in different brain regions of atypical frontotemporal lobar degeneration. J Proteome Res. 2012;11:2533–2543. doi: 10.1021/pr2012279. [DOI] [PubMed] [Google Scholar]
- Mazars R, Gonzalez-de-Peredo A, Cayrol C, Lavigne AC, Vogel JL, Ortega N, Lacroix C, Gautier V, Huet G, Ray A, Monsarrat B, Kristie TM, Girard JP. The THAP-zinc finger protein THAP1 associates with coactivator HCF-1 and O-GlcNAc transferase: a link between DYT6 and DYT3 dystonias. J Biol Chem. 2010;285:13364–13371. doi: 10.1074/jbc.M109.072579. [DOI] [PMC free article] [PubMed] [Google Scholar]
- Niethammer M, Carbon M, Argyelan M, Eidelberg D. Hereditary dystonia as a neurodevelopmental circuit disorder: Evidence from neuroimaging. Neurobiol Dis. 2011;42:202–209. doi: 10.1016/j.nbd.2010.10.010. [DOI] [PMC free article] [PubMed] [Google Scholar]
- Oppenheim RW, Houenou LJ, Johnson JE, Lin LF, Li L, Lo AC, Newsome AL, Prevette DM, Wang S. Developing motor neurons rescued from programmed and axotomy-induced cell death by GDNF. Nature. 1995;373:344–346. doi: 10.1038/373344a0. [DOI] [PubMed] [Google Scholar]
- Roussigne M, Cayrol C, Clouaire T, Amalric F, Girard JP. THAP1 is a nuclear proapoptotic factor that links prostate-apoptosis-response-4 (Par-4) to PML nuclear bodies. Oncogene. 2003;22:2432–2442. doi: 10.1038/sj.onc.1206271. [DOI] [PubMed] [Google Scholar]
- Rual JF, Venkatesan K, Hao T, Hirozane-Kishikawa T, Dricot A, Li N, Berriz GF, Gibbons FD, Dreze M, Ayivi-Guedehoussou N, Klitgord N, Simon C, Boxem M, Milstein S, Rosenberg J, Goldberg DS, Zhang LV, Wong SL, Franklin G, Li S, Albala JS, Lim J, Fraughton C, Llamosas E, Cevik S, Bex C, Lamesch P, Sikorski RS, Vandenhaute J, Zoghbi HY, Smolyar A, Bosak S, Sequerra R, Doucette-Stamm L, Cusick ME, Hill DE, Roth FP, Vidal M. Towards a proteome-scale map of the human protein-protein interaction network. Nature. 2005;437:1173–1178. doi: 10.1038/nature04209. [DOI] [PubMed] [Google Scholar]
- Sabogal A, Lyubimov AY, Corn JE, Berger JM, Rio DC. THAP proteins target specific DNA sites through bipartite recognition of adjacent major and minor grooves. Nat Struct Mol Biol. 2010;17:117–123. doi: 10.1038/nsmb.1742. [DOI] [PMC free article] [PubMed] [Google Scholar]
- Sako W, Morigaki R, Kaji R, Tooyama I, Okita S, Kitazato K, Nagahiro S, Graybiel AM, Goto S. Identification and localization of a neuron-specific isoform of TAF1 in rat brain: implications for neuropathology of DYT3 dystonia. Neuroscience. 2011;189:100–107. doi: 10.1016/j.neuroscience.2011.05.031. [DOI] [PMC free article] [PubMed] [Google Scholar]
- Sengel C, Gavarini S, Sharma N, Ozelius LJ, Bragg DC. Dimerization of the DYT6 dystonia protein, THAP1, requires residues within the coiled-coil domain. J Neurochem. 2011;118:1087–1100. doi: 10.1111/j.1471-4159.2011.07386.x. [DOI] [PMC free article] [PubMed] [Google Scholar]
- Stark GR, Darnell JE., Jr The JAK-STAT pathway at twenty. Immunity. 2012;36:503–514. doi: 10.1016/j.immuni.2012.03.013. [DOI] [PMC free article] [PubMed] [Google Scholar]
- Trollmann R, Rehrauer H, Schneider C, Krischke G, Huemmler N, Keller S, Rascher W, Gassmann M. Late-gestational systemic hypoxia leads to a similar early gene response in mouse placenta and developing brain. Am J Physiol Regul Integr Comp Physiol. 2010;299:R1489–1499. doi: 10.1152/ajpregu.00697.2009. [DOI] [PubMed] [Google Scholar]
- Wang L, Wang R, Herrup K. E2F1 works as a cell cycle suppressor in mature neurons. J Neurosci. 2007;27:12555–12564. doi: 10.1523/JNEUROSCI.3681-07.2007. [DOI] [PMC free article] [PubMed] [Google Scholar]
- Whiteside ST, Goodbourn S. Signal transduction and nuclear targeting: regulation of transcription factor activity by subcellular localisation. J Cell Sci. 1993;104 (Pt 4):949–955. doi: 10.1242/jcs.104.4.949. [DOI] [PubMed] [Google Scholar]
- Xiao J, Gong S, Zhao Y, LeDoux MS. Developmental expression of rat torsinA transcript and protein. Brain Res Dev Brain Res. 2004;152:47–60. doi: 10.1016/j.devbrainres.2004.05.012. [DOI] [PubMed] [Google Scholar]
- Xiao J, Zhao Y, Bastian RW, Perlmutter JS, Racette BA, Tabbal SD, Karimi M, Paniello RC, Wszolek ZK, Uitti RJ, Van Gerpen JA, Simon DK, Tarsy D, Hedera P, Truong DD, Frei KP, Dev Batish S, Blitzer A, Pfeiffer RF, Gong S, LeDoux MS. Novel THAP1 sequence variants in primary dystonia. Neurology. 2010;74:229–238. doi: 10.1212/WNL.0b013e3181ca00ca. [DOI] [PMC free article] [PubMed] [Google Scholar]
- Zhao Y, Sharma N, LeDoux MS. The DYT1 carrier state increases energy demand in the olivocerebellar network. Neuroscience. 2011;177:183–194. doi: 10.1016/j.neuroscience.2011.01.015. [DOI] [PMC free article] [PubMed] [Google Scholar]