

Abstract
This study tested the hypothesis that college students’ substance use problems would predict increases in skipping classes and declining academic performance, and that nonmedical use of prescription stimulants (NPS) for studying would occur in association with this decline. A cohort of 984 students in the College Life Study at a large public university in the US participated in a longitudinal prospective study. Interviewers assessed NPS; Diagnostic and Statistical Manual of Mental Disorders, Fourth Edition (DSM-IV) cannabis and alcohol use disorders; and frequency of skipping class. Semester grade point average (GPA) was obtained from the university. Control variables were race, sex, family income, high school GPA, and self-reported attention deficit hyperactivity disorder diagnosis. Longitudinal growth curve modeling of four annual data waves estimated the associations among the rates of change of cannabis use disorder, percentage of classes skipped, and semester GPA. The associations between these trajectories with NPS for studying was then evaluated. A second structural model substituted alcohol use disorder for cannabis use disorder. More than one-third (38%) reported NPS for studying at least once by Year 4. Increases in skipping class were associated with both alcohol and cannabis use disorder, which were associated with declining GPA. The hypothesized relationships between these trajectories and NPS for studying were confirmed. These longitudinal findings suggest that escalation of substance use problems during college is related to increases in skipping class and to declining academic performance. NPS for studying is associated with academic difficulties. Although additional research is needed to investigate causal pathways, these results suggest that nonmedical users of prescription stimulants could benefit from a comprehensive drug and alcohol assessment to possibly mitigate future academic declines.
Keywords: academic performance, alcohol, cannabis, college students, nonmedical use of prescription stimulants
1. Introduction
Nonmedical use of prescription stimulants (NPS),1 defined as use without one’s own legitimate prescription or using the drug in a way that is inconsistent with a doctor’s orders, is quite prevalent among college students (Arria et al., 2008b; Arria & DuPont, 2010; Arria, O'Grady, Caldeira, Vincent, & Wish, 2008c; Carroll, McLaughlin, & Blake, 2006; DeSantis, Webb, & Noar, 2008; Garnier-Dykstra, Caldeira, Vincent, O'Grady, & Arria, 2012; McCabe, West, & Wechsler, 2007), and is now the second most common form of illicit drug use after cannabis (Johnston, O'Malley, Bachman, & Schulenberg, 2012). An earlier report by our group observed that more college students initiated NPS between their freshman and sophomore year than any other drug (Arria et al., 2008a). Lifetime prevalence estimates of NPS vary, but are as high as 35% at some US universities (DeSantis et al., 2008; Low & Gendaszek, 2002).
While several cross-sectional research studies have found that nonmedical users of prescription stimulants tend to have lower grade point averages (GPA) than non-users (Clegg-Kraynok, McBean, & Montgomery-Downs, 2011; McCabe, Knight, Teter, & Wechsler, 2005; McCabe, Teter, & Boyd, 2006), media reports (Carey, 2008; Talbot, 2009) and some scientific commentaries (Greely et al., 2008; Maher, 2008) have debated the potential benefits of prescription stimulant use for individuals without attention deficit hyperactivity disorder (ADHD) to improve concentration and academic performance. Although these purported benefits have yet to be substantiated scientifically, research with college student samples has shown that the most frequently reported reason for NPS is to purportedly improve concentration so as to enhance academic performance (Clegg-Kraynok et al., 2011; DeSantis, Noar, & Webb, 2009; DeSantis, Noar, & Webb, 2010; DeSantis et al., 2008; Garnier-Dykstra et al., 2012; Low & Gendaszek, 2002; Rabiner et al., 2009; Teter, McCabe, Cranford, Boyd, & Guthrie, 2005; Teter, McCabe, LaGrange, Cranford, & Boyd, 2006; White, Becker-Blease, & Grace-Bishop, 2006). Yet the academic motives for NPS contrast with a pattern of other associated behaviors that would appear to impede nonmedical users’ of prescription stimulants academic performance, such as spending less time studying, skipping more classes, and spending more time socializing than their counterparts (Arria et al., 2008c).
Earlier cross-sectional studies have also consistently shown that nonmedical users of prescription stimulants have a history of heavy alcohol use and illicit drug involvement, particularly cannabis use (Arria et al., 2008b; DeSantis et al., 2009; McCabe et al., 2005; Teter, McCabe, Boyd, & Guthrie, 2003).McCabe et al. (2005) found that students who engaged in NPS were more than ten times more likely to use cannabis during the past year than non-users. Other correlates of NPS include demographic characteristics, with minorities being at lower risk than whites (DuPont, Coleman, Bucher, & Wilford, 2008; McCabe et al., 2005; McCabe et al., 2006; Teter et al., 2006). Although men are more likely to engage in NPS, there are no significant sex differences in the motivations for use (Low & Gendaszek, 2002; Teter et al., 2005). Fraternity/sorority membership and high levels of parental education are also significantly associated with NPS (McCabe et al., 2005).
The aim of the current study was to extend previous cross-sectional findings by using latent growth curve modeling to explicate the longitudinal relationships between cannabis/alcohol use disorder, skipping class, and academic performance. Furthermore, using this statistical modeling approach, we attempted to investigate the relationship between the various rates of change over time in cannabis/alcohol use disorder, skipping class, and GPA and NPS. We tested the following hypotheses: a) increases in cannabis use disorder predict increases in skipping class, which in turn predict decreases in academic performance as measured by a declining GPA; and b) NPS for study purposes occurs in association with these cannabis-related decreases in academic performance. Given that students who engage in NPS are likely to have alcohol-related problems, we also evaluated parallel models substituting alcohol use disorder for cannabis use disorder.
2. Methods
2.1. Study design
This study uses data from the College Life Study, a longitudinal prospective study of college students (Arria et al., 2008a; Vincent et al., 2012). Sample selection took place in two stages. First, a screening survey was administered to 3,401 incoming first-time, first-year students ages 17 to 19, during new-student orientation in 2004 at one large, public university in the mid-Atlantic region of the US. The first stage response rate was 89%. Next, a stratified random sample of screener participants was selected to participate in a longitudinal study, beginning with a two-hour baseline interview administered during their first year of college by a trained interviewer (Year 1: Y1). Purposive sampling strategies were employed to oversample students who had used an illicit drug or nonmedically used a prescription drug at least once prior to study entry. The second-stage response rate was 87%, and yielded a sample size of 1,253, which was representative of the first-year class with respect to race, sex, and socioeconomic status (Arria et al., 2008a). Similar interviews were administered annually. Participants received $5 and $50 for participating in the screener and each annual interview, respectively. The study was approved by the university IRB. Informed consent was obtained for participation in all data collection waves and a federal Certificate of Confidentiality was acquired.
2.2. Participants
Out of the original 1,253 participants, the present analytic sample consisted of the 984 (78.5%) individuals who were enrolled at the home university for at least one semester during all four years, completed at least one follow-up assessment (Y2 through Y4), and had non-missing data on all independent variables in the structural equation model (see section 2.4.). The remaining 269 individuals were excluded as follows: 185 with gaps in enrollment at the home university, 35 with no follow-up assessments, and 49 missing data on one or more independent variables. The inclusion sample was not significantly different from the excluded subset with respect to sex or family income, but was slightly younger and overly representative of whites.
2.3. Measures
2.3.1. NPS for studying
Annually, from Y1 through Y4, students were asked about their past-year NPS via items adapted from the National Survey on Drug Use and Health (NSDUH; Substance Abuse and Mental Health Services Administration, 2003). Participants were given show cards with drug names and color photos of various pills, including Ritalin,® Adderall,® Adderall XR,® Concerta,® and others. Methamphetamine and amphetamine use were excluded from this series of questions on NPS, but were assessed with separate questions. Interviewers explained that NPS involved taking any prescription stimulant “that was not prescribed for you or that you took only for the experience or feeling they caused,” excluding any over-the-counter medications.
Participants were asked the reasons they had for using each prescription stimulant, and interviewers later recoded the verbatim responses into categories, one of which was to “improve focus/study/work.” We operationalized our dichotomous dependent variable as any NPS to improve focus/study/work at any point from Y1 through Y4. Notably, NPS motives were not mutually exclusive; 24% of individuals in our “NPS for studying” group also reported motives related to partying or getting high. Because our hypotheses concerned academic difficulties that might be related to NPS, it was important that our outcome variable reflect use for study purposes. The small minority of individuals who engaged in NPS only for recreational reasons (i.e., to party or get high, but not for studying) were coded as “0” on the outcome variable. Henceforth, we use the term “NPS” to denote NPS for studying (regardless of other possible motives).
2.3.2. Cannabis use disorder
Annually, students who used cannabis five or more times during the past year were assessed for cannabis use disorder, using questions adapted from the NSDUH (Substance Abuse and Mental Health Services Administration, 2003). Items in this series correspond to the Diagnostic and Statistical Manual of Mental Disorders, Fourth Edition (DSM-IV) criteria (American Psychiatric Association, 1994) for past-year abuse and dependence. Dependence cases were defined by the endorsement of three or more of the following six criteria as a result of their cannabis use: tolerance, using more than intended, being unable to cut down, spending a lot of time obtaining or using, giving up important activities, or continuing to use despite problems with physical or mental health. Abuse cases were defined as non-dependent individuals who endorsed one or more of the following four problems resulting from their cannabis use: having serious problems at home, work, or school; regularly putting oneself in physical danger; repeatedly getting into trouble with the law; or continuing use despite problems with family or friends. A five-level “cannabis group” variable at Y1 and each of the subsequent three years was coded as follows: −1=no past-year use; 0=presumptive non-case (used<5 times in past year); 1=use without any endorsed problems; 2=diagnostic orphans (use with problems, but not enough to meet criteria for abuse or dependence); 3=abuse; 4=dependence.
2.3.3. Skipping class
Annually, students were asked about the number of class sessions they were scheduled to take per week and the number of class sessions they typically skipped per week. To standardize the measure of skipping behavior across course loads of varying intensity, the percent of classes skipped was computed [(number of sessions skipped/number of sessions scheduled)×100].
2.3.4. GPA
GPA data for each of eight semesters was culled from university administrative databases.
2.3.5. Other covariates
The following variables were used as covariates because of their potential association with GPA. Sex was coded by the interviewer at Y1. Race was self-reported and later dichotomized as white versus non-white. High school GPA was obtained from university data, as allowed by informed consent. Family income was approximated from the average adjusted gross income of their home ZIP code (MelissaDATA, 2003). Alcohol use disorder (abuse or dependence) was assessed annually via methods similar to those described above for cannabis and coded as a five-level “alcohol group” variable for each year. Self-reported ADHD diagnosis was a dichotomous variable based on responses to Y4 interview questions asking whether they were ever diagnosed with ADHD or took any prescribed medications for ADHD. No information was gathered regarding how the diagnosis was made or who made it.
2.4. Data analysis
A latent variable growth curve modeling (LVGCM; Duncan, Duncan, & Strycker, 2006) approach was taken to examine changes in substance use, skipping class, and GPA and their relationships to the dichotomous outcome variable NPS. LVGCM can be seen as a special form of structural equation modeling, in that it estimates changes in unmeasured or latent variables, in this case, growth trajectories—or rates of change over time—in a variable or variables that have been assessed on multiple occasions. Goals of LVGCM include estimation of the growth trajectory of the latent variable or variables, and determination of the relationships between the growth trajectories in two or more of the latent variables, as well as the ability of the growth trajectories to predict outcomes. An advantage of LVGCM is that this statistical method does not require complete data for all repeated measures to determine unbiased estimates of the model parameters. Nevertheless, an overwhelming majority of our sample (92%) had complete data for all four years. In the present study, the growth trajectories of three variables (substance use, skipping class, and GPA) were examined with the goal of determining whether the rate of change in substance use predicted the rate of change of skipping class, and whether, in turn, the rate of change in skipping class predicted the rate of change in GPA. Finally, the ability of these three rates of change to directly explain NPS was examined.
Latent growth models (Muthén, 2008) were estimated using Mplus 5.0 (Muthén & Muthén, 2007). First, growth models were developed to find the best-fitting individual longitudinal growth models for cannabis group, skipping class, and GPA, with the intercept term specified as the Y1 observation. The slope included all available measurement points: four for cannabis group (annual), four for skipping class (annual), and eight for GPA (each semester).
Three indicators of model fit were evaluated: the χ2 goodness-of-fit test, the Comparative Fit Index (CFI; Bentler, 1990), and the Root Mean Square Error of Approximation (RMSEA; Browne & Cudeck, 1993). Although non-significant χ2 values are typically considered indicative of good model fit, χ2 values are typically influenced by large sample sizes, thus, other indices should be considered (Kline, 2006). Generally, a value of 0.90 or greater on the CFI (Bentler, 1990) and a RMSEA value of <0.05 indicates good fit (0.05–0.08 acceptable fit and >0.10 poor fit).
Second, the path model that included the three individual growth trajectories and NPS was developed. Third, the path model in the previous step was run adjusting all paths for race, sex, high school GPA, family income, self-reported ADHD diagnosis, and the Y1 alcohol group variable. Paths were included from each intercept to their respective slopes for cannabis group, skipping class, and GPA. Fourth, the path model with covariates was pruned by dropping paths that were not statistically significant by conventional standards (p<0.05). Hypothesized predictor variables were retained in the model if they were significant at p<0.05.
Finally, the model was refit after substituting the alcohol group variables for the cannabis group variables, holding constant Y1 cannabis group and the same set of control variables as above.
3. Results
3.1. Sample characteristics
As shown in Table 1, almost equal proportions of males and females engaged in NPS. The majority of the NPS group were white (80.5%), and they were significantly more likely than non-users to have been diagnosed with ADHD by Y4 (12.8% vs. 6.2%) and to have met DSM-IV criteria for alcohol or cannabis use disorder at Y1 (40.4% vs. 18.5% for alcohol; 25.4% vs. 7.1% for cannabis). Family income was significantly higher for the NPS group ($78,600) than non-users ($71,400). There was considerable overlap between NPS and cannabis use: in any given year, the vast majority of nonmedical users of prescription stimulants were also cannabis users (89 to 92%, data not shown in table). Table 2 presents descriptive statistics for the three growth model variables (cannabis group, skipping class, and GPA).
Table 1.
Characteristics of the sample.
| Total (N=984) |
Nonmedical users of prescription stimulants for studying (n=374) |
Non-users (n=610) |
||||
|---|---|---|---|---|---|---|
| n | % | n | % | n | % | |
| Sex | ||||||
| Female | 513 | 52.1 | 178 | 47.6 | 335 | 54.9 |
| Male | 471 | 47.9 | 196 | 52.4 | 275 | 45.1 |
| Race | ||||||
| White | 733 | 74.5 | 301 | 80.5 | 432 | 70.8 |
| Non-white | 251 | 25.5 | 73 | 19.5 | 178 | 29.2 |
| Diagnosis of ADHDa | 86 | 8.7 | 48 | 12.8 | 38 | 6.2 |
| Alcohol use disorderb | 264 | 26.8 | 151 | 40.4 | 113 | 18.5 |
| Cannabis use disorderc | 138 | 14.4 | 95 | 25.4 | 43 | 7.1 |
| mean | sd | mean | sd | mean | sd | |
| High school GPAd | 3.89 | .40 | 3.85 | .40 | 3.91 | .39 |
| Family incomee | 74.1 | 34.0 | 78.6 | 34.5 | 71.4 | 33.5 |
Self-reported lifetime diagnosis of attention deficit hyperactivity disorder by Year 4.
Met DSM-IV criteria for abuse or dependence at Year 1.
Grade point average.
The mean adjusted gross income (AGI) reported by the Internal Revenue Service for each participant’s home ZIP code during their last year in high school, measured in ten thousands.
Note. Nonmedical users of prescription stimulants for studying differed significantly from non-users on every characteristic shown (p<.05).
Table 2.
Descriptive longitudinal results of the three variables for which trajectories were developed: cannabis group, skipping classes, and grade point average (N=984).
| Year 1 | Year 2 | Year 3 | Year 4 | |||||
|---|---|---|---|---|---|---|---|---|
| n | % | n | % | n | % | n | % | |
| Cannabis Groupa | ||||||||
| No past-year use | 359 | 37.4 | 357 | 38.3 | 376 | 39.4 | 419 | 44.0 |
| Low-frequency use (<5 days) | 214 | 22.3 | 157 | 16.8 | 140 | 14.7 | 134 | 14.1 |
| Non-problematic use (≥5 days) | 170 | 17.7 | 148 | 15.9 | 180 | 18.9 | 137 | 14.4 |
| Diagnostic orphanb | 80 | 8.3 | 87 | 9.3 | 62 | 6.5 | 84 | 8.8 |
| Abusec | 79 | 8.2 | 108 | 11.6 | 117 | 12.3 | 123 | 12.9 |
| Dependenced | 59 | 6.1 | 76 | 8.1 | 79 | 8.3 | 56 | 5.9 |
| Total | 961 | 100.0 | 933 | 100.0 | 954 | 100.0 | 953 | 100.0 |
| mean | sd | mean | sd | mean | sd | mean | sd | |
| Percent of classes skipped | 9.6 | 12.4 | 13.3 | 16.5 | 11.2 | 16.5 | 12.5 | 20.5 |
| Semester GPAe | ||||||||
| Fall Semester | 3.14 | 0.63 | 3.16 | 0.65 | 3.23 | 0.64 | 3.33 | 0.63 |
| Spring Semester | 3.12 | 0.65 | 3.24 | 0.63 | 3.24 | 0.66 | 3.34 | 0.65 |
Results do not sum to 984 individuals due to missing data, which varied for each assessment year.
Cannabis use with problems, but not enough to meet criteria for abuse or dependence.
Abuse cases were defined as non-dependent individuals who endorsed one or more of the following four problems resulting from their cannabis use: having serious problems at home, work, or school; regularly putting oneself in physical danger; repeatedly getting into trouble with the law; or continuing use despite problems with family or friends.
Dependence cases were defined by the endorsement of three or more of the following six criteria as a result of their cannabis use: tolerance; using more than intended; being unable to cut down; spending a lot of time obtaining or using; giving up important activities; or continuing to use despite problems with physical or mental health.
Grade point average.
3.2. Prevalence of NPS
By Y4, 374 individuals (38.0% of the sample) had engaged in NPS for studying at least once.
3.3. Growth models for each predictor
For the cannabis group, alcohol group, and GPA variables, the model fit was acceptable for the linear models of the individual constructs, and the addition of a quadratic term provided only trivial improvements in model fit, as evidenced by very small increases in CFI (<0.02). Therefore, the linear models were used, with the following fit statistics: χ2(5)=108.375, p<0.0001, CFI=0.962, and RMSEA=0.141 for cannabis group; χ2(5)=16.41, p=0.0058, CFI=0.99, and RMSEA=0.047 for alcohol group; and χ2(31)=186.080, p<0.0001, CFI=0.967, and RMSEA=0.070 for GPA. For the skipping class construct, the addition of a quadratic term improved the model more substantially, as evidenced by the CFI increasing by more than 0.05, and was therefore retained [χ2(1)=20.187, p<0.0001, CFI=0.960, and RMSEA=0.136]. However, in subsequent analyses of the path model including cannabis group and GPA, the quadratic term for skipping class was not informative and was therefore omitted.
3.4. Path model
The model fit was good for the path model that included the linear growth models for cannabis group and GPA and the quadratic growth model for skipping class, as predictors of NPS [χ2(37)=146.255, p<0.0001, CFI=0.942, and RMSEA=0.053].
3.5. Path model with covariates
The latent growth model after covariates were added and the model was pruned had acceptable fit statistics [χ2(72)=206.945, p<0.001, CFI=0.953, and RMSEA=0.044]. Models with alternate pathways from cannabis group to NPS did not converge or fit the data as well.
3.5.1. Associations between cannabis use disorder, skipping class, GPA, and NPS
Figure 1 shows the associations between constructs and pathways to NPS. There was an association between Y1 cannabis group and Y1 skipping class (p<0.001) as well as from the trajectory of cannabis group to the trajectory of skipping class (p=0.001). There were inverse associations between Y1 skipping class and Y1 GPA (p<0.001) and the trajectories of skipping class and GPA (p<0.001). As hypothesized, Y1 cannabis group (p<0.001), GPA (p=0.001), and skipping class (p=0.005) were associated with NPS. The trajectory of cannabis group was also associated with NPS (p<0.001), as was the trajectory for GPA (p=0.017).
Figure 1.
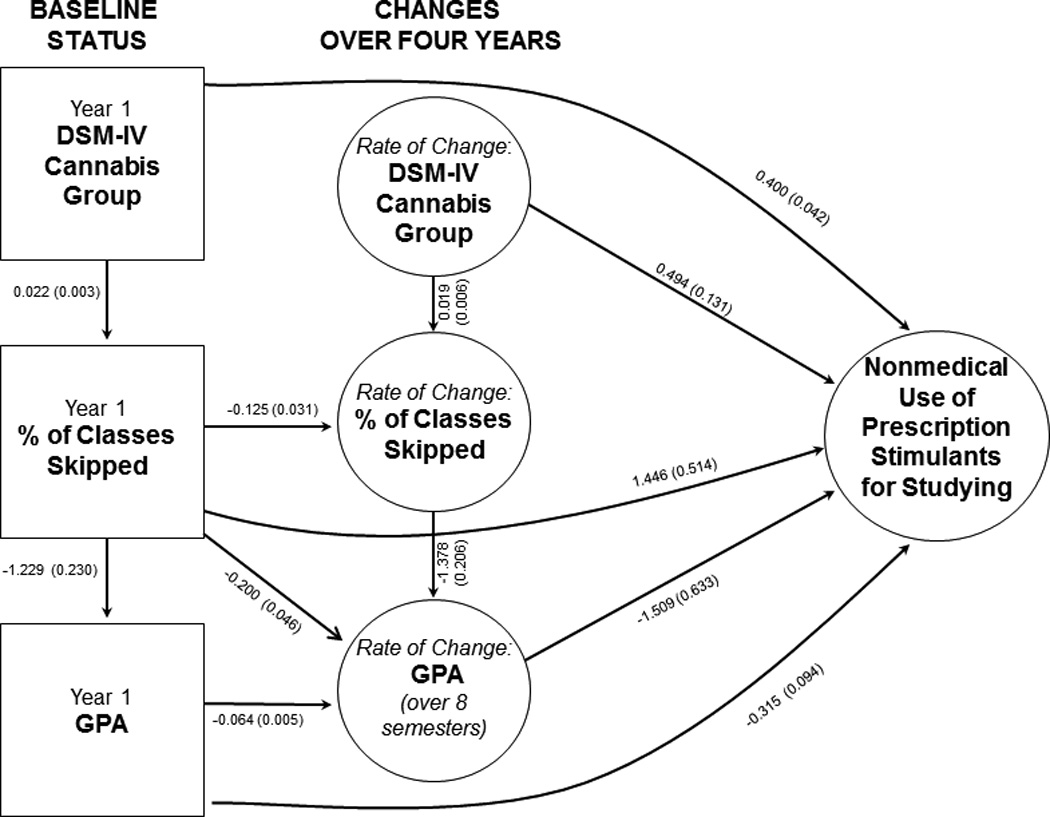
Structural equation model depicting the relationship between DSM-IV cannabis group, skipping class, grade point average, and nonmedical use of prescription stimulants for studying.
Note. Results depicted as b(se). Model was adjusted for race, sex, high school GPA, family income, self-reported ADHD diagnosis, and DSM-IV alcohol group at Year 1. Effects depicted as arrows are all statistically significant (p<.05).
3.5.2. Indirect pathways to NPS in the cannabis model
In addition to the direct effects shown in Figure 1, all five specific indirect pathways from Y1 cannabis group to NPS were significant (all ps<0.05), as was the total indirect effect from Y1 cannabis group to NPS [b=0.037 (se=0.012); p=0.003]. With respect to cannabis group trajectory, there was only one indirect pathway to NPS (i.e., through skipping class trajectory and GPA trajectory), and this effect approached but did not attain statistical significance [b=0.040 (se=0.022); p=0.069]. Together, these results support the hypothesized associations between cannabis use disorder, academic performance difficulties, and NPS. All the remaining indirect paths in the model were significant (all ps<0.05).
3.5.3. Alternative alcohol model
When the cannabis group variables were replaced with the corresponding alcohol group variables (and Y1 cannabis group was held constant), many of the hypothesized pathways from Y1 alcohol group and alcohol group trajectory to NPS were also confirmed (see Figure 2), with two notable exceptions. First, one additional significant path from Y1 alcohol group to alcohol group trajectory was retained (p<0.001). Second, the path from Y1 skipping class to skipping trajectory became non-significant and was therefore dropped. The overall model fit was good [χ2(85)=230.089, p<0.0001, CFI=0.957, and RMSEA=0.042].
Figure 2.
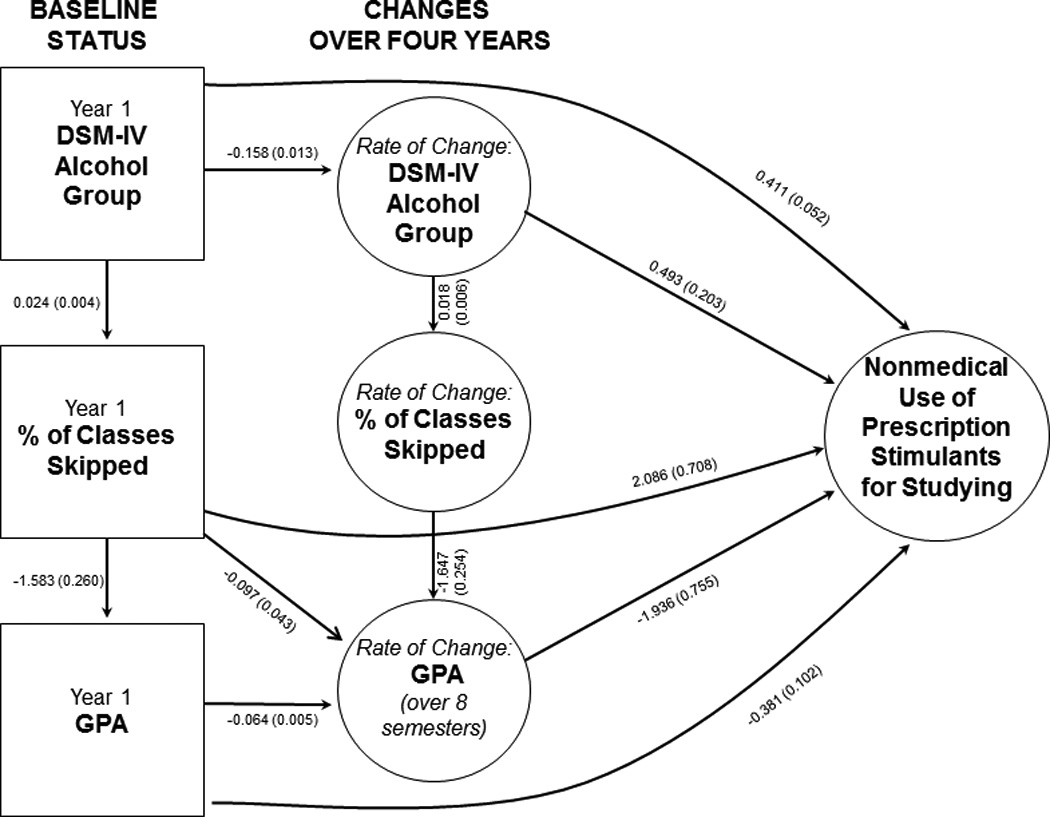
Structural equation model depicting the relationship between DSM-IV alcohol group, skipping class, grade point average, and nonmedical use of prescription stimulants for studying.
Note. Results depicted as b(se). Model was adjusted for race, sex, high school GPA, family income, self-reported ADHD diagnosis, and DSM-IV cannabis group at Year 1. Effects depicted as solid arrows are all statistically significant (p<.05).
3.5.4. Indirect pathways to NPS in the alcohol model
Four of the five indirect pathways from Y1 alcohol group to NPS were significant, but unlike in the cannabis model, the pathway from Y1 alcohol group to Y1 skipping class to GPA trajectory to NPS did not attain statistical significance (p=0.119). Notably, the indirect pathway from alcohol group trajectory to skipping class trajectory to GPA trajectory to NPS was significant [b=0.058 (se=0.029); p=0.048], whereas the corresponding pathway in the cannabis model only approached significance (see above). All other indirect pathways in the alcohol model were significant (all ps<0.05).
3.5.5. Indirect pathways from cannabis/alcohol group to GPA
Although there was no direct effect of cannabis/alcohol group on GPA in either model, we evaluated the indirect effects of cannabis/alcohol group on GPA via skipping class. As hypothesized, the indirect pathway from cannabis group trajectory to skipping trajectory to GPA trajectory was statistically significant [b=−0.019 (SE=0.007); p=0.003], as was the corresponding indirect pathway in the alcohol model [b=−0.030 (SE=0.010); p=0.002].
4. Discussion
Despite evidence that substance use tends to increase during adolescence and peak by age 18 (Kandel & Logan, 1984; Kosterman, Hawkins, Guo, Catalano, & Abbott, 2000), college students are still at risk for illicit drug use (Sessa, 2005). A majority of college students are exposed to and given the opportunity to try illicit drugs early in their college career (Arria et al., 2008a). Unfortunately, few studies have examined the consequences associated with illicit drug use among college students. This longitudinal study of college students provides strong evidence that as cannabis and alcohol use problems escalated, students experienced related increases in skipping class and decreases in GPA. To our knowledge, this is the first study providing longitudinal evidence for a chain of events linking substance use with academic problems via skipping class. Moreover, the model results suggested that college students who experience this chain of events have a higher likelihood of using prescription stimulants nonmedically for study purposes.
Our finding of significant indirect paths between alcohol and cannabis use disorders, skipping class, and decreased GPA comports with prior research demonstrating an association between heavy drinking and lowered GPA among college students (Gliksman, Newton-Taylor, Adlaf, & Giesbrecht, 1997; Pascarella et al., 2007; Singleton, 2007; Wolaver, 2002). Paschall and Freisthler (2003) observed an attenuation of the significance of the relationship when adjusting for covariates such as high school GPA and demographic characteristics. However, the association between illicit drug use and academic problems among college students is less well characterized.Hunt et al. (2010) observed that cannabis use disorder was significantly associated with failure to complete college. The present findings highlight skipping class and declining GPA as possible mechanisms by which cannabis use disorder might interfere with college completion, but more research is needed to understand the contribution of drug use to important outcomes like college graduation. Because of the high prevalence of cannabis use among college students (Johnston, O'Malley, Bachman, & Schulenberg, 2010) and its known association with short-term memory deficits and concentration difficulties (Ashton, 2001; Tennant & Groesbeck, 1972), more research is warranted on the possible association between cannabis and academic outcomes, including college GPA and retention.
Several limitations of the study should be noted. First, although academic data were derived from administrative datasets, our findings rely heavily on self-reported data on illicit drug use, and while we have no indication that underreporting occurred, the possibility of social desirability bias cannot be ruled out. Second, because all participants were sampled from one university, results may not be generalizable to institutions located in other regions of the country or smaller private colleges. Third, our models did not take into account other possible constructs that might influence GPA, such as academic major or course difficulty level. Fourth, the variable for skipping class was operationalized as “percentage of classes skipped” and was highly skewed with many zeros. Fifth, we investigated NPS for studying sometime during college as a single outcome variable. Our data should not be interpreted to provide causal evidence of a relationship between declining academic performance and NPS. Future studies should utilize larger samples to understand the possible causal pathways and disentangle the temporal association between academic performance difficulties and NPS. Because NPS was typically infrequent in this sample (Arria et al., 2008b), we dichotomized it (use/non-use) and therefore cannot speculate as to a possible dose-response relationship between substance-related academic problems and NPS frequency. Future studies should address whether more frequent NPS, although rare, is associated with more severe academic problems and perhaps precipitous declines in GPA. Finally, prescription stimulants are nonmedically used for a variety of motives, albeit most commonly for study purposes among college students (Garnier-Dykstra et al., 2012). The overwhelming majority of our sample engaged in NPS for this purpose, so our sample size did not allow for meaningful comparisons between individuals who used NPS for study purposes with individuals who used NPS solely for recreational purposes. Future longitudinal studies should investigate the predictors of use for different motives.
Despite these limitations, this study demonstrated that even infrequent NPS was associated with a chain of underlying events—that is cannabis use, skipping class, and decreased GPA. The study findings suggest that individuals who engage in NPS, even infrequently, might benefit from a comprehensive evaluation of the reasons underlying their academic difficulties, including a confidential assessment of heavy alcohol consumption and illicit drug use involvement. While such an evaluation might seem difficult to implement given limited resources, it is possible that such assessments could be provided by personnel within existing academic assistance centers and perhaps by academic advisors themselves. Such a strategy would not be cost-prohibitive because it would only involve training existing personnel, but might be beneficial for recognizing and addressing the early stages of drug problems and thereby prevent the eventual development of more severe academic problems or dismissal. Certainly, college should be seen as a unique opportunity for this kind of early intervention. By capitalizing on the individual’s motivation to succeed, an academic advisor might be able to reveal how the student’s substance use might be interfering with their achievement of academic and career goals.
Rather than a group preoccupied with achieving academically, the general picture that emerges is that students who engage in NPS for study purposes appear to be struggling academically, perhaps as a result of their heavy drinking and other drug involvement. For these students, the likely motive underlying their NPS is to help them stay afloat academically, rather than gaining an extra edge. It is also possible that students who have a fairly good GPA who engage in NPS do so to help them study for exams or work on projects that they put off until the last minute because of their drinking, other drug use, and time spent socializing. For them, NPS might be a way of maintaining their current GPAs, and perhaps not to make up for poor grades or gain an academic edge. Whether or not NPS—even if preceded by substance use problems and skipping class—is associated with subsequent improvement in academic performance or maintenance of a certain GPA remains to be seen. Although we did control for high school GPA, our longitudinal growth curve model approach did not allow for the simultaneous examination of college GPA as both a risk factor and an outcome.
Parents may be another target group for indicated prevention efforts. Anecdotally, many of our students who engage in NPS have openly disclosed this information to their parents. Some students have reported that their parents have either facilitated or encouraged them to continue using prescription stimulants nonmedically if the student believes it might help them manage their academic workload. What is probably not revealed to parents by students is the frequency of their own cannabis and alcohol use and the extent to which they skip class. Therefore, the information from this study could be useful for parents who might be naively condoning or facilitating NPS because they have the best of intentions for their college-age child as well as being financially invested in their success. Parents should have conversations about the context in which NPS is occurring. Parents can and should facilitate early intervention efforts to address an early drug problem that might be compromising academic success.
This study focused on a small but important piece of the overall picture of the relationship between drug use and academic performance. Future research is encouraged to more fully explain the possible contribution of illicit drug use to declining academic performance in college and, in particular, the relationship to interruptions in college enrollment and possible college dropout. While this study focused on class attendance as an intermediary between substance use and academic outcomes, future studies should examine the possible role of other factors such as sleep (Gaultney, 2010) and study hours (Williams, Powell, & Wechsler, 2003). This line of research could have critical importance for improving college retention among young adults in the US.
Acknowledgements
Special thanks are given to Gillian Pinchevsky, Emily Winick, Rebecca Baron, the interviewing team, and the participants.
Footnotes
Abbreviations: NPS=nonmedical use of prescription stimulants; GPA=grade point average; ADHD=attention deficit hyperactivity disorder; Y1=Year 1; IRB=Institutional Review Board; NSDUH=National Survey on Drug Use and Health; DSM-IV=Diagnostic and Statistical Manual of Mental Disorders, Fourth Edition; LVGCM=latent variable growth curve modeling; CFI=Comparative Fit Index; RMSEA=Root Mean Square Error of Approximation
Contributor Information
Amelia M. Arria, Email: aarria@umd.edu.
Holly C. Wilcox, Email: hwilcox1@jhmi.edu.
Kimberly M. Caldeira, Email: caldeira@umd.edu.
Kathryn B. Vincent, Email: kvincent@umd.edu.
Laura M. Garnier-Dykstra, Email: ldykstra@umd.edu.
Kevin E. O'Grady, Email: ogrady@umd.edu.
References
- American Psychiatric Association. Diagnostic and Statistical Manual of Mental Disorders: DSM-IV. 4th ed. Washington, DC: American Psychiatric Press; 1994. [Google Scholar]
- Arria AM, Caldeira KM, O'Grady KE, Vincent KB, Fitzelle DB, Johnson EP, Wish ED. Drug exposure opportunities and use patterns among college students: Results of a longitudinal prospective cohort study. Subst Abus. 2008a;29(4):19–38. doi: 10.1080/08897070802418451. [DOI] [PMC free article] [PubMed] [Google Scholar]
- Arria AM, Caldeira KM, O'Grady KE, Vincent KB, Johnson EP, Wish ED. Nonmedical use of prescription stimulants among college students: Associations with attention-deficit-hyperactivity disorder and polydrug use. Pharmacotherapy. 2008b;28(2):156–169. doi: 10.1592/phco.28.2.156. [DOI] [PMC free article] [PubMed] [Google Scholar]
- Arria AM, DuPont RL. Nonmedical prescription stimulant use among college students: Why we need to do something and what we need to do. J Addict Dis. 2010;29(4):417–426. doi: 10.1080/10550887.2010.509273. [DOI] [PMC free article] [PubMed] [Google Scholar]
- Arria AM, O'Grady KE, Caldeira KM, Vincent KB, Wish ED. Nonmedical use of prescription stimulants and analgesics: Associations with social and academic behaviors among college students. J Drug Issues. 2008c;38(4):1045–1060. doi: 10.1177/002204260803800406. [DOI] [PMC free article] [PubMed] [Google Scholar]
- Ashton CH. Pharmacology and effects of cannabis: A brief review. Br J Psychiatry. 2001;178:101–106. doi: 10.1192/bjp.178.2.101. [DOI] [PubMed] [Google Scholar]
- Bentler PM. Comparative fit indexes in structural models. Psychol Bull. 1990;107(2):238–246. doi: 10.1037/0033-2909.107.2.238. [DOI] [PubMed] [Google Scholar]
- Browne MW, Cudeck R. Alternative ways of assessing model fit. In: Bollen KA, Long JS, editors. Testing structural equation models. Beverly Hills, CA: Sage; 1993. pp. 136–162. [Google Scholar]
- Carey B. Brain enhancement is wrong, right? New York Times. 2008 Mar 9;:1. [Google Scholar]
- Carroll BC, McLaughlin TJ, Blake DR. Patterns and knowledge of nonmedical use of stimulants among college students. Arch Pediatr Adolesc Med. 2006;160(5):481–485. doi: 10.1001/archpedi.160.5.481. [DOI] [PubMed] [Google Scholar]
- Clegg-Kraynok MM, McBean AL, Montgomery-Downs HE. Sleep quality and characteristics of college students who use prescription psychostimulants nonmedically. Sleep Med. 2011;12(6):598–602. doi: 10.1016/j.sleep.2011.01.012. [DOI] [PubMed] [Google Scholar]
- DeSantis A, Noar SM, Webb E. Nonmedical ADHD stimulant use in fraternities. J Stud Alcohol Drugs. 2009;70(6):952–954. doi: 10.15288/jsad.2009.70.952. [DOI] [PubMed] [Google Scholar]
- DeSantis A, Noar SM, Webb EM. Speeding through the frat house: A qualitative exploration of nonmedical ADHD stimulant use in fraternities. J Drug Educ. 2010;40(2):157–171. doi: 10.2190/DE.40.2.d. [DOI] [PubMed] [Google Scholar]
- DeSantis AD, Webb EM, Noar SM. Illicit use of prescription ADHD medications on a college campus: A multimethological approach. J Am Coll Health. 2008;57(3):315–323. doi: 10.3200/JACH.57.3.315-324. [DOI] [PubMed] [Google Scholar]
- Duncan TE, Duncan SC, Strycker LA. An introduction to latent variable growth curve modeling: Concepts, issues, and applications. 2nd ed. Mahwah, NJ: Lawrence Erlbaum Associates Publishers; 2006. [Google Scholar]
- DuPont RL, Coleman JJ, Bucher RH, Wilford BB. Characteristics and motives of college students who engage in nonmedical use of methylphenidate. Am J Addict. 2008;17(3):167–171. doi: 10.1080/10550490802019642. [DOI] [PubMed] [Google Scholar]
- Garnier-Dykstra LM, Caldeira KM, Vincent KB, O'Grady KE, Arria AM. Nonmedical use of prescription stimulants during college: Four-year trends in exposure opportunity, use, motives, and sources. J Am Coll Health. 2012;60(3):226–234. doi: 10.1080/07448481.2011.589876. [DOI] [PMC free article] [PubMed] [Google Scholar]
- Gaultney JF. The prevalence of sleep disorders in college students: Impact on academic performance. J Am Coll Health. 2010;59(2):91–97. doi: 10.1080/07448481.2010.483708. [DOI] [PubMed] [Google Scholar]
- Gliksman L, Newton-Taylor B, Adlaf E, Giesbrecht N. Alcohol and other drug use by Ontario university students: The roles of gender, age, year of study, academic grades, place of residence and programme of study. Drugs: Education, Prevention, and Policy. 1997;4(2):117–129. [Google Scholar]
- Greely H, Sahakian B, Harris J, Kessler RC, Gazzaniga M, Campbell P, Farah MJ. Towards responsible use of cognitive-enhancing drugs by the healthy. Nature. 2008;456(7223):702–705. doi: 10.1038/456702a. [DOI] [PubMed] [Google Scholar]
- Hunt J, Eisenberg D, Kilbourne AM. Consequences of receipt of a psychiatric diagnosis for completion of college. Psychiatr Serv. 2010;61(4):399–404. doi: 10.1176/ps.2010.61.4.399. [DOI] [PubMed] [Google Scholar]
- Johnston LD, O'Malley PM, Bachman JG, Schulenberg JE. Monitoring the Future: National survey results on drug use, 1975–2009 Volume II: College students and adults ages 19–50. Bethesda, MD: National Institute on Drug Abuse; 2010. [Google Scholar]
- Johnston LD, O'Malley PM, Bachman JG, Schulenberg JE. Monitoring the Future: National survey results on drug use, 1975–2011. Volume II: College students and adults ages 19–50. Ann Arbor: Institute for Social Research, The University of Michigan; 2012. [Google Scholar]
- Kandel DB, Logan JA. Patterns of drug use from adolescence to young adulthood: I. Periods of risk for initiation, continued use, and discontinuation. Am J Public Health. 1984;74(7):660–666. doi: 10.2105/ajph.74.7.660. [DOI] [PMC free article] [PubMed] [Google Scholar]
- Kline RB. Principles and practices of structural equation modeling. 2nd ed. New York, NY: The Guilford Press; 2006. [Google Scholar]
- Kosterman R, Hawkins JD, Guo J, Catalano RF, Abbott RD. The dynamics of alcohol and marijuana initiation: Patterns and predictors of first use in adolescence. Am J Public Health. 2000;90(3):360–366. doi: 10.2105/ajph.90.3.360. [DOI] [PMC free article] [PubMed] [Google Scholar]
- Low KG, Gendaszek AE. Illicit use of psychostimulants among college students: A preliminary study. Psychol Health Med. 2002;7(3):283–287. [Google Scholar]
- Maher B. Poll results: Look who's doping. Nature. 2008;452(7188):674–675. doi: 10.1038/452674a. [DOI] [PubMed] [Google Scholar]
- McCabe SE, Knight JR, Teter CJ, Wechsler H. Non-medical use of prescription stimulants among US college students: Prevalence and correlates from a national survey. Addiction. 2005;99(1):96–106. doi: 10.1111/j.1360-0443.2005.00944.x. [DOI] [PubMed] [Google Scholar]
- McCabe SE, Teter CJ, Boyd CJ. Medical use, illicit use and diversion of prescription stimulant medication. J Psychoactive Drugs. 2006;38(1):43–56. doi: 10.1080/02791072.2006.10399827. [DOI] [PMC free article] [PubMed] [Google Scholar]
- McCabe SE, West BT, Wechsler H. Trends and college-level characteristics associated with the non-medical use of prescription drugs among US college students from 1993 to 2001. Addiction. 2007;102(3):455–465. doi: 10.1111/j.1360-0443.2006.01733.x. [DOI] [PMC free article] [PubMed] [Google Scholar]
- MelissaDATA. Income tax statistics lookup. 2003 Retrieved May 28, 2008, from http://www.melissadata.com/lookups/taxzip.asp.
- Muthén BO. Latent variable hybrids: Overview of old and new models. In: Hancock GR, Samuelsen KM, editors. Advances in latent variable mixture models. Charlotte, NC: Information Age Publishing; 2008. pp. 1–24. [Google Scholar]
- Muthén LK, Muthén BO. Mplus: User's guide. Fifth ed. Los Angeles, CA: Muthén & Muthén; 2007. [Google Scholar]
- Pascarella ET, Tagliapietra-Nicoli G, Goodman KM, Park S, Seifert TA, Whitt EJ. College student binge drinking and academic achievement: A longitudinal replication and extension. J Coll Stud Dev. 2007;48(6):715–727. [Google Scholar]
- Paschall MJ, Freisthler B. Does heavy drinking affect academic performance in college? Findings from a prospective study of high achievers. J Stud Alcohol. 2003;64(4):515–519. doi: 10.15288/jsa.2003.64.515. [DOI] [PubMed] [Google Scholar]
- Rabiner DL, Anastopoulos AD, Costello EJ, Hoyle RH, McCabe SE, Swartzwelder HS. Motives and perceived consequences of nonmedical ADHD medication use by college students: Are students treating themselves for attention problems? J Atten Disord. 2009;13(3):259–270. doi: 10.1177/1087054708320399. [DOI] [PubMed] [Google Scholar]
- Sessa FM. The influence of perceived parenting on substance use during the transition to college: A comparison of male residential and commuter students. J Coll Stud Dev. 2005;46(1):62–74. [Google Scholar]
- Singleton RA. Collegiate alcohol consumption and academic performance. J Stud Alcohol Drugs. 2007;68(4):548–555. doi: 10.15288/jsad.2007.68.548. [DOI] [PubMed] [Google Scholar]
- Substance Abuse and Mental Health Services Administration. 2002 National Survey on Drug Use and Health Questionnaire. Rockville, MD: Office of Applied Studies; 2003. [Google Scholar]
- Talbot M. Brain gain: The underground world of "neuroenhancing" drugs. The New Yorker. 2009 Apr 27; [PubMed] [Google Scholar]
- Tennant FS, Jr, Groesbeck CJ. Psychiatric effects of hashish. Arch Gen Psychiatry. 1972;27(1):133–136. doi: 10.1001/archpsyc.1972.01750250117016. [DOI] [PubMed] [Google Scholar]
- Teter CJ, McCabe SE, Boyd CJ, Guthrie SK. Illicit methylphenidate use in an undergraduate student sample: Prevalence and risk factors. Pharmacotherapy. 2003;23(5):609–617. doi: 10.1592/phco.23.5.609.34187. [DOI] [PubMed] [Google Scholar]
- Teter CJ, McCabe SE, Cranford JA, Boyd CJ, Guthrie SK. Prevalence and motives for illicit use of prescription stimulants in an undergraduate student sample. J Am Coll Health. 2005;53(6):253–262. doi: 10.3200/JACH.53.6.253-262. [DOI] [PubMed] [Google Scholar]
- Teter CJ, McCabe SE, LaGrange K, Cranford JA, Boyd CJ. Illicit use of specific prescription stimulants among college students: Prevalence, motives, and routes of administration. Pharmacotherapy. 2006;26(10):1501–1510. doi: 10.1592/phco.26.10.1501. [DOI] [PMC free article] [PubMed] [Google Scholar]
- Vincent KB, Kasperski SJ, Caldeira KM, Garnier-Dykstra LM, Pinchevsky GM, O'Grady KE, Arria AM. Maintaining superior follow-up rates in a longitudinal study: Experiences from the College Life Study. Int J Mult Res Approach. 2012;6(1):56–72. doi: 10.5172/mra.2012.6.1.56. [DOI] [PMC free article] [PubMed] [Google Scholar]
- White BP, Becker-Blease KA, Grace-Bishop K. Stimulant medication use misuse, and abuse in an undergraduate and graduate student sample. J Am Coll Health. 2006;54(5):261–268. doi: 10.3200/JACH.54.5.261-268. [DOI] [PubMed] [Google Scholar]
- Williams J, Powell LM, Wechsler H. Does alcohol consumption reduce human capital accumulation? Evidence from the College Alcohol Study. Appl Econ. 2003;35(10):1227–1239. [Google Scholar]
- Wolaver AM. Effects of heavy drinking in college on study effort, grade point average, and major choice. Contemp Econ Policy. 2002;20(4):415–428. [Google Scholar]