

Abstract
Chronic exercise training results in numerous skeletal muscle adaptations, including increases in insulin sensitivity and glycogen content. To understand the mechanism for increased muscle glycogen, we studied the effects of exercise training on glycogen regulatory proteins in rat skeletal muscle. Female Sprague Dawley rats performed voluntary wheel running for 1, 4, or 7 weeks. After 7 weeks of training, insulin-stimulated glucose uptake was increased in epitrochlearis muscle. Compared to sedentary control rats, muscle glycogen did not change after 1 week of training, but increased significantly after 4 and 7 weeks. The increases in muscle glycogen were accompanied by elevated glycogen synthase activity and protein expression. To assess the regulation of glycogen synthase, we examined its major activator, protein phosphatase 1 (PP1), and its major deactivator, glycogen synthase kinase 3 (GSK3). Consistent with glycogen synthase activity, PP1 activity was unchanged after 1 week of training but significantly increased after 4 and 7 weeks of training. Protein expression of RGL(GM), another regulatory PP1 subunit, significantly decreased after 4 and 7 weeks of training. Unlike PP1, GSK3 phosphorylation did not follow the pattern of glycogen synthase activity. The ~40% decrease in GSK-3α phosphorylation after 1 week of exercise training persisted until 7 weeks and may function as a negative feedback to elevated glycogen. Our findings suggest that exercise training-induced increases in muscle glycogen content could be regulated by multiple mechanisms including enhanced insulin sensitivity, glycogen synthase expression, allosteric activation of glycogen synthase and PP1activity.
Keywords: exercise, skeletal muscle, glycogen synthase, GSK-3, rat
INTRODUCTION
Glycogen is a major fuel source in contracting skeletal muscles. With prolonged or high intensity exercise, muscle glycogen stores become depleted, and assuming adequate ingestion of carbohydrates, glycogen stores are rapidly replenished during the post-exercise recovery period. In addition to the acute regulation of glycogen concentrations by exercise, skeletal muscles adapt to different metabolic conditions by altering glycogen levels. For example, in people with type 2 diabetes, skeletal muscle insulin resistance is associated with lower muscle glycogen concentrations due to impaired glucose transport and glycogen synthesis [1]. On the other hand, exercise training can result in robust increases in muscle glycogen content [2].
Skeletal muscle glycogen synthesis is thought to be dependent on the rate of glucose uptake into the muscle cell [3]and on glycogen synthase activity [4]. Insulin and contraction, working through distinct signaling mechanisms, increase muscle glucose uptake by regulating glucose transporter type 4 (GLUT4) translocation from intracellular compartments to the sarcolemma and t-tubules, and there is also evidence for regulation by hexokinase II-mediated phosphorylation of glucose to glucose 6-phosphate (G6P) [5, 6]. Furthermore, repeated bouts of exercise (exercise training) lead to adaptations that result in increases in both GLUT4 and hexokinase II protein expression in muscle [5, 7, 8]. For the glycogen synthesis, G6P undergoes several enzymatic reactions to be converted to UDP-glucose, the immediate precursor to glycogen. Glycogen synthase, the rate limiting enzyme for skeletal muscle glycogen synthesis, then transforms UDP glucose into glycogen. The regulation of glycogen synthase is complex and occurs through the phosphorylation-dephosphorylation of at least nine different phosphorylation sites. Both insulin and contraction increase glycogen synthase activity through dephosphorylation as well as allosteric activation in response to increased G6P concentrations [9].
Dephosphorylation and activation of glycogen synthase occurs via protein phosphatase 1 (PP1). PP1 consists of a catalytic subunit (PP1c) that associates with a regulatory subunit. In rodent skeletal muscle, three regulatory subunits, RGL(GM), Protein targeting to glycogen (PTG)/R5, and R6 have been identified to be involved in glycogen metabolism by targeting PP1 to glycogen particles. RGL(GM) is primarily expressed in skeletal muscle, while PTG/R5 and R6 are ubiquitously expressed [10–12]. GL/R4, the major glycogen targeting PP1-subunit in liver, and R3E, the more recently identified regulatory subunit, have been found at appreciable levels in human muscle but are virtually absent from rodent skeletal muscle [13].
Phosphorylation and inactivation of glycogen synthase occurs via its upstream serine/threonine kinases, glycogen synthase kinase-3α and β (GSK-3α and GSK-3β). With insulin stimulation, Akt phosphorylates GSK-3α and GSK-3β on their Ser21 and Ser9 residues, respectively, leading to decreased GSK-3 activity [14]. This leads to decreased phosphorylation and activation of glycogen synthase, resulting in increased glycogen synthesis [15].
It is well established that exercise training increases glycogen content in skeletal muscle from both rodents [16, 17] and humans [2, 18] and this occurs concomitant with increases in glycogen synthase activity and protein abundance [19, 20]. However, the molecular adaptations that are responsible for these changes in glycogen synthase have not been fully investigated. In the current study, we determined the effects of exercise training on the regulation of glycogen synthase and its related signaling molecules in rat skeletal muscle. Our findings suggest that training-induced increases in muscle glycogen content may be regulated by multiple mechanisms, i.e. increases in glycogen synthase expression, muscle glucose uptake, allosteric activation of glycogen synthase and PP1activity.
RESULTS
Adaptations to training
In previous studies we have shown that rats continually increase their running distance with voluntary wheel cage training for the first 4 weeks, reach a plateau for 2–3 weeks, followed by a gradual decrease [21]. Taking these running characteristics into consideration, we selected three time points for study: week 1, corresponding to an increasing rate of running, week 4, when running distance should be peaking; and week 7, just prior to the decline in running distance (Fig. 1A).
Figure 1. Running distance and glycogen content in the 1, 4, and 7 week groups.

(A) Female Sprague Dawley rats performed 1, 4, or 7 weeks of voluntary wheel running or were kept as sedentary controls. Average running distance/day was calculated from continuous recordings. (B) Glycogen content in the triceps muscle was determined by the HCl hydrolysis procedure as described in `Materials and Methods'. Glycogen content is expressed as nmol/mg tissue. Data are means ± S.E., n = 6–9/group. **, P<0.01 versus sedentary, #, P<0.05 versus 1-week trained group. wk; week.
Fed blood glucose concentrations were significantly lower in the trained rats after 1 week of exercise training (Table 1). However, with 4 and 7 weeks of training, there were no significant differences in blood glucose concentrations between sedentary and trained rats (Table 1). Insulin concentrations in the fasted state and final body weights were also not significantly different between the sedentary and trained groups. Food intake significantly decreased with 1 week of exercise training, most likely due to increased running time in the wheel. In contrast, rats that exercise trained for 4 and 7 weeks had a significant increase in food consumption compared to sedentary rats.
Table 1.
Running distance, blood glucose, and insulin concentrations, body weights, and food intake
| Group | N | Total distance (km) | Blood glucose (mg/dl) | Insulin (ng/ml) | Body weight (g) | Food intake (g/week) | |
|---|---|---|---|---|---|---|---|
| 1 week | sedentary | 6 | 141 ± 4.6 | 1.05 ± 0.09 | 150 ± 1.8 | 141 ± 4.0 | |
| trained | 6 | 24.7 ± 4.3 | 130 ± 1.7* | 0.88 ± 0.06 | 145 ± 1.6 | 124 ±3.4* | |
|
| |||||||
| 4 week | sedentary | 6 | 117 ± 3.9 | 1.29 ± 0.14 | 208 ± 4.7 | 146 ±2.6 | |
| trained | 6 | 336.9 ± 35.1 | 112 ± 2.1 | 1.25 ± 0.08 | 196 ± 3.2 | 159 ± 5.3* | |
|
| |||||||
| 7 week | sedentary | 12 | 107 ± 2.6 | 1.37 ± 0.05 | 239 ± 4.6 | 144 ± 1.5 | |
| trained | 9 | 435.5 ± 41.7 | 103 ± 1.5 | 1.43 ± 0.16 | 241 ± 7.0 | 170 ±3.0** | |
Value are means ± SE.
P<0.05
P<0.01 compared with the age-matched sedentary group. Fed blood glucose was obtained two days before dissection. Fasted insulin concentrations and body weight were obtained on the day of dissection.
Previous studies have shown that glycogen concentrations in the skeletal muscle of trained rodents [16, 17] and humans [2, 18] are significantly elevated. Here, we characterize the time course of the training response by measuring glycogen levels after 1, 4, and 7 weeks of wheel running. Glycogen concentrations did not change with one week of training, but were significantly increased in triceps muscle after 4 and 7 weeks of wheel running exercise training (Fig. 1B).
GLUT4 protein and glucose uptake
Glycogen synthesis in skeletal muscle correlates with glucose uptake into the muscle cell, and GLUT4 is the major glucose transporter protein expressed in skeletal muscle. One week of exercise training resulted in a significant, 50% increase in GLUT4 protein (Fig. 2A). Exercise training for 4 and 7 weeks showed an even more pronounced effect on GLUT4 expression (Fig. 2A). To determine the effects of training on insulin-stimulated glucose uptake, 2-deoxy-D- [3H] glucose uptake into epitrochlearis muscles was measured in the 7 week trained group in the basal state and in response to increasing doses of insulin. Epitrochlearis muscle was used because its small size makes it suitable for in vitro glucose transport and because the muscle fiber type composition (type I - 15%; type IIa - 20%; type IIb - 65% [36]) is similar to the deep regions of the triceps (type I - 10%; type IIa - 20%; type IIb - 70% [38]) the muscle used for other analyses in the current study. Insulin-stimulated glucose uptake was significantly greater in the trained group compared to the sedentary group with submaximal (300 μU/ml) and supermax (50 mU/ml) insulin concentrations suggesting improved insulin sensitivity commonly associated with exercise training [22,23] (Fig. 2B).
Figure 2. Effects of endurance exercise training on GLUT4 protein in triceps muscle and 2-deoxyglucose uptake in epitrochlearis muscle.

(A) GLUT4 protein expression in the triceps muscle was measured by immunoblotting with anti-GLUT4 antibody. Results are means ± S.E., n = 6–12/group. **, P<0.01 versus sedentary, #, P<0.05 versus 1-week trained group. (B) 2-deoxy-D- [3H] glucose into epitrochlearis muscles was measured in the 7 week trained group under basal conditions and following stimulation with increasing doses of insulin as described in `Materials and Methods'. The data are shown as net increase in glucose uptake evoked by insulin stimulation (“insulin-stimulated glucose uptake” – “basal glucose uptake ” (no insulin present in incubation buffer)). Results are means ± S.E., n = 3–7/group. *, P<0.05 versus sedentary.
Glycogen synthase activity and protein expression
We next determined the effects of training on glycogen synthase activity and protein expression. Glycogen synthase expressed as the activity in the presence of G6P, total glycogen synthase activity, was unchanged with 1 week of exercise training but significantly increased with 4 and 7 weeks of wheel cage running (Fig. 3A). Glycogen synthase I-form, assayed in the absence of G6P, was not altered by training at any time point (Fig. 3B). Total activity is believed to correspond to glycogen synthase protein content. Accordingly, glycogen synthase protein expression determined by Western blot was unchanged after 1 week but significantly increased after 4 and 7 weeks of exercise training (Fig. 4B). Glycogen synthase phosphorylation determined by Western blot (Fig. 4A) mimicked the glycogen synthase protein expression, resulting in no change in the phospho-glycogen synthase /glycogen synthase ratio (Fig. 4C). The increase in glycogen synthase phosphorylation also corresponds with the %I glycogen synthase (−/+ G6P ratio) which is also significantly decreased following 4 and 7 weeks of wheel cage running (Fig. 3B) and with the elevated glycogen content observed with 4 and 7 weeks of wheel cage running. These findings show that increased glycogen content in skeletal muscle is associated with increases in glycogen synthase protein content and total activity.
Figure 3. Effects of exercise training on glycogen synthase activity.

(A) Glycogen synthase activity was assayed in the presence or absence of G6P as described in `Materials and Methods'. (B) Glycogen synthase activity expressed as %I Form glycogen synthase (−/+ G6P ratio). Data are means ± S.E., n = 6–9/group. *, P<0.05 versus sedentary, **, P<0.01 versus sedentary. G6P; glucose-6-phosphate.
Figure 4. Effects of exercise training on glycogen synthase protein expression and phosphorylation.

(A) Glycogen synthase phosphorylation was measured by immunoblotting with anti-phospho- glycogen synthase (pSer645/649/653/657) antibody. (B) Glycogen synthase protein expression was measured by immunoblotting with anti-glycogen synthase antibody. (C) Phospho-glycogen synthase /glycogen synthase ratio (calculated from Fig. 4A and B). Results are means ± S.E., n = 6–12/group. *, P<0.05 versus sedentary, **, P<0.01 versus sedentary.
Glycogen phosphorylase activity
Glycogen phosphorylase activity, the rate-limiting enzyme for the breakdown of glycogen, expressed as absolute activity (Fig. 5A) or expressed as the ratio of activity in the presence or absence of AMP, was not significantly changed in any training group (Fig. 5B). These results suggest that training-induced increases in glycogen content are more likely attributed to an increase in glycogen synthesis, rather than a decrease in glycogen breakdown.
Figure 5. Effects of exercise training on phosphorylase activity.

Phosphorylase activity in the triceps muscle was assayed as described in `Materials and Methods'. Phosphorylase activity was expressed as absolute activity (A) or as the ratio of activity in the presence or absence of AMP (B). Results are means ± S.E., n = 6–12/group.
Glycogen synthase kinase-3
Phosphorylation of GSK-3 inhibits its activity, leading to a reduction in the phosphorylation and activation of glycogen synthase. GSK-3α phosphorylation (Ser21) was significantly decreased in the 1 week (40%), 4 week (30%) and 7 week (50%) trained groups (Fig. 6A). GSK-3α total protein expression significantly decreased at 1 week, but was unchanged at 4 weeks and slightly decreased with 7 weeks of training (Fig. 6B). The ratio of GSK-3α phosphorylation/GSK-3α protein tended to be lower in the trained groups but only achieved significance in the 4 week trained group and only tended to be lower in the 7 week trained group (p<0.066) (Fig. 6C). This suggests that the decrease in GSK-3α phosphorylation may not solely be explained by a decrease in GSK-3α protein concentration (Fig. 6B). GSK-3β phosphorylation (Ser9) tended to decrease in all trained groups, but the differences did not reach statistical significance (Fig. 6D). GSK-3β protein content was decreased in the 1 week trained group but was similar to sedentary control rats in the 4 and 7 week groups (Fig. 6E). The ratio of GSK-3β phosphorylation/GSK-3β protein was unchanged in the 1 week group, achieved significance in the 4 week trained group and tended to be lower in the 7 week trained group (p<0.05) (Fig. 6F). This suggests that the decrease in GSK-3β phosphorylation cannot be explained by a decrease in GSK-3β protein concentration, but by a decrease in its phosphorylation. The GSK-3β phosphorylation/GSK-3β protein ratio also correlates inversely to the pattern of glycogen content at in the 1, 4 and 7 week groups.
Figure 6. Effects of exercise training on phosphorylation and total protein expression of GSK-3α and GSK-3β.

GSK-3α (A, B and C) and GSK-3β (D, E and F) phosphorylation, total protein expression and phosphorylation/total protein expression ratio were measured in triceps muscle lysate by immunoblotting. Results are means ± S.E., n = 6–12/group. *, P<0.05 versus sedentary, **, P<0.01 versus sedentary.
Protein phosphatase 1 proteins and activity
Protein phosphatase 1 (PP1) regulates glycogen synthase, activating the enzyme through dephosphorylation. Consistent with muscle glycogen content, PP1 activity was similar in sedentary and exercised rats with 1 week of training and increased significantly following 4 and 7 weeks of wheel training (Fig. 7A). In order to investigate possible mechanisms for training-induced increases in PP1 activation, we studied protein expression of its major catalytic and regulatory subunits. Protein levels of the catalytic subunit, PP1c, were not significantly different in the trained rats compared to their age-matched sedentary controls (Fig. 7B). RGL(GM), a regulatory subunit of PP1, was significantly decreased in triceps of the 4 and 7 week trained groups (Fig. 7C). Thus, PP1 activity and protein expression of the RGL(GM) regulatory subunit of PP1 were differentially regulated following exercise training.
Figure 7. Effects of exercise training on PP1 activity and subunit expression in triceps.
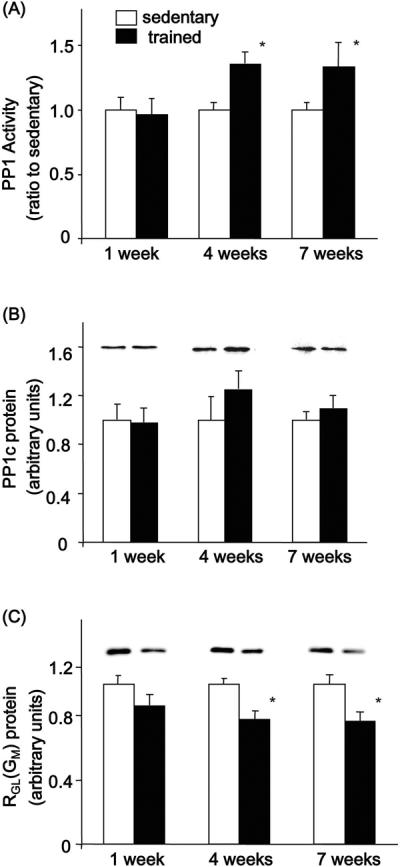
PP1 activity in the triceps muscle was assayed as described in `Materials and Methods'. Protein expression was measured by immunoblotting. Within each group, data are expressed relative to sedentary. (A) PP1 activity (B) PP1c protein expression, and (C), RGL(GM) protein expression. Results are means ± S.E., n = 6–12/group. *, P<0.05 versus sedentary, **, P<0.01 versus sedentary.
DISCUSSION
It is well established that exercise training increases glycogen concentrations in skeletal muscle, yet the molecular mechanisms that mediate this adaptation to training are not well understood. This study demonstrates that increased glycogen content in trained rat skeletal muscle is accompanied by increased glycogen synthase protein expression, total glycogen synthase activity and PP1 activities, whereas glycogen phosphorylase activity, the key enzyme for glycogen breakdown in muscle, was unchanged and GSK-3α phosphorylation is decreased.
Glycogen content was not elevated after 1 week of wheel cage running, but was significantly increased after 4 and 7 weeks. Elevation in muscle glycogen coincided with increases in glycogen synthase total activities and glycogen synthase protein expression. Glycogen synthase has been shown to be associated with the glycogen particle [24, 25] so one explanation for the increase in glycogen synthase protein could be that it is stabilized by the elevated glycogen levels. This study shows that glycogen synthase activity measured in the absence of G6P is not changed, and that −/+ G6P ratio is decreased due primarily to the increased phosphorylation of glycogen synthase following training. Evidence of increased glycogen synthase phosphorylation is further supported by the upward electrophoretic mobility shift in the glycogen synthase, especially at 7 weeks of training. In order to understand the mechanism underlying the regulation of glycogen synthesis following exercise training, we examined the major signaling proteins that regulate glycogen synthase, PP1 and GSK-3. Activity of PP1, an activator of glycogen synthase, has previously been reported to be increased by insulin stimulation or acute exercise [26, 27]. In our study, PP1 activity increased in muscles of rats trained for 4 and 7 weeks, and this coincided with increases in glycogen content and total glycogen synthase activity. While there was no change in the expression level of the PP1c catalytic subunit, PP1c, interestingly, RGL(GM) was decreased in the 4 and 7 week trained groups. It is possible that the various regulatory subunits of the PP1 protein display divergence in their expression in skeletal muscle, but unfortunately we were unable to accurately measure PTG/R5. The decrease of RGL(GM) may represent an adaptive response to more effectively accumulate or maintain glycogen levels in skeletal muscle that is repeatedly exposed to exercise stress and the corresponding adrenergic activation. It should be noted that PP1 dephosphorylates many other cellular proteins in multiple tissues, including skeletal muscle, that can function in the regulation of metabolism, protein synthesis, ion channels and ATP-dependent ion pumps [28]. Therefore, PP1 could play a fundamental role in multiple training-induced adaptations in skeletal muscle, and this will be an important area for future study.
GSK-3α and GSK-3β protein content did not change significantly following 4 and 7 week endurance exercise. GSK-3α and GSK-3β serine phosphorylation decreased after endurance exercise training, which led to increased GSK-3 activity and consequently to increased glycogen synthase phosphorylation and decreased glycogen synthase activity, even though, total glycogen synthase expression and activity were increased. The mechanism underlying this tendency for GSK-3 phosphorylation to be decreased by training is not known, but could be related to the tendency for serum insulin concentrations to be reduced with training. Another explanation for this phenomenon could be a negative feedback mechanism in response to increases in glycogen [29]. Previous studies have shown decreased GSK-3α and GSK-3β activities in rat and human skeletal muscle in response to acute exercise [30, 31]. In the current study, muscles were dissected 30 hours after the last bout of exercise. Thus, decreased GSK-3 phosphorylation can be assumed to be a chronic rather than an acute effect. Whether through a negative feedback mechanism or as a direct response to exercise training, our data suggest that exercise training increases GSK-3 activity without having a major impact on muscle glycogen concentration. This observation is supported by previous studies reporting that, in an acute exercise model, GSK-3 is not related to glycogen synthase activity [32]. Recently, we showed that GSK-3 knock-in mice, in which the Akt serine phosphorylation sites on GSK-3α and β were replaced by alanine (GSK-3α/βS21A/S21A/S9A/S9A) making these mutant forms of the molecules constitutively active, had a normal capacity to stimulate glycogen synthase with insulin [33]. This demonstrates that phosphorylation of glycogen synthase by GSK-3α/β is not the rate-limiting step of glycogen synthesis.
During exercise and for a period of time following each exercise interval glucose uptake is increased in the muscle of trained animals which should result in increased G6P concentrations, and acting allosterically could override the phosphorylation/inactivation of glycogen synthase. Additionally, during training bouts as glycogen is depleted the % I form of glycogen synthase increases with decreasing glycogen content. In this study 30 hours following the last bout of exercise where glycogen stores have been restored, the % I form of glycogen synthase was significantly lower in the trained compared to sedentary and accordingly phospho -glycogen synthase was significantly greater in the trained compared to sedentary although the ratio of phospho-glycogen synthase to glycogen synthase was unchanged. A knock-in mouse model has recently been generated in which muscle glycogen synthase was replaced with a mutant type that could not be activated by G6P but could still be activated by dephosphorylation. These mice had an 80% reduction in the insulin stimulated rate of muscle glycogen synthesis and a significant reduction in glycogen content suggesting that allosteric activation of glycogen synthase is the predominate mechanism by which insulin regulates intracellular muscle glycogen synthesis [34]. More recently these mice were studied using AICAR to activate AMP-activated protein kinase (AMPK) activity and allosteric activation of glycogen synthase by G6P was found to be the predominate mechanism in the regulation of muscle glycogen synthesis [35]. Although to date these knock-in mice have not been studied following training one could speculate that allosteric activation of glycogen synthase may also be an important mechanism by which muscle contraction regulates in vivo glycogen synthesis. Therefore, the relationship between GSK-3α/β phosphorylation state and glycogen synthase activity and glycogen content obtained in the current study may suggest that the allosteric effect of G6P, rather than phosphorylation, plays a vital role in the regulation of muscle glycogen content with exercise training.
In the current study, we determined the effects of exercise training on the regulation of glycogen synthase and signaling molecules that regulate its function in rat skeletal muscle. Consistent with the training effect on glycogen content, total glycogen synthase activity and expression, PP1 activity was unchanged after 1 week of training but significantly increased after 4 and 7 weeks of training. Our findings suggest that training-induced increases in muscle glycogen content could be regulated by multiple mechanisms, i.e. increases in glycogen synthase expression, muscle glucose uptake, G6P allosteric activation of glycogen synthase and PP1 activity. The intracellular molecular adaptations that are responsible for these changes in glycogen synthase still require further investigation.
MATERIALS AND METHODS
Animal and exercise training protocol
Female Sprague Dawley rats weighing 75 to100 grams were obtained from Taconic (Germantown, NY), maintained on a 12-hour light/dark cycle, and fed standard laboratory chow and water ad libitum. Rats were divided into two groups matched for body weights and blood glucose concentrations. Rats in the untrained group were housed individually in plastic cages (sedentary group). Trained rats were housed in wheel cages (Nalgene, Rochester, NY) with voluntary access to exercise. In order to determine the time-dependent effects of exercise training, both groups (sedentary and trained) were subdivided into 3 additional groups, a 1 week training group, a 4 week training group, and a 7 week training group. The total running wheel revolutions were recorded every two days and the accumulated distance was calculated at the end of each week. Body weights, food intake, and blood glucose concentrations were monitored once a week. After 1, 4, or 7 weeks of training, all rats were moved into individual cages without running wheels 30 hr before study to avoid the acute effects of a single bout of exercise, and fasted for the last 16 hours. Rats were killed by decapitation, and blood was collected. The triceps muscles from both forelimbs were quickly dissected, frozen in liquid nitrogen, and stored at −80 C° until processed. Epitrochlearis muscles were removed from the forelimbs and used for glucose transport experiments. All animal procedures were approved by the Institutional Animal Care and Use Committee of the Joslin Diabetes Center and were in accordance with National Institutes of Health guidelines.
Glucose uptake experiments
Epitrochlearis muscles from the 7 week sedentary and training groups were used for glucose transport experiments. Muscle were pre-incubated in media consisting of Krebs Ringer bicarbonate (KRB) buffer, with 2 mM Na pyruvate, for 30 min at 37 °C in the presence or absence of different insulin concentrations (30μU/ml, 300 μU/ml, and 50 mU/ml). Glucose uptake was measured for 10 min at 30 °C in KRB buffer with 7 mM D-mannitol, 1 mM 2-deoxy-glucose (2-DG), with or without each concentration of insulin (30μU, 300 μU or 50mU/ml insulin). Accumulation of 2-deoxy-D-[3H] glucose in the tissue was determined, and rates of uptake calculated as described previously [37].
Skeletal muscle processing and immunoblotting
Pulverized triceps muscle was homogenized in lysis buffer (1:10) containing 20 mM Tris-HCl, 5 mM EDTA, 10 mM sodium pyrophosphate, 100 mM sodium fluoride, 2 mM sodium vanadate, 10 % Nonidet P-40, 10 μg/ml leupeptin, 10 μg/ml aprotinin, 3 mM benzamidine, and 1 mM phenyl methylsulfonyl fluoride, pH 7.5 at 4°C. The homogenates were centrifuged at 15,000 × g for 20 min. Protein concentrations of supernatants were determined by the Bradford method [39]using dye reagent from Bio-Rad Laboratories (Hercules, CA) and bovine serum albumin as a standard.
Muscle lysates were separated by SDS-polyacrylamide gel electrophoresis and transferred to nitrocellulose membranes. The nitrocellulose membranes were blocked in Tris-buffer saline containing 5% non-fat dry milk and 0.05% Tween 20. Membranes were incubated with the appropriate primary antibodies overnight, and secondary antibody conjugated to horseradish peroxidase was used for detection by enhanced chemiluminescence. Anti-GLUT4 and anti-glycogen synthase antibodies were obtained from Chemicon International Inc. (Temecula, CA). Anti-Phospho- Specific Glycogen Synthase [PC746 PhosphoDetect™ Anti-human Glycogen Synthase (pSer645/649/653/657) polyclonal Rabbit antibody was obtained from Oncogene (San Diego, CA)]. Phosphorylation of these sites on glycogen synthase is an indication of GSK-3 activity. Anti-phospho-GSK-3α Ser21/β Ser9 antibody was obtained from Cell Signaling Technology (Beverly, MA). GSK-3α/β antibody and anti-PP1 antibody were obtained from Upstate Biotechnology (Lake Placid, NY). RGL(GM) antibody was a generous gift from Dr. A. Saltiel, University of Michigan, and Dr. M. Brady, University of Chicago.
PP1 activity assay
For the PP1 activity assay, pulverized triceps muscle was homogenized with a polytron (Brinkmann Instruments, Westbury, NY) on ice in lysis buffer containing 50 mM Hepes, pH 7.4, 2 mM EDTA, 2 mg/ml glycogen, 0.2% 2-mercaptoethanol, 1 mM Benzamidine, 10 μg/ml aprotinin, and 0.1 mM phenylmethylsulfonyl fluoride. Homogenates were centrifuged at 2,500 × g for 5 min at 4°C and protein concentrations of the supernatants were determined by the Bradford method [39]. 32P-labeled phosphorylase a was prepared as described by Cohen et.al. [40]. PP1 activity was determined by measuring the release of 32P-phosphate from phosphorylase a as described previously [41].
Biochemical assays
To determine glycogen content, 10 mg of muscle was hydrolyzed in 2N HCl, neutralized by adding 2 N NaOH, and assayed for glucose content as described previously using a hexokinase-dependent assay kit [42]. For glycogen synthase and phosphorylase activities, 50 mg muscle tissue was homogenized in a buffer (1:19) containing 50 mM Tris-HCl, 5 mM EDTA, and 100 mM sodium fluoride, pH 7.8. Glycogen synthase activity was determined in the presence or absence of 6.7 mM glucose 6-phosphate (G6P), an allosteric activator of glycogen synthase, as described previously [43]. An index of GS activity was expressed by” % I form”, the ratio of the activity in the absence of G6P to that in the presence of G6P. Glycogen phosphorylase was determined in the presence or absence of 2 mM 5'AMP [44]. Serum insulin levels were measured using a rat/mouse insulin ELISA kit (LINCO Research, St. Charles, MO) following the manufacturer's instructions.
Statistical analysis
All data are expressed as means ± S.E.. Data were analyzed by unpaired Student t-test to compare sedentary and trained groups. For multi group comparisons, statistical evaluation was done by two-way ANOVA and followed by a post hoc test (Tukey's test) for multiple comparisons.
ACKNOWLEDGEMENTS
This work was supported by the National Institutes of Health (Grants and AR45670 and AR42338 to L.J.G. and Training Grant T32DK07260-29 to J.B.), by the Japan Society for the Promotion of Science (KAKENHI 24700700 to Y.M. and KAKENHI 21240063 to N.L.F.), by the Cabinet Office, Government of Japan (Funding Program for Next Generation World-Leading Researchers LS102 to N.F.) and by a fellowship within the Postdoc Program of the German Academic Exchange Service DAAD (to K.S.C.G.). We thank Dr. Alan Saltiel (University of Michigan) and Dr. Matthew Brady (University of Chicago) for providing the RGL(GM) and PTG/R5 antibodies.
Abbreviations
- PP1
protein phosphatase 1
- GSK-3
glycogen synthase kinase 3
- GM
Protein expression of RGL
- G6P
glucose 6-phosphate
- KRB
Krebs Ringer bicarbonate
- GLUT4
glucose transporter type 4
- PTG
Protein targeting to glycogen
- 2-DG
deoxy-glucose
Reference List
- 1.Cline GW, Petersen KF, Krssak M, Shen J, Hundal RS, Trajanoski Z, Inzucchi S, Dresner A, Rothman DL, Shulman GI. Impaired glucose transport as a cause of decreased insulin-stimulated muscle glycogen synthesis in type 2 diabetes. The New England journal of medicine. 1999;341:240–6. doi: 10.1056/NEJM199907223410404. [DOI] [PubMed] [Google Scholar]
- 2.Putman CT, Jones NL, Hultman E, Hollidge-Horvat MG, Bonen A, McConachie DR, Heigenhauser GJ. Effects of short-term submaximal training in humans on muscle metabolism in exercise. The American journal of physiology. 1998;275:E132–9. doi: 10.1152/ajpendo.1998.275.1.E132. [DOI] [PubMed] [Google Scholar]
- 3.Kubo K, Foley JE. Rate-limiting steps for insulin-mediated glucose uptake into perfused rat hindlimb. The American journal of physiology. 1986;250:E100–2. doi: 10.1152/ajpendo.1986.250.1.E100. [DOI] [PubMed] [Google Scholar]
- 4.Fisher JS, Nolte LA, Kawanaka K, Han DH, Jones TE, Holloszy JO. Glucose transport rate and glycogen synthase activity both limit skeletal muscle glycogen accumulation. American journal of physiology Endocrinology and metabolism. 2002;282:E1214–21. doi: 10.1152/ajpendo.00254.2001. [DOI] [PubMed] [Google Scholar]
- 5.Goodyear LJ, Kahn BB. Exercise, glucose transport, and insulin sensitivity. Annual review of medicine. 1998;49:235–61. doi: 10.1146/annurev.med.49.1.235. [DOI] [PubMed] [Google Scholar]
- 6.Fueger PT, Shearer J, Bracy DP, Posey KA, Pencek RR, McGuinness OP, Wasserman DH. Control of muscle glucose uptake: test of the rate-limiting step paradigm in conscious, unrestrained mice. The Journal of physiology. 2005;562:925–35. doi: 10.1113/jphysiol.2004.076158. [DOI] [PMC free article] [PubMed] [Google Scholar]
- 7.Baldwin KM, Winder WW, Terjung RL, Holloszy JO. Glycolytic enzymes in different types of skeletal muscle: adaptation to exercise. The American journal of physiology. 1973;225:962–6. doi: 10.1152/ajplegacy.1973.225.4.962. [DOI] [PubMed] [Google Scholar]
- 8.Rockl KS, Hirshman MF, Brandauer J, Fujii N, Witters LA, Goodyear LJ. Skeletal muscle adaptation to exercise training: AMP-activated protein kinase mediates muscle fiber type shift. Diabetes. 2007;56:2062–9. doi: 10.2337/db07-0255. [DOI] [PubMed] [Google Scholar]
- 9.Franch J, Aslesen R, Jensen J. Regulation of glycogen synthesis in rat skeletal muscle after glycogen-depleting contractile activity: effects of adrenaline on glycogen synthesis and activation of glycogen synthase and glycogen phosphorylase. The Biochemical journal. 1999;344(Pt 1):231–5. [PMC free article] [PubMed] [Google Scholar]
- 10.Tang PM, Bondor JA, Swiderek KM, DePaoli-Roach AA. Molecular cloning and expression of the regulatory (RG1) subunit of the glycogen-associated protein phosphatase. The Journal of biological chemistry. 1991;266:15782–9. [PubMed] [Google Scholar]
- 11.Armstrong CG, Browne GJ, Cohen P, Cohen PT. PPP1R6, a novel member of the family of glycogen-targetting subunits of protein phosphatase 1. FEBS letters. 1997;418:210–4. doi: 10.1016/s0014-5793(97)01385-9. [DOI] [PubMed] [Google Scholar]
- 12.Armstrong CG, Doherty MJ, Cohen PT. Identification of the separate domains in the hepatic glycogen-targeting subunit of protein phosphatase 1 that interact with phosphorylase a, glycogen and protein phosphatase 1. The Biochemical journal. 1998;336(Pt 3):699–704. doi: 10.1042/bj3360699. [DOI] [PMC free article] [PubMed] [Google Scholar]
- 13.Munro S, Ceulemans H, Bollen M, Diplexcito J, Cohen PT. A novel glycogen-targeting subunit of protein phosphatase 1 that is regulated by insulin and shows differential tissue distribution in humans and rodents. The FEBS journal. 2005;272:1478–89. doi: 10.1111/j.1742-4658.2005.04585.x. [DOI] [PubMed] [Google Scholar]
- 14.Cross DA, Alessi DR, Cohen P, Andjelkovich M, Hemmings BA. Inhibition of glycogen synthase kinase-3 by insulin mediated by protein kinase B. Nature. 1995;378:785–9. doi: 10.1038/378785a0. [DOI] [PubMed] [Google Scholar]
- 15.Lawrence JC, Jr., Roach PJ. New insights into the role and mechanism of glycogen synthase activation by insulin. Diabetes. 1997;46:541–7. doi: 10.2337/diab.46.4.541. [DOI] [PubMed] [Google Scholar]
- 16.Durante PE, Mustard KJ, Park SH, Winder WW, Hardie DG. Effects of endurance training on activity and expression of AMP-activated protein kinase isoforms in rat muscles. American journal of physiology Endocrinology and metabolism. 2002;283:E178–86. doi: 10.1152/ajpendo.00404.2001. [DOI] [PubMed] [Google Scholar]
- 17.Konhilas JP, Widegren U, Allen DL, Paul AC, Cleary A, Leinwand LA. Loaded wheel running and muscle adaptation in the mouse. American journal of physiology Heart and circulatory physiology. 2005;289:H455–65. doi: 10.1152/ajpheart.00085.2005. [DOI] [PubMed] [Google Scholar]
- 18.Hickner RC, Fisher JS, Hansen PA, Racette SB, Mier CM, Turner MJ, Holloszy JO. Muscle glycogen accumulation after endurance exercise in trained and untrained individuals. J Appl Physiol. 1997;83:897–903. doi: 10.1152/jappl.1997.83.3.897. [DOI] [PubMed] [Google Scholar]
- 19.Bak JF, Jacobsen UK, Jorgensen FS, Pedersen O. Insulin receptor function and glycogen synthase activity in skeletal muscle biopsies from patients with insulin-dependent diabetes mellitus: effects of physical training. The Journal of clinical endocrinology and metabolism. 1989;69:158–64. doi: 10.1210/jcem-69-1-158. [DOI] [PubMed] [Google Scholar]
- 20.Mikines KJ, Sonne B, Farrell PA, Tronier B, Galbo H. Effect of training on the dose-response relationship for insulin action in men. J Appl Physiol. 1989;66:695–703. doi: 10.1152/jappl.1989.66.2.695. [DOI] [PubMed] [Google Scholar]
- 21.Goodyear LJ, Hirshman MF, Horton ED, Knutson SM, Wardzala LJ, Horton ES. Exercise training normalizes glucose metabolism in a rat model of impaired glucose tolerance. Metabolism: clinical and experimental. 1991;40:455–64. doi: 10.1016/0026-0495(91)90224-k. [DOI] [PubMed] [Google Scholar]
- 22.Holm G, Bjorntorp P. Metabolic effects of physical training. Acta paediatrica Scandinavica Supplement. 1980;283:9–14. doi: 10.1111/j.1651-2227.1980.tb15300.x. [DOI] [PubMed] [Google Scholar]
- 23.Mondon CE, Dolkas CB, Reaven GM. Site of enhanced insulin sensitivity in exercise-trained rats at rest. The American journal of physiology. 1980;239:E169–77. doi: 10.1152/ajpendo.1980.239.3.E169. [DOI] [PubMed] [Google Scholar]
- 24.Wanson JC, Drochmans P. Rabbit skeletal muscle glycogen. A morphological and biochemical study of glycogen beta-particles isolated by the precipitation-centrifugation method. The Journal of cell biology. 1968;38:130–50. doi: 10.1083/jcb.38.1.130. [DOI] [PMC free article] [PubMed] [Google Scholar]
- 25.Meyer F, Heilmeyer LM, Jr., Haschke RH, Fischer EH. Control of phosphorylase activity in a muscle glycogen particle. I. Isolation and characterization of the protein-glycogen complex. The Journal of biological chemistry. 1970;245:6642–8. [PubMed] [Google Scholar]
- 26.Printen JA, Brady MJ, Saltiel AR. PTG, a protein phosphatase 1-binding protein with a role in glycogen metabolism. Science. 1997;275:1475–8. doi: 10.1126/science.275.5305.1475. [DOI] [PubMed] [Google Scholar]
- 27.Aschenbach WG, Suzuki Y, Breeden K, Prats C, Hirshman MF, Dufresne SD, Sakamoto K, Vilardo PG, Steele M, Kim JH, Jing SL, Goodyear LJ, DePaoli-Roach AA. The muscle-specific protein phosphatase PP1G/R(GL)(G(M))is essential for activation of glycogen synthase by exercise. The Journal of biological chemistry. 2001;276:39959–67. doi: 10.1074/jbc.M105518200. [DOI] [PubMed] [Google Scholar]
- 28.Ceulemans H, Bollen M. Functional diversity of protein phosphatase-1, a cellular economizer and reset button. Physiological reviews. 2004;84:1–39. doi: 10.1152/physrev.00013.2003. [DOI] [PubMed] [Google Scholar]
- 29.Nielsen JN, Richter EA. Regulation of glycogen synthase in skeletal muscle during exercise. Acta physiologica Scandinavica. 2003;178:309–19. doi: 10.1046/j.1365-201X.2003.01165.x. [DOI] [PubMed] [Google Scholar]
- 30.Markuns JF, Wojtaszewski JF, Goodyear LJ. Insulin and exercise decrease glycogen synthase kinase-3 activity by different mechanisms in rat skeletal muscle. The Journal of biological chemistry. 1999;274:24896–900. doi: 10.1074/jbc.274.35.24896. [DOI] [PubMed] [Google Scholar]
- 31.Sakamoto K, Arnolds DE, Ekberg I, Thorell A, Goodyear LJ. Exercise regulates Akt and glycogen synthase kinase-3 activities in human skeletal muscle. Biochemical and biophysical research communications. 2004;319:419–25. doi: 10.1016/j.bbrc.2004.05.020. [DOI] [PubMed] [Google Scholar]
- 32.Wojtaszewski JF, Nielsen P, Kiens B, Richter EA. Regulation of glycogen synthase kinase-3 in human skeletal muscle: effects of food intake and bicycle exercise. Diabetes. 2001;50:265–9. doi: 10.2337/diabetes.50.2.265. [DOI] [PubMed] [Google Scholar]
- 33.Bouskila M, Hirshman MF, Jensen J, Goodyear LJ, Sakamoto K. Insulin promotes glycogen synthesis in the absence of GSK3 phosphorylation in skeletal muscle. American journal of physiology Endocrinology and metabolism. 2008;294:E28–35. doi: 10.1152/ajpendo.00481.2007. [DOI] [PubMed] [Google Scholar]
- 34.Bouskila M, Hunter RW, Ibrahim AF, Delattre L, Peggie M, van Diepen JA, Voshol PJ, Jensen J, Sakamoto K. Allosteric regulation of glycogen synthase controls glycogen synthesis in muscle. Cell metabolism. 2010;12:456–66. doi: 10.1016/j.cmet.2010.10.006. [DOI] [PubMed] [Google Scholar]
- 35.Hunter RW, Treebak JT, Wojtaszewski JF, Sakamoto K. Molecular mechanism by which AMP-activated protein kinase activation promotes glycogen accumulation in muscle. Diabetes. 2011;60:766–74. doi: 10.2337/db10-1148. [DOI] [PMC free article] [PubMed] [Google Scholar]
- 36.Henriksen EJ, Bourey RE, Rodnick KJ, Koranyi L, Permutt MA, Holloszy JO. Glucose transporter protein content and glucose transport capacity in rat skeletal muscles. The American journal of physiology. 1990;259:E593–8. doi: 10.1152/ajpendo.1990.259.4.E593. [DOI] [PubMed] [Google Scholar]
- 37.Hayashi T, Hirshman MF, Kurth EJ, Winder WW, Goodyear LJ. Evidence for 5' AMP-activated protein kinase mediation of the effect of muscle contraction on glucose transport. Diabetes. 1998;47:1369–73. doi: 10.2337/diab.47.8.1369. [DOI] [PubMed] [Google Scholar]
- 38.Matsumoto A, Nagatomo F, Mori A, Ohira Y, Ishihara A. Cell size and oxidative enzyme activity of rat biceps brachii and triceps brachii muscles. The Journal of Physiological Sciences : JPS. 2007;57:311–6. doi: 10.2170/physiolsci.RP008907. [DOI] [PubMed] [Google Scholar]
- 39.Bradford MM. A rapid and sensitive method for the quantitation of microgram quantities of protein utilizing the principle of protein-dye binding. Analytical biochemistry. 1976;72:248–54. doi: 10.1016/0003-2697(76)90527-3. [DOI] [PubMed] [Google Scholar]
- 40.Cohen P, Alemany S, Hemmings BA, Resink TJ, Stralfors P, Tung HY. Protein phosphatase-1 and protein phosphatase-2A from rabbit skeletal muscle. Methods in enzymology. 1988;159:390–408. doi: 10.1016/0076-6879(88)59039-0. [DOI] [PubMed] [Google Scholar]
- 41.Brady MJ, Nairn AC, Saltiel AR. The regulation of glycogen synthase by protein phosphatase 1 in 3T3-L1 adipocytes. Evidence for a potential role for DARPP-32 in insulin action. The Journal of biological chemistry. 1997;272:29698–703. doi: 10.1074/jbc.272.47.29698. [DOI] [PubMed] [Google Scholar]
- 42.Colowick SP, Kaplan a. N. Methods of Enzymatic Analysis Hexokinase from baker's yeast. Academic.Press; New York: 1962. [Google Scholar]
- 43.Thomas JA, Schlender KK, Larner J. A rapid filter paper assay for UDPglucose-glycogen glucosyltransferase, including an improved biosynthesis of UDP-14C-glucose. Analytical biochemistry. 1968;25:486–99. doi: 10.1016/0003-2697(68)90127-9. [DOI] [PubMed] [Google Scholar]
- 44.Gilboe DP, Larson KL, Nuttall FQ. Radioactive method for the assay of glycogen phosphorylases. Analytical biochemistry. 1972;47:20–7. doi: 10.1016/0003-2697(72)90274-6. [DOI] [PubMed] [Google Scholar]