

With standard reference images, lobe-based visual assessment of volumetric CT in chronic obstructive pulmonary disease correlated well with quantitative CT findings and physiologic parameters and provided additional direct information on emphysema type and current morphologic abnormality in small and large airways.
Abstract
Purpose:
To provide a new detailed visual assessment scheme of computed tomography (CT) for chronic obstructive pulmonary disease (COPD) by using standard reference images and to compare this visual assessment method with quantitative CT and several physiologic parameters.
Materials and Methods:
This research was approved by the institutional review board of each institution. CT images of 200 participants in the COPDGene study were evaluated. Four thoracic radiologists performed independent, lobar analysis of volumetric CT images for type (centrilobular, panlobular, and mixed) and extent (on a six-point scale) of emphysema, the presence of bronchiectasis, airway wall thickening, and tracheal abnormalities. Standard images for each finding, generated by two radiologists, were used for reference. The extent of emphysema, airway wall thickening, and luminal area were quantified at the lobar level by using commercial software. Spearman rank test and simple and multiple regression analyses were performed to compare the results of visual assessment with physiologic and quantitative parameters.
Results:
The type of emphysema, determined by four readers, showed good agreement (κ = 0.63). The extent of the emphysema in each lobe showed good agreement (mean weighted κ = 0.70) and correlated with findings at quantitative CT (r = 0.75), forced expiratory volume in 1 second (FEV1) (r = −0.68), FEV1/forced vital capacity (FVC) ratio (r = −0.74) (P < .001). Agreement for airway wall thickening was fair (mean κ = 0.41), and the number of lobes with thickened bronchial walls correlated with FEV1 (r = −0.60) and FEV1/FVC ratio (r = −0.60) (P < .001).
Conclusion:
Visual assessment of emphysema and airways disease in individuals with COPD can provide reproducible, physiologically substantial information that may complement that provided by quantitative CT assessment.
© RSNA, 2012
Supplemental material: http://radiology.rsna.org/lookup/suppl/doi:10.1148/radiol.12120385/-/DC1
Introduction
Chronic obstructive pulmonary disease (COPD) is a preventable and treatable condition with substantial extrapulmonary effects that may contribute to the severity of disease in individual patients. The characteristic airflow limitation is progressive, not fully reversible, and associated with an abnormal inflammatory response of the lung to noxious particles or gases (1). With the development of volumetric computed tomography (CT), researchers in numerous studies have assessed the objective quantification of the extent and severity of pulmonary emphysema and measurements of airway dimensions (2–9). There has also been increased interest in the use of CT to identify subphenotypes of COPD to facilitate physiologic management (treatment including watchful waiting), surgical strategy, selection for drug trials, and genetic analysis (10–12). Quantitative CT in COPD is a more reliable objective method than subjective visual grading but has several limitations. For example, measurements of CT attenuation are not standardized among different CT vendors and models (13–16). In addition, existing quantitative methods fail to provide detailed analysis of the type of emphysema and patterns of morphologic abnormality of large and small airways. On the other hand, visual assessment of COPD is relatively simple, cheap, and independent of machine and reconstruction algorithms and correlates with physiologic assessment (17–20). It also provides more information on type of emphysema and small-airway abnormality. Limitations of interreader and intrareader variation may be overcome, at least in part, by using standard reference images. Therefore, the purposes of our study were to provide a newer detailed visual assessment scheme of CT for COPD by using standard reference images and to compare this visual assessment method with quantitative CT and several physiologic parameters.
Materials and Methods
Siemens provided financial support for image analysis but had no access to the data.
Clinical Subjects
Subjects for this study were selected from participants in the COPDGene Study, which recruited 10 000 cigarette smokers with and without COPD from 17 institutions (21). Non-Hispanic whites or African Americans aged 45–80 years with a minimum smoking history of 10 pack-years were included in the study. Exclusion criteria included pregnancy, history of fibrotic lung disease or diffuse bronchiectasis, previous surgical excision of at least one lung lobe (or a lung volume reduction procedure), active cancer for which the participant was undergoing treatment, known lung cancer, metal in the chest, recent exacerbation of COPD treated with newly prescribed or increased doses of antibiotics or steroids, recent eye surgery, myocardial infarction, other cardiac hospitalization, recent chest or abdominal surgery, inability to use albuterol, multiple self-described racial categories, and first- or second-degree relative already enrolled in the study.
The data coordinating center of the COPDGene study randomly selected 200 participants from the COPDGene cohort for imaging review. Forty participants each from the following categories were selected: (a) smokers without evidence for COPD, (b) smokers with Global Initiative for Obstructive Lung Disease (GOLD) stage 1 COPD, (c) smokers with GOLD stage 2 COPD, (d) smokers with GOLD stage 3 COPD, and (e) smokers with GOLD stage 4 COPD. Each GOLD stage subgroup was sex matched (25 men and 15 women per subgroup). The mean ages were 64.6 years ± 8.4 (standard deviation) for the 200 participants overall, 63.6 years ± 8.5 for 125 men, and 66.3 years ± 8.2 for 75 women. The institutional review boards from each hospital approved the analyses of the clinical and imaging data. Individual, informed written consent was obtained from all subjects.
CT Examination, Acquisition, and Data Analysis
Volumetric CT scans were obtained for all subjects with COPD by using various 16– and 64–detector row CT scanners (21,22). CT scans were obtained (a) during deep inspiratory breath hold at a standard CT dose and (b) at the end of normal expiration (functional residual capacity) at reduced CT dose in a craniocaudal direction of the supine position. Before the CT examination, each patient was carefully instructed on how to breathe. The typical CT variables were as follows: submillimeter collimation (0.6–0.75 mm) and submillimeter reconstruction (thickness, 0.625–0.9 mm; interval, 0.45–0.625 mm) with both standard and high-frequency protocols, 120 kVp, 200 mAs for inspiration examination, and 50 mAs for expiration examination (21,22). No patient received intravenous contrast medium. The scanned CT data were stored in Digital Imaging and Communications in Medicine format, which is the international standard for interconnecting medical imaging devices on standard networks.
Generation of Standard Reference Images
CT images with a high-frequency reconstruction algorithm were used. Two experienced chest radiologists (D.A.L. and J.B.S., with 25 and 12 years of experience, respectively) reviewed CT images to generate standard image sets. They included CT images that showed 5%, 25%, 50%, and 75% involvement for the extent of centrilobular emphysema through the upper, middle, and lower lung zones in the whole lung; 50% and 75% involvement by panlobular emphysema through the upper, middle, and lower lung zones in the whole lung; paraseptal emphysema; bronchial wall thickening; bronchiectasis; bronchial wall irregularity; centrilobular nodules; tracheal abnormality (saber-sheath trachea or outpouchings); mosaic attenuation; expiratory air trapping; and tracheobronchomalacia (Appendixes E1–E6 [online]).
Bronchial wall thickening was defined by the ratio of the inner diameter to the outer diameter of the lumen of less than 0.8 and extensive involvement. Bronchiectasis was considered present according to the visibility of a bronchus in the outer one-third of the lung or a diameter of the inner lumen greater than that of the accompanying pulmonary artery; the finding was regarded as positive if more than 50% of a segment was affected. Centrilobular nodules were considered present if more than 50% of a segment was affected; ground-glass opacity nodules were regarded as a positive finding. Tracheal abnormality was defined as the presence of tracheal deformity showing saber-sheath trachea or outpouchings. Saber-sheath deformity was a positive finding when coronal narrowing and sagittal widening of the intrathoracic tracheal diameter resulted in a tracheal index of less than 0.6 (23). Tracheal outpouching was defined as a focal herniation of mucosa through the tracheal wall (24). Mosaic attenuation pattern was defined as more than 25% of the lobe showing a patchwork of regions of differing attenuation at inspiratory CT, excluding areas of emphysema (25). Expiratory air trapping was defined at side-by-side comparison of inspiratory and expiratory CT images as the presence of parenchymal area with a less than normal increase in attenuation and lack of volume reduction, involving more than 25% of the lobe, excluding areas of emphysema (25). Tracheobronchomalacia was defined as a more than 50% collapse of the trachea and main bronchi at end-expiratory CT. The reviewers selected images in consensus.
Lobe-based Quantitative Visual Assessment of CT Images
Four radiologists performed visual assessment: Reader 1 (J.B.S) was a chest radiologist with 12 years of experience and was involved in the generation of the standard images. Reader 2 (H.Y.L) and reader 3 (S.S.K) were also chest radiologists with 5 and 8 years of experience, respectively. Reader 4 (D.V.N) was a 3rd-year resident in radiology. Image data sets were presented to each reader by using software (AquariusNET; TeraRecon, San Mateo, Calif). Images were not grouped according to GOLD stage for reading but were presented in random order to the readers. The high-frequency algorithm and the whole CT image data were used for visual analysis. Expiratory volumetric CT data were assessed after evaluation of inspiratory volumetric CT data. There was no time limitation for the lobe-based quantitative visual assessment per reader, and time needed to complete the readings was not recorded. The CT images were visually inspected by using a window width of 1500 HU and a window level of −700 HU.
For the lobe-based visual assessment of emphysema, readers were asked to determine the type of emphysema as centrilobular, panlobular, or mixed. The extent of emphysema in each lobe was also assessed by using a six-point scale system: 0%, 1%–5%, 6%–25%, 26%–50%, 51%–75%, and greater than 75%. The lingula was considered a different lobe, resulting in six lobes for each case. The presence of airway changes, including bronchial wall thickening, bronchiectasis, and bronchial wall irregularity, was also determined in each lobe. The presence of centrilobular nodules, saber-sheath trachea, tracheal outpouching, paraseptal emphysema, and mosaic attenuation pattern at inspiration CT was also assessed. The presence of expiratory air trapping and tracheobronchomalacia was assessed by comparison of inspiration and expiration CT images. The readers were blinded to any clinical and functional information. Finally, the readers were asked to categorize the imaging features of each participant into one of the following predominant phenotypes: normal, emphysema dominant, airway dominant, and mixed phenotype.
CT Measurements
Whole volumetric CT images for quantitative analysis were reconstructed by using a standard algorithm. With use of commercial software (Pulmonary Workstation, Vida Diagnostics, Coralville, Iowa), the extent of emphysema, airway wall thickening, luminal area, and wall area were quantitatively measured at the lobar level (26–29). The software automatically calculated the emphysema index, which is defined as the percentage of lung voxels less than −950 HU at inspiratory CT. Quantitative assessment of airway dimensions was performed in the fourth (segmental), fifth, and sixth (subsegmental) generations of the following bronchial pathways: RB1 (apical segment of the right upper lobe), RB4 (lateral segment of the right middle lobe), RB10 (posterobasal segment of the right lower lobe), LB1 (apicoposterior segment of the left upper lobe), LB4 (superior segment of the lingula), and LB10 (posterobasal segment of the left lower lobe). In each segmental pathway, airway dimensions, including wall area, luminal area, and wall area percentage, were measured. The wall area, or WA, percentage, or WA%, was defined as follows: WA% = WA/(WA + LA) × 100, where LA is luminal area (30). The mean value of the measured dimensions of the fourth, fifth, and sixth generations of bronchi in a given segmental pathway was used for statistical analysis. All CT measurements were processed by research analysts who were blinded to the results of pulmonary function tests and visual assessments.
Pulmonary Function Test
Spirometry was conducted as recommended by the American Thoracic Society, and all spirometry data were collected by using a portable spirometer (EasyOne Spirometer; NDD Medical Technologies, Andover, Mass) (21,31). The following values were evaluated: forced expiratory volume in 1 second (FEV1) and the FEV1/forced vital capacity (FVC) ratio. All spirometric values were expressed as percentage of predicted values. Pulmonary function tests were performed on average within 1.8 days of volumetric CT (median, 0 day), and 85% of the tests were performed on the same day.
Statistical Analysis
All statistical analyses were performed with software (SPSS, version 12.1.1; SPSS, Chicago, Ill). The Cohen κ statistic was used to measure the interreader agreement of the visual assessment (emphysema, airway dimension, centrilobular nodules, tracheal abnormality, tracheomalacia, and COPD phenotypes). Linearly weighted κ statistics were used to measure the interreader agreement of the emphysema extent. To obtain an overall κ value among the four readers, we used the Light k, calculated as the mean of six combinations of pairwise κ values among four readers.
The Spearman rank test was used to assess the correlation of the visual data (averaged over four readers) and quantitative emphysema index for the extent of emphysema based on each lobe. For the left upper lobe, we obtained the mean of the extent of visual emphysema for the upper division of the left upper lobe and the lingula; we then assessed the correlation with quantitative emphysema index in the left lower lobe. The visual extent of emphysema for the whole lung was calculated by adding the six-point scale scores in six lobes. Correlation between the visual extent of emphysema and each physiologic parameter was determined with the Spearman correlation analysis. We also assessed the correlation between the emphysema index at quantitative CT and each physiologic parameter. Significant differences in airway dimensions at lobe-based visual assessment were evaluated with independent t tests for quantitative measurement with CT. If at least one of the readers determined that a lobe had an airway abnormality, the result was regarded as positive. The Spearman correlation analysis was used to evaluate the relationship between the number of lobes with bronchial wall thickening and physiologic parameters.
We conducted Pearson and Spearman correlation analyses to evaluate the correlation between the wall area percentage and physiologic parameters. To assess the correlation between spirometric measures and visual and quantitative CT parameters, simple and multiple regression analyses were used. The simple linear regression analyses were used to examine the effect sizes of a single visual or quantitative CT parameter, and the multiple linear regression analyses were used to examine the effect sizes of all visual and quantitative CT parameters combined. The outcomes of interest were FEV1 and FEV1/FVC ratio. Assessment of the correlation between the presence of centrilobular nodules and pack-years was performed by using Spearman correlation analysis. We used the Student t test to assess the difference in the number of lobes with airway wall thickening; emphysema index; and physiologic parameters according to the presence or absence of tracheal abnormality, paraseptal emphysema, mosaic attenuation pattern, expiratory air trapping, and tracheobronchomalacia. One-way analysis of variance was performed to determine any differences in the emphysema index and the number of lobes with visual bronchial wall thickening among the four different phenotypes. Final phenotype assignments were made with the agreement of at least three independent readers. If more than two independent readers disagreed, phenotypes were determined through a subsequent case review and adjudication by one of the readers (S.S.K). A P value of less than .05 was considered to indicate a significant difference.
Results
Emphysema
For visual assessment, the interreader agreement on the type of emphysema was good (κ = 0.63) and the extent of emphysema in each lobe showed good agreement among readers (mean weighted κ = 0.70) (Table 1). The Spearman correlation coefficients for the relationships between the mean extent of emphysema in each lobe at visual assessment and lobe-based emphysema index at quantitative CT measurements were 0.77 (right upper lobe), 0.52 (right middle lobe), 0.71 (right lower lobe), 0.71 (left upper lobe), and 0.68 (left lower lobe) (all P < .001). The correlation coefficient for the visual extent of emphysema in the whole lung showed good correlation with emphysema index (r = 0.75, P < .001). The Spearman rank test showed that the extent of emphysema at visual assessment correlated relatively well with each physiologic parameter; the correlation coefficient ranged between 0.67 (for GOLD stage) and −0.74 (for FEV1/FVC ratio). These correlations were similar to the correlations between emphysema index at quantitative CT measurement and each physiologic parameter (P < .001) (Table 2). After adjustment for other visual and quantitative analyses, visual assessment of extent of emphysema and emphysema index (quantitative CT) were independently and significantly associated with FEV1 and FEV1/FVC ratio in multiple regression analyses (Table 3).
Table 1.
Mean Interreader Agreement for Visual Assessment of Emphysema and Airway Dimensions
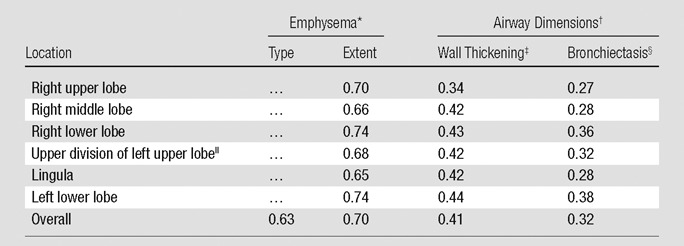
Mean κ coefficient for interreader agreement for the type and extent of emphysema at visual assessment.
Mean κ coefficient for interreader agreement for wall thickening and bronchiectasis at visual assessment.
Diameter ratio of inner to outer lumen of less than 0.8 and extensive involvement.
Visibility of bronchus in the outer third of the lung or diameter of inner lumen greater than that of the accompanying pulmonary artery and more than 50% of a segment affected.
Comprises anterior and apicoposterior segments.
Table 2.
Correlation between Physiologic Parameters and Image-based Disease Severity
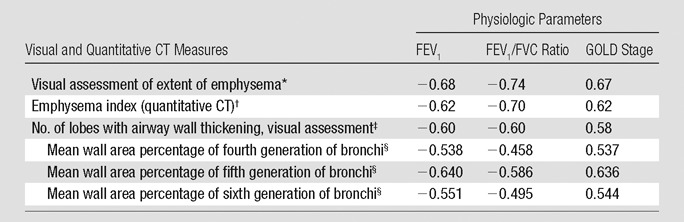
Note.—Image-based severity includes visual and computerized measures of emphysema extent and airway wall thickening.
Spearman correlation coefficient for the correlation between the extent of emphysema at visual assessment and each physiologic parameter (all P < .001).
Pearson and Spearman correlation coefficients for the correlation between emphysema index at quantitative CT and each physiologic parameter (all P < .001).
Spearman correlation coefficient for the correlation between the number of lobes with wall thickening and each physiologic parameter (all P < .001).
Pearson and Spearman correlation coefficients for the correlation between the wall area percentage and physiologic parameters (all P < .001)
Table 3.
Results of Simple and Multiple Regression Analyses for Visual and Quantitative Measurement Contributions to Physiologic Parameters
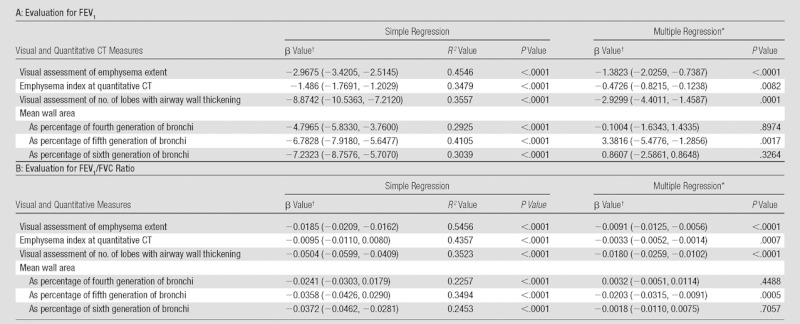
Adjusted R 2 for multiple regression analysis for FEV1 was 0.6832, and that for FEV1/FVC ratio was 0.7205.
Numbers in parentheses are 95% confidence intervals.
Airway Dimensions
At visual assessment for airway dimensions, the mean interreader agreement for wall thickening and bronchiectasis was fair (κ = 0.41 and 0.32, respectively) (Table 1). The mean measured wall area percentage in lobes that had visually normal bronchial walls was significantly smaller than that in patients with bronchial wall thickening at visual assessment (t test, all P < .01) (Table 4). The measured bronchial luminal area in each lobe with visually normal bronchial lumens was significantly smaller than that in patients with visually determined bronchial dilation (t test, all P < .01 except lingula lobe) (Table 4). On the Spearman rank test, the number of lobes with bronchial wall thickening at visual assessment showed moderate correlation with each physiologic parameter; the correlation coefficients ranged between 0.58 (for GOLD stage, P < .001) and −0.60 (for FEV1 and FEV1/FVC ratio, P < .001) (Table 2). The correlation coefficients between the wall area percentage and each physiologic parameter ranged between −0.458 (for FEV1/FVC, P < .001) at the fourth generation of segmental bronchi and −0.640 (for FEV1, P < .001) at the fifth generation (Table 2). After adjustment for other visual and quantitative analyses, the number of lobes with visually identified airway wall thickening and quantitative measurement of wall area percentage in fifth-generation bronchi were independently and significantly associated with FEV1 and FEV1/FVC ratio in multiple regression analyses (Table 3).
Table 4.
Difference in Quantitative Airway Measurement Result according to Visual Assessment Result
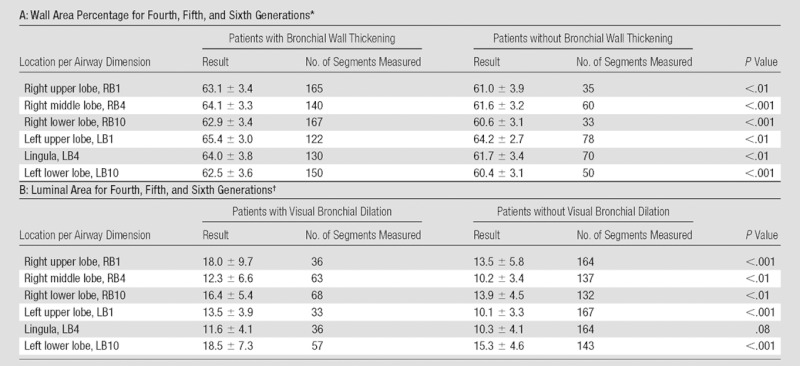
Note.—The P values were determined with the t test. LB1 = apicoposterior segment of the left upper lobe; LB4 = superior segment of the lingula; LB10 = posterobasal segment of the left lower lobe; RB1 = apical segment of the right upper lobe; RB4 = lateral segment of the right middle lobe; RB10 = posterobasal segment of the right lower lobe.
The mean wall area percentages are expressed as means ± standard deviations, as percentages.
The mean luminal areas are expressed as means ± standard deviations, in square millimeters.
Other COPD-related Findings
The mean interreader agreement for the presence of centrilobular nodules was fair (κ = 0.25). The presence of centrilobular nodules correlated weakly with the number of pack-years (r = −0.18, P = .013), and centrilobular nodules were not more common in current smokers. Tracheal abnormality was detected in 19.5% of the participants, and a saber-sheath or outpouching appearance of tracheal abnormality (κ = 0.48) and tracheomalacia (κ = 0.46) showed moderate interreader agreement. Participants with a tracheal abnormality showed more lobes with airway wall thickening, more severe emphysema, and higher GOLD stage (t test, all P < .05). Physiologic parameters did not differ significantly between participants with paraseptal emphysema, mosaic attenuation pattern, expiratory air trapping, and tracheobronchomalacia and those without.
Comparison of Emphysema Index and Wall Thickening among the Different Phenotypes
At visual assessment of COPD phenotypes, the interreader agreement for four different phenotypes was moderate (κ = 0.47). Among the four groups, emphysema indexes in patients with normal and airway-dominant phenotypes were significantly lower than those in patients with emphysema-dominant and mixed COPD phenotypes (one-way analysis of variance, P < .001 (Figure). The mean number of lobes with bronchial wall thickening in patients with normal and emphysema-dominant phenotypes was significantly lower than that in patients with airway-dominant and mixed COPD phenotypes (one-way analysis of variance, P < .001) ) (Fig 1).
Figure a:

Results of analysis of variance among the phenotypes of COPD represented as 0, normal; 1, emphysema dominant; 2, airway dominant; 3, mixed pattern of emphysema and airway dominant. (a) Emphysema index (EI) in total lung. Among the four phenotype groups, emphysema indexes in patients with normal and airway-dominant phenotype were significantly lower than those in patients with emphysema-dominant and mixed COPD phenotype (P < .001). (b) Mean number of lobes with visual bronchial wall thickening. Among the four groups, mean numbers of lobes in patients with normal and emphysema-dominant phenotype were significantly lower than those in patients with airway-dominant and mixed COPD phenotype (P < .001). Error bars represent means and standard deviations.
Figure b:

Results of analysis of variance among the phenotypes of COPD represented as 0, normal; 1, emphysema dominant; 2, airway dominant; 3, mixed pattern of emphysema and airway dominant. (a) Emphysema index (EI) in total lung. Among the four phenotype groups, emphysema indexes in patients with normal and airway-dominant phenotype were significantly lower than those in patients with emphysema-dominant and mixed COPD phenotype (P < .001). (b) Mean number of lobes with visual bronchial wall thickening. Among the four groups, mean numbers of lobes in patients with normal and emphysema-dominant phenotype were significantly lower than those in patients with airway-dominant and mixed COPD phenotype (P < .001). Error bars represent means and standard deviations.
Discussion
In this study, we demonstrated that with use of standard reference images, findings from lobe-based visual assessment of volumetric CT in COPD not only correlated well with quantitative CT results and physiologic parameters but also provided additional direct information in regard to the type of emphysema and current morphologic abnormality in small and large airways.
In COPD, quantitative assessment of airflow limitation caused by a mixture of small-airway diseases and parenchymal destruction has been an important issue. Even though spirometry is essential for diagnosis and provides a useful description of the severity of pathologic changes in COPD, the FEV1 and FEV1/FVC ratio alone usually do not reflect the range of pathophysiologic abnormalities in COPD, a heterogeneous condition (32–34). Lung densitometry with CT has yielded valuable data for measurement of the extent of emphysema (34–38). In this study, emphysema index determined from quantitative CT measurements at the lobar level also showed moderate to good correlation with each physiologic parameter (Table 2). However, in addition to the many sources of error and variability in the quantitative assessments performed by using CT, emphysema index cannot be used to characterize features of emphysema, such as size of emphysematous lesions and subtype of emphysema (eg, centrilobular, panlobular), which may be important in the management (treatment and watchful waiting) of disease (2,39–43).
On the other hand, visual assessment of COPD can be used to evaluate the severity of emphysema and bronchial wall thickening. It also has an advantage for depicting and describing many accompanying pathologic changes in the small and large airways, as well as the parenchyma (17–20,44–48). Furthermore, COPD is not simply a homogeneous, irreversible airflow limitation. The relatively independent contributions of these pathologic changes toward airflow limitation manifest as clinical features that differ among individual patients. Therein lies the value of using visual assessment in addition to quantitative analysis (49,50). However, the main disadvantage of visual assessment has been the relatively low interreader agreement (51,52). Therefore, standard reference images were used to apply to lobe-based visual assessment of COPD, even though we did not test the agreement of reference images with written definitions of visual findings for this study. Reference images may have contributed to the relatively high interreader agreement in this study (mean weighted κ = 0.70) compared with agreement in previous studies by Bankier et al (52) (weighted κ range, 0.43–0.58) and Cavigli et al (51) (κ = 0.20). Our study also demonstrated good correlation not only between lobe-based visual extent of emphysema and lobe-based emphysema index from quantitative CT but also between the lobe-based visual extent of emphysema and the physiologic measurements. Furthermore, correlation values between visual assessment and physiologic measurements were similar to those obtained with emphysema index (Table 2).
In a previous study, visual assessment of bronchial wall thickening was highly subjective and poorly reproducible (53). Similarly, in our study, the interreader agreement for the visual assessment of airway dimensions was only fair, despite the use of standard reference images. However, the presence of bronchial wall thickening or bronchiectasis seen at lobe-based visual assessment was associated with significant differences in the quantitative airway dimensions. Researchers in previous studies showed a significant but moderate degree of negative correlation between airway wall thickening and pulmonary function test results (5–7). Similarly, in the present study, the number of lobes with bronchial wall thickening at visual assessment showed moderate correlation with physiologic parameters. Interestingly, these correlations were slightly stronger than correlations between wall area percentage and physiologic parameters at the fourth to sixth generations of segmental bronchus, although the comparison condition is not the same (Table 2). We speculate that visual assessment for the extent of airway involvement (the number of lobes with bronchial wall thickening) may be more sensitive to airway abnormality than existing quantitative severity (wall area percentage) measures. This may be because quantitative measures are difficult to normalize for patient-related parameters, such as height, sex, and depth of inspiration. Quantitative CT extent of emphysema and airway parameters has been shown to be associated with the frequency of COPD exacerbation (22). Because quantitative CT measurement is not yet routinely available at the workstation, we speculate that standardized visual assessment of emphysema and airway abnormality may provide clinically relevant information on the likelihood of exacerbation and physiologic impairment.
Another advantage of lobe-based visual assessment of CT in COPD is that it permits characterization of predominant CT phenotype. The overall visual CT phenotypes of COPD and the presence of tracheal abnormality were significantly related to physiologic impairment; however, there is no currently accepted set of COPD phenotypes that is based on quantitative CT. Classification of COPD on the basis of the GOLD stage may not reflect phenotypic heterogeneity, and even in the same disease state the extent of emphysema varies widely between the emphysema and the nonemphysema phenotypes (54,55). Indeed, the relatively weak correlation between visual CT findings and GOLD stage found in our study is probably owing to the known wide variation in severity of emphysema across GOLD stages (55). It has been proposed that image-based diagnosis of COPD phenotype would be very useful in predicting the effect of treatment or determining the appropriate disease management strategy (56–60). Our study results suggested that visual assessment of CT may help differentiate emphysema- and airway-dominant COPD phenotypes, with moderate interreader agreement, associated with differences in quantitative indexes of emphysema and airway wall thickening. We anticipate that use of visual phenotypic characterization with a larger data set will improve understanding of the clinical and prognostic importance of these phenotypes. In addition, visual characterization of patterns of emphysema may permit better elucidation of underlying disease pathogenesis and may even lead to identification of new genetic markers, analogous to the identification of α1-antitrypsin deficiency in patients with basal predominant panlobular emphysema.
Our study had some limitations. We did not perform a power analysis to determine an appropriate sample size for visual assessment; however, we believed that 200 participants provided an appropriate sample for analysis. The standard reference images for COPD were created by two experts and may require further verification. In particular, airway wall thickening has many subjective aspects, and generation of appropriate standard images for assessment of airway wall thickening may require additional verification by other experts before they can be widely used in clinical practice.
We conclude that visual assessment of emphysema and airways disease in individuals with COPD can provide reproducible, physiologically significant information that may complement results of quantitative CT assessment.
With use of standard reference images, lobe-based visual assessment of volumetric CT in COPD not only correlated well with quantitative CT findings and physiologic parameters but also provided additional direct information on the type of emphysema and current morphologic abnormality in small and large airways.
Advances in Knowledge.
• The extent of emphysema, which was visually assessed on a six-point scale, showed good observer agreement (mean weighted κ = 0.70) and correlated relatively well with findings at quantitative CT (Spearman correlation test, r = 0.75; P < .001), forced expiratory volume in 1 second (FEV1) (r = −0.68; P < .001), FEV1/ forced vital capacity (FVC) ratio (r = −0.74; P < .001), and Global Initiative for Obstructive Lung Disease (GOLD) stage (r = 0.67; P < .001).
• The number of lobes with thickened bronchial walls at visual evaluation correlated moderately with GOLD stage (r = 0.58), FEV1 (r = −0.60), and FEV1/FVC ratio (r = −0.60) (all P < .001).
• The presence of centrilobular nodules correlated weakly with the number of pack-years (r = −0.18; P = .013), and centrilobular nodules were not more common in current smokers.
• Tracheal abnormality was detected in 19.5% of the patients, and patients with a tracheal abnormality showed more lobes with airway wall thickening, more severe emphysema, and higher GOLD stage (t test, all P < .05).
• Emphysema indexes in patients with normal and airway-dominant phenotypes were significantly lower than those in patients with emphysema-dominant and mixed chronic obstructive pulmonary disease (COPD) phenotypes (P < .001); the mean numbers of lobes with bronchial wall thickening in patients with normal and emphysema-dominant phenotypes were significantly lower than those in patients with airway-dominant and mixed COPD phenotypes (P < .001).
Implication for Patient Care.
• Lobe-based visual assessment of volumetric computed tomography in chronic obstructive pulmonary disease with standard reference images may be used to evaluate the severity of emphysema and bronchial wall thickening and can depict and help describe many accompanying changes in the small and large airways and lung parenchyma.
Disclosures of Conflicts of Interest: S.S.K. No relevant conflicts of interest to disclose. J.B.S. No relevant conflicts of interest to disclose. H.Y.L. No relevant conflicts of interest to disclose. D.V.N. No relevant conflicts of interest to disclose. A.V.F. No relevant conflicts of interest to disclose. J.D.C. No relevant conflicts of interest to disclose. J.D.S. No relevant conflicts of interest to disclose. D.A.L. Financial activities related to the present article: institution received a grant from Siemens. Financial activities not related to the present article: was paid consultancy fees by Perceptive Imaging, Intermune, and Gilead; institution received a grant from Centocor. Other relationships: none to disclose.
Supplementary Material
Acknowledgments
The authors gratefully acknowledge the investigators and participants in the COPDGene study and the assistance of Douglas Stinson, manager of the Quantitative Imaging Laboratory, National Jewish Health, Denver, Colo.
Received February 17, 2012; revision requested April 25; final revision received June 28; accepted July 24; final version accepted August 14.
Funding: This research was supported by the National Institutes of Health (grants U01 HL089856 and U01 HL089897).
Abbreviations:
- COPD
- chronic obstructive pulmonary disease
- FEV1
- forced expiratory volume in 1 second
- FVC
- forced vital capacity
- GOLD
- Global Initiative for Obstructive Lung Disease
References
- 1.Asia Pacific COPD Roundtable Group Global Initiative for Chronic Obstructive Lung Disease strategy for the diagnosis, management and prevention of chronic obstructive pulmonary disease: an Asia-Pacific perspective. Respirology 2005;10(1):9–17 [DOI] [PMC free article] [PubMed] [Google Scholar]
- 2.Gevenois PA, de Maertelaer V, De Vuyst P, Zanen J, Yernault JC. Comparison of computed density and macroscopic morphometry in pulmonary emphysema. Am J Respir Crit Care Med 1995;152(2):653–657 [DOI] [PubMed] [Google Scholar]
- 3.Gevenois PA, De Vuyst P, de Maertelaer V, et al. Comparison of computed density and microscopic morphometry in pulmonary emphysema. Am J Respir Crit Care Med 1996;154(1):187–192 [DOI] [PubMed] [Google Scholar]
- 4.Madani A, Zanen J, de Maertelaer V, Gevenois PA. Pulmonary emphysema: objective quantification at multi-detector row CT—comparison with macroscopic and microscopic morphometry. Radiology 2006;238(3):1036–1043 [DOI] [PubMed] [Google Scholar]
- 5.Deveci F, Murat A, Turgut T, Altuntaş E, Muz MH. Airway wall thickness in patients with COPD and healthy current smokers and healthy non-smokers: assessment with high resolution computed tomographic scanning. Respiration 2004;71(6):602–610 [DOI] [PubMed] [Google Scholar]
- 6.Nakano Y, Müller NL, King GG, et al. Quantitative assessment of airway remodeling using high-resolution CT. Chest 2002;122(6 suppl):271S–275S [PubMed] [Google Scholar]
- 7.Hasegawa M, Nasuhara Y, Onodera Y, et al. Airflow limitation and airway dimensions in chronic obstructive pulmonary disease. Am J Respir Crit Care Med 2006;173(12):1309–1315 [DOI] [PubMed] [Google Scholar]
- 8.Lee YK, Oh YM, Lee JH, et al. Quantitative assessment of emphysema, air trapping, and airway thickening on computed tomography. Lung 2008;186(3):157–165 [DOI] [PubMed] [Google Scholar]
- 9.Park YS, Seo JB, Kim N, et al. Texture-based quantification of pulmonary emphysema on high-resolution computed tomography: comparison with density-based quantification and correlation with pulmonary function test. Invest Radiol 2008;43(6):395–402 [DOI] [PubMed] [Google Scholar]
- 10.Gierada DS, Slone RM, Bae KT, Yusen RD, Lefrak SS, Cooper JD. Pulmonary emphysema: comparison of preoperative quantitative CT and physiologic index values with clinical outcome after lung-volume reduction surgery. Radiology 1997;205(1):235–242 [DOI] [PubMed] [Google Scholar]
- 11.Martinez FJ, Foster G, Curtis JL, et al. Predictors of mortality in patients with emphysema and severe airflow obstruction. Am J Respir Crit Care Med 2006;173(12):1326–1334 [DOI] [PMC free article] [PubMed] [Google Scholar]
- 12.Newell JD, Jr, Hogg JC, Snider GL. Report of a workshop: quantitative computed tomography scanning in longitudinal studies of emphysema. Eur Respir J 2004;23(5):769–775 [DOI] [PubMed] [Google Scholar]
- 13.Kim N, Seo JB, Song KS, Chae EJ, Kang SH. Semi-automatic measurement of the airway dimension by computed tomography using the full-with-half-maximum method: a study of the measurement accuracy according to the orientation of an artificial airway. Korean J Radiol 2008;9(3):236–242 [DOI] [PMC free article] [PubMed] [Google Scholar]
- 14.Stoel BC, Vrooman HA, Stolk J, Reiber JH. Sources of error in lung densitometry with CT. Invest Radiol 1999;34(4):303–309 [DOI] [PubMed] [Google Scholar]
- 15.Stoel BC, Stolk J. Optimization and standardization of lung densitometry in the assessment of pulmonary emphysema. Invest Radiol 2004;39(11):681–688 [DOI] [PubMed] [Google Scholar]
- 16.Parr DG, Stoel BC, Stolk J, Nightingale PG, Stockley RA. Influence of calibration on densitometric studies of emphysema progression using computed tomography. Am J Respir Crit Care Med 2004;170(8):883–890 [DOI] [PubMed] [Google Scholar]
- 17.Goddard PR, Nicholson EM, Laszlo G, Watt I. Computed tomography in pulmonary emphysema. Clin Radiol 1982;33(4):379–387 [DOI] [PubMed] [Google Scholar]
- 18.Roberts HR, Wells AU, Milne DG, et al. Airflow obstruction in bronchiectasis: correlation between computed tomography features and pulmonary function tests. Thorax 2000;55(3):198–204 [DOI] [PMC free article] [PubMed] [Google Scholar]
- 19.Copley SJ, Wells AU, Müller NL, et al. Thin-section CT in obstructive pulmonary disease: discriminatory value. Radiology 2002;223(3):812–819 [DOI] [PubMed] [Google Scholar]
- 20.Aziz ZA, Wells AU, Desai SR, et al. Functional impairment in emphysema: contribution of airway abnormalities and distribution of parenchymal disease. AJR Am J Roentgenol 2005;185(6):1509–1515 [DOI] [PubMed] [Google Scholar]
- 21.Regan EA, Hokanson JE, Murphy JR, et al. Genetic epidemiology of COPD (COPDGene) study design. COPD 2010;7(1):32–43 [DOI] [PMC free article] [PubMed] [Google Scholar]
- 22.Han MK, Kazerooni EA, Lynch DA, et al. Chronic obstructive pulmonary disease exacerbations in the COPDGene study: associated radiologic phenotypes. Radiology 2011;261(1):274–282 [DOI] [PMC free article] [PubMed] [Google Scholar]
- 23.Greene R. “Saber-sheath” trachea: relation to chronic obstructive pulmonary disease. AJR Am J Roentgenol 1978;130(3):441–445 [DOI] [PubMed] [Google Scholar]
- 24.Gronner AT, Trevino RJ. Tracheocoele. Br J Radiol 1971;44(528):979–981 [DOI] [PubMed] [Google Scholar]
- 25.Hansell DM, Bankier AA, MacMahon H, McLoud TC, Müller NL, Remy J. Fleischner Society: glossary of terms for thoracic imaging. Radiology 2008;246(3):697–722 [DOI] [PubMed] [Google Scholar]
- 26.Tschirren J, Hoffman EA, McLennan G, Sonka M. Segmentation and quantitative analysis of intrathoracic airway trees from computed tomography images. Proc Am Thorac Soc 2005;2(6):484–487, 503–504 [DOI] [PMC free article] [PubMed] [Google Scholar]
- 27.Palágyi K, Tschirren J, Hoffman EA, Sonka M. Quantitative analysis of pulmonary airway tree structures. Comput Biol Med 2006;36(9):974–996 [DOI] [PubMed] [Google Scholar]
- 28.Zhang L, Hoffman EA, Reinhardt JM. Atlas-driven lung lobe segmentation in volumetric x-ray CT images. IEEE Trans Med Imaging 2006;25(1):1–16 [DOI] [PubMed] [Google Scholar]
- 29.Hoffman EA, Simon BA, McLennan G. State of the art: a structural and functional assessment of the lung via multidetector-row computed tomography—phenotyping chronic obstructive pulmonary disease. Proc Am Thorac Soc 2006;3(6):519–532 [DOI] [PMC free article] [PubMed] [Google Scholar]
- 30.Okazawa M, Müller N, McNamara AE, Child S, Verburgt L, Paré PD. Human airway narrowing measured using high resolution computed tomography. Am J Respir Crit Care Med 1996;154(5):1557–1562 [DOI] [PubMed] [Google Scholar]
- 31.Standardization of spirometry, 1994 update American Thoracic Society. Am J Respir Crit Care Med 1995;152(3):1107–1136 [DOI] [PubMed] [Google Scholar]
- 32.Stockley RA, Mannino D, Barnes PJ. Burden and pathogenesis of chronic obstructive pulmonary disease. Proc Am Thorac Soc 2009;6(6):524–526 [DOI] [PubMed] [Google Scholar]
- 33.Roy K, Smith J, Kolsum U, Borrill Z, Vestbo J, Singh D. COPD phenotype description using principal components analysis. Respir Res 2009;10:41 http://respiratory-research.com/content/10/1/41. doi:10.1186/1465-9921-10-41. Published May 29, 2009. Accessed 2012 [DOI] [PMC free article] [PubMed] [Google Scholar]
- 34.Bergin C, Müller N, Nichols DM, et al. The diagnosis of emphysema: a computed tomographic-pathologic correlation. Am Rev Respir Dis 1986;133(4):541–546 [DOI] [PubMed] [Google Scholar]
- 35.Dirksen A, Dijkman JH, Madsen F, et al. A randomized clinical trial of alpha(1)-antitrypsin augmentation therapy. Am J Respir Crit Care Med 1999;160(5 pt 1):1468–1472 [DOI] [PubMed] [Google Scholar]
- 36.Dowson LJ, Guest PJ, Stockley RA. Longitudinal changes in physiological, radiological, and health status measurements in alpha(1)-antitrypsin deficiency and factors associated with decline. Am J Respir Crit Care Med 2001;164(10 pt 1):1805–1809 [DOI] [PubMed] [Google Scholar]
- 37.Müller NL, Staples CA, Miller RR, Abboud RT. “Density mask”: an objective method to quantitate emphysema using computed tomography. Chest 1988;94(4):782–787 [DOI] [PubMed] [Google Scholar]
- 38.Gevenois PA, De Vuyst P, Sy M, et al. Pulmonary emphysema: quantitative CT during expiration. Radiology 1996;199(3):825–829 [DOI] [PubMed] [Google Scholar]
- 39.Camiciottoli G, Bartolucci M, Maluccio NM, et al. Spirometrically gated high-resolution CT findings in COPD: lung attenuation vs lung function and dyspnea severity. Chest 2006;129(3):558–564 [DOI] [PubMed] [Google Scholar]
- 40.Klein JS, Gamsu G, Webb WR, Golden JA, Müller NL. High-resolution CT diagnosis of emphysema in symptomatic patients with normal chest radiographs and isolated low diffusing capacity. Radiology 1992;182(3):817–821 [DOI] [PubMed] [Google Scholar]
- 41.Heremans A, Verschakelen JA, Van Fraeyenhoven L, Demedts M. Measurement of lung density by means of quantitative CT scanning: a study of correlations with pulmonary function tests. Chest 1992;102(3):805–811 [DOI] [PubMed] [Google Scholar]
- 42.Fishman A, Martinez F, Naunheim K, et al. A randomized trial comparing lung-volume-reduction surgery with medical therapy for severe emphysema. N Engl J Med 2003;348(21):2059–2073 [DOI] [PubMed] [Google Scholar]
- 43.Stoller JK, Gildea TR, Ries AL, Meli YM, Karafa MT; National Emphysema Treatment Trial Research Group. Lung volume reduction surgery in patients with emphysema and alpha-1 antitrypsin deficiency. Ann Thorac Surg 2007;83(1):241–251 [DOI] [PubMed] [Google Scholar]
- 44.Verschakelen JA, Scheinbaum K, Bogaert J, Demedts M, Lacquet LL, Baert AL. Expiratory CT in cigarette smokers: correlation between areas of decreased lung attenuation, pulmonary function tests and smoking history. Eur Radiol 1998;8(8):1391–1399 [DOI] [PubMed] [Google Scholar]
- 45.Berger P, Laurent F, Begueret H, et al. Structure and function of small airways in smokers: relationship between air trapping at CT and airway inflammation. Radiology 2003;228(1):85–94 [DOI] [PubMed] [Google Scholar]
- 46.Kauczor HU, Hast J, Heussel CP, Schlegel J, Mildenberger P, Thelen M. Focal airtrapping at expiratory high-resolution CT: comparison with pulmonary function tests. Eur Radiol 2000;10(10):1539–1546 [DOI] [PubMed] [Google Scholar]
- 47.Hansell DM. Small airways diseases: detection and insights with computed tomography. Eur Respir J 2001;17(6):1294–1313 [DOI] [PubMed] [Google Scholar]
- 48.Webb WR. Thin-section CT of the secondary pulmonary lobule: anatomy and the image—the 2004 Fleischner lecture. Radiology 2006;239(2):322–338 [DOI] [PubMed] [Google Scholar]
- 49.Tatsumi K, Kasahara Y, Kurosu K, et al. Clinical phenotypes of COPD: results of a Japanese epidemiological survey. Respirology 2004;9(3):331–336 [DOI] [PubMed] [Google Scholar]
- 50.Nakano Y, Muro S, Sakai H, et al. Computed tomographic measurements of airway dimensions and emphysema in smokers: correlation with lung function. Am J Respir Crit Care Med 2000;162(3 pt 1):1102–1108 [DOI] [PubMed] [Google Scholar]
- 51.Cavigli E, Camiciottoli G, Diciotti S, et al. Whole-lung densitometry versus visual assessment of emphysema. Eur Radiol 2009;19(7):1686–1692 [DOI] [PubMed] [Google Scholar]
- 52.Bankier AA, De Maertelaer V, Keyzer C, Gevenois PA. Pulmonary emphysema: subjective visual grading versus objective quantification with macroscopic morphometry and thin-section CT densitometry. Radiology 1999;211(3):851–858 [DOI] [PubMed] [Google Scholar]
- 53.Park JW, Hong YK, Kim CW, Kim DK, Choe KO, Hong CS. High-resolution computed tomography in patients with bronchial asthma: correlation with clinical features, pulmonary functions and bronchial hyperresponsiveness. J Investig Allergol Clin Immunol 1997;7(3):186–192 [PubMed] [Google Scholar]
- 54.Bafadhel M, Umar I, Gupta S, et al. The role of CT scanning in multidimensional phenotyping of COPD. Chest 2011;140(3):634–642 [DOI] [PMC free article] [PubMed] [Google Scholar]
- 55.Makita H, Nasuhara Y, Nagai K, et al. Characterisation of phenotypes based on severity of emphysema in chronic obstructive pulmonary disease. Thorax 2007;62(11):932–937 [DOI] [PMC free article] [PubMed] [Google Scholar]
- 56.Kitaguchi Y, Fujimoto K, Kubo K, Honda T. Characteristics of COPD phenotypes classified according to the findings of HRCT. Respir Med 2006;100(10):1742–1752 [DOI] [PubMed] [Google Scholar]
- 57.Lee JH, Lee YK, Kim EK, et al. Responses to inhaled long-acting beta-agonist and corticosteroid according to COPD subtype. Respir Med 2010;104(4):542–549 [DOI] [PubMed] [Google Scholar]
- 58.Matsuoka S, Yamashiro T, Washko GR, Kurihara Y, Nakajima Y, Hatabu H. Quantitative CT assessment of chronic obstructive pulmonary disease. RadioGraphics 2010;30(1):55–66 [DOI] [PubMed] [Google Scholar]
- 59.Marsh SE, Travers J, Weatherall M, et al. Proportional classifications of COPD phenotypes. Thorax 2008;63(9):761–767 [DOI] [PMC free article] [PubMed] [Google Scholar]
- 60.Han MK, Agusti A, Calverley PM, et al. Chronic obstructive pulmonary disease phenotypes: the future of COPD. Am J Respir Crit Care Med 2010;182(5):598–604 [DOI] [PMC free article] [PubMed] [Google Scholar]
Associated Data
This section collects any data citations, data availability statements, or supplementary materials included in this article.