Abstract
The resolution attainable with stimulated emission depletion (STED) microscopy greatly depends on the quality of the STED laser focus. So far, visual inspection of a measured STED focus has been the only convenient means of gauging the source of aberrations. Here we describe a method, requiring no instrument modifications, for obtaining an equivalent to the complex pupil function at the back aperture of the objective and show that it provides quantitative information about aberration sources (including aberrations induced by the objective or sample). We show the accuracy of this field representation to be sufficient for reconstructing the STED focus in three dimensions and determining corrective steps.
The past two decades have seen a revolution in far-field light microscopy. By targeted or stochastic switching of fluorescent probe molecules in the imaged sample, the diffraction limit has been overcome, resulting in spatial resolution more than 10-fold better than that achievable conventionally [1,2]. Stimulated emission depletion (STED) microscopy [3], the oldest of these techniques, has been shown to achieve <10 nm resolution [4] and has proven very successful in a multitude of biological applications [2].
In STED microscopy, fluorescent probes are excited by a diffraction-limited laser focus formed by a high-NA objective. A second, coaligned, ring-shaped and red-shifted laser focus—the “STED focus”—can stimulate emission in excited molecules and thereby suppress fluorescence emission. For high STED focus intensities, the stimulation process saturates, thus efficiently depleting molecules also at the flanks of the ring. This restricts fluorescence emission to a sub-diffraction-sized hole in the center of the STED focus ring.
Successful STED microscopy requires that the relative intensity in the ring center be as low as possible (ideally zero) to avoid fluorescence suppression at this location. As any optical aberrations may significantly compromise image resolution and signal intensity, the shape and quality of the STED focus is of paramount importance [5].
The typical method of analyzing STED focus quality is to scan a scattering sub-diffraction-sized particle such as a gold bead, manually inspecting the recorded STED focus intensity distribution, and taking measures to correct for focus deformations based on operator experience [6].
Here we demonstrate retrieval of the complex pupil function from the STED laser focus, recorded in three dimensions (3D) by scanning a light-scattering particle. This technique requires no changes to common STED setups. Utilizing a novel noise-suppression scheme, we demonstrate that the phase-retrieval algorithm described by Hanser et al. [7], which was originally conceived for regular wide-field detection point-spread functions, can be used for analyzing the STED illumination beam path.
To test our approach, STED focus intensity distributions were recorded with a STED microscope described previously [8]. Briefly, the laser beam (750 nm) from a mode-locked Ti:sapphire laser (Chameleon, Coherent Inc), passed through a single-mode fiber, was collimated and directed through a vortex phase mask (RPC Photonics). The plane of the vortex phase mask was imaged with a magnification of 1.83 into the back aperture plane of a 100 × /1.4 NA oil immersion lens (UPLSAPO100X-OPSF, Olympus; focal length f = 1.8 mm; refractive index n = 1.518) and focused into the sample. Half- and quarter-wave plates in the beam path assured circularly polarized light in the objective back aperture.
150 nm gold particles (C-Au-0.150, microspheresnanospheres) were attached to a #1.5 cover slip at low density using poly-L-lysine (P8920, Sigma-Aldrich) and mounted on a three-axis piezo stage (P-545.3D7, Physik Instrumente). Backscattered light from a single gold bead was detected by an avalanche photodiode (ARQ-13-FC, Perkin Elmer) through a 600 µm diameter multimode fiber (corresponding to ~6 Airy disk diameters, thus ensuring no significant pinhole effect in detection).
Images were obtained at 128 × 128 pixel format with a pixel size of dxy = 60 nm by scanning the stage at a scan rate of 100 lines/s. Images were recorded in five image planes at depths z ∈ {−1, −0.5, 0, 0.5, 1} µm relative to the focal point. To increase the signal-to-noise ratio (SNR), 50 frames were added together in each image plane. Another image stack (z-stack) was acquired after moving the vortex phase mask by 0.74 mm perpendicular to the optical axis with a micrometer screw. No significant drift was observed during the total acquisition time.
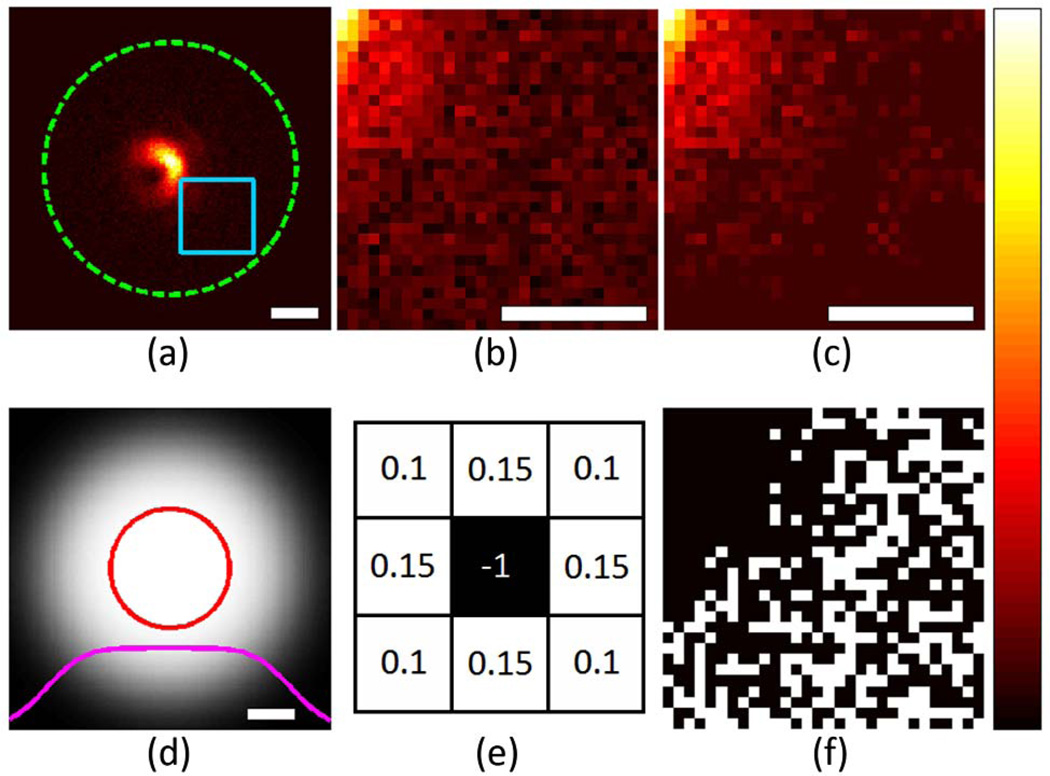
To achieve convergence in the phase-retrieval algorithm, it proved crucial to correct for the background and to minimize noise. For this purpose, we developed a filter approach that suppresses noise in areas of no significant signal without compromising spatial features of brighter image regions. First, an average background level estimated as the mean of all pixels outside a circular region of 3 µm radius [circle in Fig. 1(a)] was subtracted. Second, all images were multiplied by a circular step function (radius 3 µm), which was smoothed with a two-dimensional (2D) Gaussian function (standard deviation: 0.7 µm) shown in Fig. 1(d). Third, all pixels with resulting negative values were identified [Figs. 1(b) and 1(f)] and their signal redistributed onto the neighboring pixels by convolving them with the energy-neutral kernel shown in Fig. 1(e) and adding the result to the original image. This third step was repeated 100 times, which effectively leveled areas dominated by noise [Fig. 1(c)]. Fourth, and finally, to preserve photon conservation from one focal plane to the next, the images in each z-stack were normalized such that the sum of pixel intensities was the same.
Fig. 1.
(Color online) (a) Raw image after subtraction of the noise floor (as determined by area outside the dashed green circle) and multiplication with the cleanup filter shown in (d). (b) Magnified region shown in light blue box in (a). (c) Same region after 100 iterations of the noise-suppression scheme using the filter kernel shown in (e). (f) Mask showing pixels with negative values in (b) in white. The solid red circle in (d) encloses values >98% of the maximum. The solid magenta curve shows a central line profile through (d). White scale bars: 1 µm.
Estimates of the complex pupil functions P(kx, ky) describing the magnitude and phase of the STED laser beam were obtained through application of a previously established phase-retrieval scheme [7,9]. We executed 100 iterations in this modified Gerchberg–Saxton algorithm, using as input NA, n, λ, dxy, and three images at zinput ∈ {−1, 0, 1} µm from each preprocessed z-stack. To improve the resolution of the retrieved pupil function, 192 zero-intensity pixel lines were appended to all sides of each image (resulting in 512 × 512 pixel images) prior to running the phase-retrieval scheme.
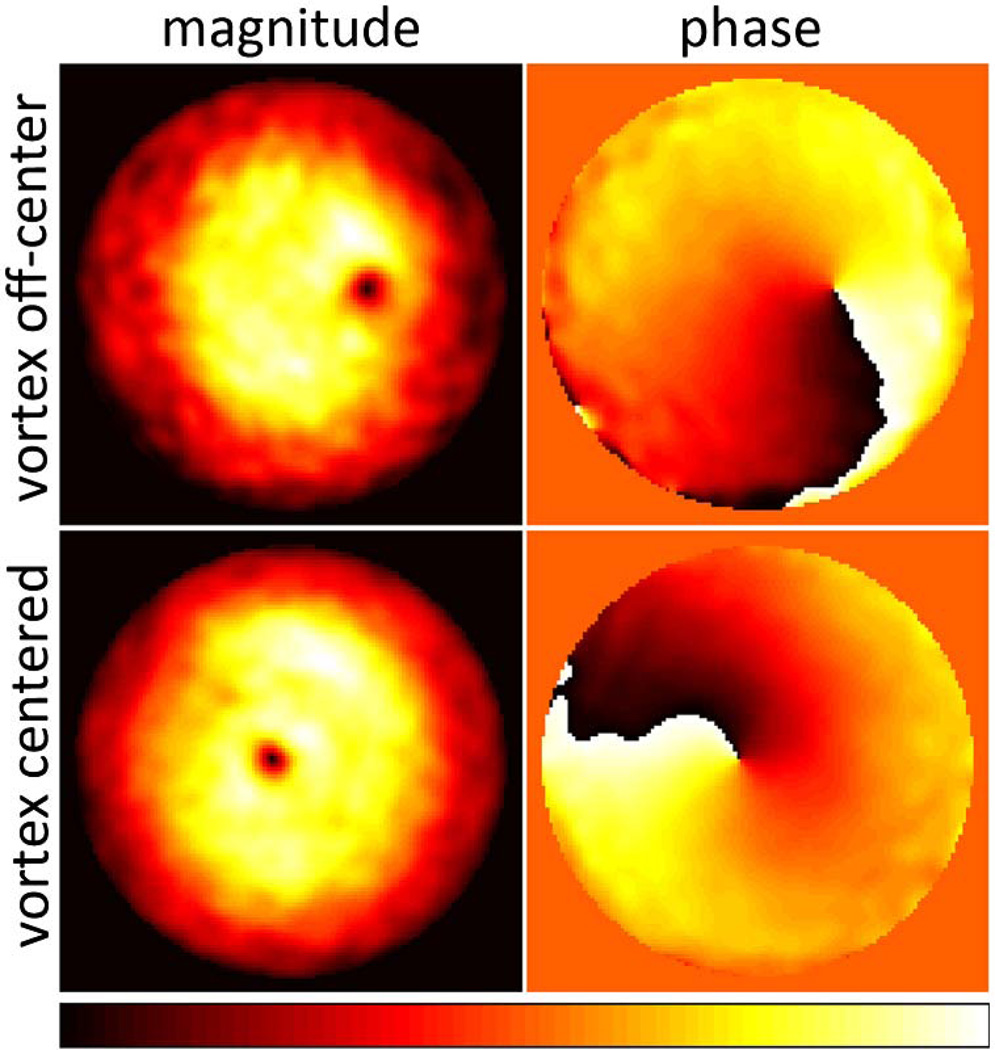
We retrieved the complex pupil functions from the two recorded z-stacks as described above (Fig. 2). The magnitude plots correspond nicely to the Gaussian intensity profile at the objective back aperture while the phase plots reproduce the distinct phase pattern imposed by the 2π helical phase ramp of the vortex phase mask. The destructive interference in the center of the helical phase ramp allows identification of the vortex center also in the magnitude plots. The shift between the vortex centers in Fig. 2 was measured to be 24% of the pupil diameter. This corresponds to 1.19 mm in the objective back aperture based on an objective pupil diameter of D = 2fNA = 5.04 mm, or 0.65 mm at the vortex phase mask. This value differs by only 11% from the actual phase mask shift of 0.74 mm mentioned above. In addition to the misaligned phase mask, small additional aberrations can be observed in our experimental data as indicated by a curvature in the wavefront underlying the helical phase pattern.
Fig. 2.
(Color online) Pupil magnitudes (left) and phases (right) retrieved from two z-stacks (top and bottom). Magnitude images are normalized to their maximum values. Dynamic range of phase images: [−π, π].
Based on the pupil function, the STED focus h(x, y, z) can be reconstructed as follows, which takes the circular polarization of the STED laser beam into account:
| (1) |
Here is the inverse 2D Fourier transform, i is the imaginary unit, and . T1 through T6 are trigonometric functions describing the depolarization induced by the lens [7]:
| (2) |
where θ is the angle relative to the optical axis, namely, , and φ ∈ [−π, π] is the azimuthal angle φ = arctan(ky/kx).
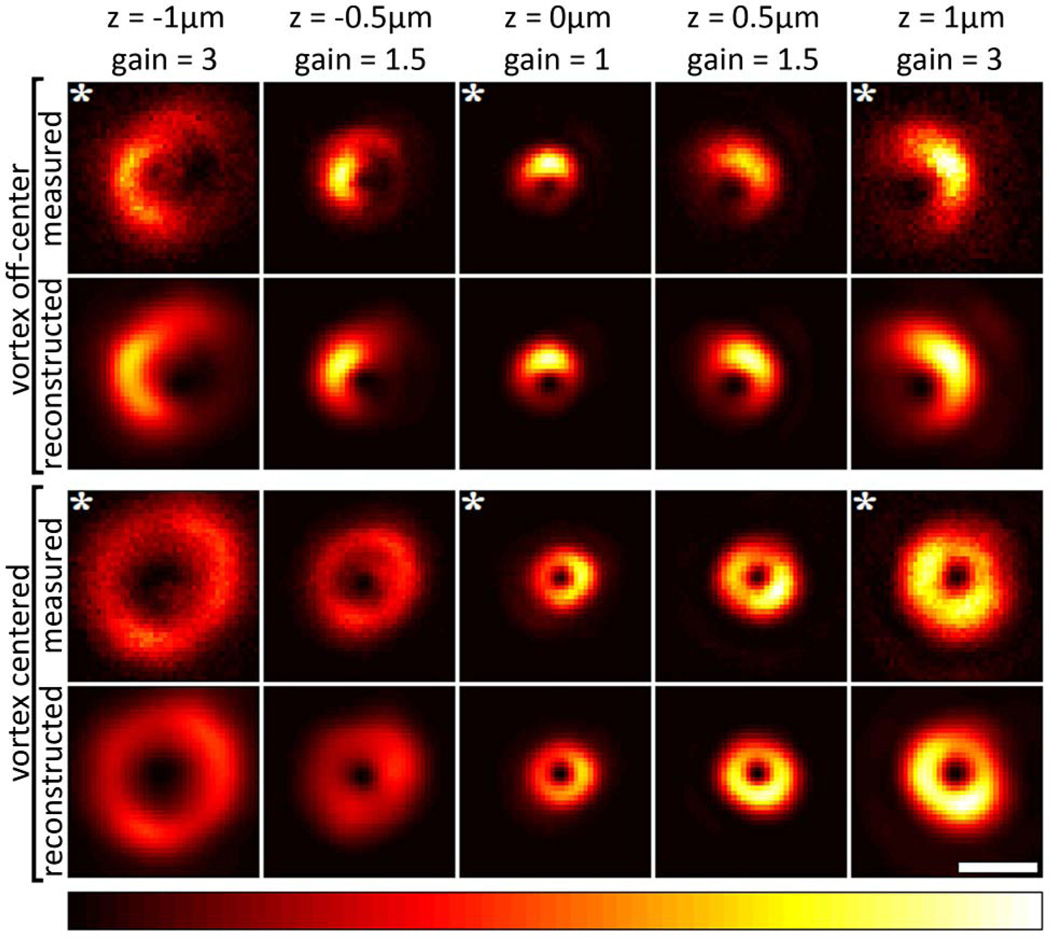
Based on Eq. (1), we further validated the correct retrieval of our pupil functions by simulating STED foci. Figure 3 shows the excellent agreement between the originally recorded images and the simulated images for the planes that were used in the phase retrieval (each indicated by a white asterisk in Fig. 3) and, importantly, also for planes that did not contribute to the generation of the pupil function. A Pearson coefficient of 98.5 ± 0.9% was obtained by correlating original and reconstructed images.
Fig. 3.
(Color online) First and third rows: z-stacks with measured (preprocessed) STED foci. Second and fourth rows: STED foci reconstructed from the retrieved pupil functions (based on images marked by white asterisks). In each row, the intensities are normalized to the highest pixel intensity in that row after applying a gain to the images as indicated above each column. Only the central regions of the images are displayed (the surrounding low-intensity regions were reconstructed equally well). White scale bar: 1 µm.
We have demonstrated that reliable phase retrieval from recorded z-stacks of gold beads is possible in STED microscopy. The remarkable agreement between measured STED foci and foci simulated on the basis of retrieved pupil functions proves the reliability of our approach (Fig. 3). To achieve these results, it is essential to reduce background noise in the underlying data as much as possible because a large portion of the imaged region is otherwise dominated by noise. Therefore, our effective noise-reduction filter turned out to be essential to the success of our approach. Despite the good agreement, we want to point out that the method is not perfectly accurate: polarization of the STED laser beam and depolarization effects due to the high NA of the objective lens, as well as emitter size, are not accounted for in the phase-retrieval scheme. However, the use of circularly polarized light in combination with vortex phase masks leads to a z-polarization component of similar shape as the x and y components in the focus. This minimizes the generally observed deviations from scalar theory caused by depolarization effects in high-NA objectives and therefore partially explains the very small deviations of the reconstructed from the original STED foci.
Access to the actual pupil function of a STED microscope has two important benefits. First, it provides a means to diagnose suboptimal STED foci by directly showing typical experimental problems such as an off-center laser beam in the back aperture (as indicated by a nonsymmetric amplitude distribution), a laterally shifted phase mask (visible as the position of the vortex center; demonstrated in Fig. 2), or aberrations such as defocus, astigmatism, or coma (encoded in the phase). Second, it offers a flexible model of the STED focus at any point of interest within reasonable distance of the focus center. In this context, it is important to point out that our pupil function includes aberrations caused by the objective, the immersion medium, the coverslip, or the sample itself. This stands in contrast to a pupil function directly measured by, for example, a Shack–Hartmann sensor in place of the objective lens. While a Shack–Hartmann measurement arguably provides direct access to the field distribution in the back aperture plane of the objective, our approach elucidates problems not only with the beam path leading to the objective but also with the objective itself or the sample, which in practice are common error sources.
Based on the wavefront information obtained using the approach detailed here, a next step will be the correction of detected optical aberrations with adaptive optics elements to enhance the quality of STED foci. Because our approach does not require any additional hardware and is easily implemented into any existing STED microscope, our results will allow significant improvements of potentially every STED microscope. Moreover, our method is readily applicable to other applications using highly focused laser beams with or without complex phase masks such as optical tweezers [10].
Acknowledgments
The authors thank Martin Booth, Daniel Burke, Felix Dietrich, and Delphine Débarre for helpful discussions and Joachim Spatz for support. This work was supported by the Wellcome Trust and the Kavli Foundation. E. B. K. is supported by a fellowship from Novo Nordisk and Novozymes. T. J. G. is supported by the National Institute of General Medical Sciences (F32GM096859). M. F. J. is supported by a fellowship from the German Academic Exchange Service (DAAD).
References
- 1.Hell SW. Nat. Meth. 2009;6:24. doi: 10.1038/nmeth.1291. [DOI] [PubMed] [Google Scholar]
- 2.Toomre D, Bewersdorf J. Annu. Rev. Cell Dev. Biol. 2010;26:285. doi: 10.1146/annurev-cellbio-100109-104048. [DOI] [PubMed] [Google Scholar]
- 3.Hell SW, Wichmann J. Opt. Lett. 1994;19:780. doi: 10.1364/ol.19.000780. [DOI] [PubMed] [Google Scholar]
- 4.Rittweger E, Han KY, Irvine SE, Eggeling C, Hell SW. Nat. Photon. 2009;3:144. [Google Scholar]
- 5.Deng S, Liu L, Cheng Y, Li R, Xu Z. Opt. Express. 2009;17:1714. doi: 10.1364/oe.17.001714. [DOI] [PubMed] [Google Scholar]
- 6.Kastrup L, Wildanger D, Rankin BR, Hell SW. In: Nanoscopy and Multidimensional Optical Fluorescence Microscopy. Diaspro A, editor. Chapman & Hall/CRC; 2010. pp. 1–13. [Google Scholar]
- 7.Hanser BM, Gustafsson MG, Agard DA, Sedat JW. J. Microsc. 2004;216:32. doi: 10.1111/j.0022-2720.2004.01393.x. [DOI] [PubMed] [Google Scholar]
- 8.Gould TJ, Myers JR, Bewersdorf J. Opt. Express. 2011;19:13351. doi: 10.1364/OE.19.013351. [DOI] [PubMed] [Google Scholar]
- 9.Débarre D, Vieille T, Beaurepaire E. J. Microsc. 2011;244:136. doi: 10.1111/j.1365-2818.2011.03518.x. [DOI] [PubMed] [Google Scholar]
- 10.Züchner T, Failla AV, Meixner AJ. Angew. Chem. 2011;50:5274. doi: 10.1002/anie.201005845. [DOI] [PubMed] [Google Scholar]


