

Abstract
Purpose
In prior work, a manually derived measure of vocal fold vibratory phase asymmetry correlated to varying degrees with visual judgments made from laryngeal high-speed videoendoscopy (HSV) recordings. The current investigation extended upon this work by establishing an automated HSV-based framework to quantify three categories of vocal fold vibratory asymmetry.
Method
HSV-based analysis provided for cycle-to-cycle estimates of left-right phase asymmetry, left-right amplitude asymmetry, and axis shift during glottal closure for 52 normal speakers producing comfortable and pressed phonation. An initial cross validation of the automated left-right phase asymmetry measure was performed by correlating the measure with other objective and subjective assessments of phase asymmetry.
Results
Vocal fold vibratory asymmetry was exhibited to a similar extent in both comfortable and pressed phonations. The automated measure of left-right phase asymmetry strongly correlated with manually derived measures and moderately correlated with visual-perceptual ratings. Correlations with the visual-perceptual ratings remained relatively consistent as the automated measure was derived from kymograms taken at different glottal locations.
Conclusions
An automated HSV-based framework for the quantification of vocal fold vibratory asymmetry was developed and initially validated. This framework serves as a platform for investigating relationships between vocal fold tissue motion and acoustic measures of voice function.
Keywords: Vocal fold, Assessment, Endoscopy, Voice
INTRODUCTION
The purpose of this research note is to describe an automated framework that has been developed to obtain measures of vocal fold vibratory asymmetry from laryngeal high-speed videoendoscopy (HSV) recordings (Deliyski et al., 2008). Measurements were designed to provide objective quantification of clinically based visual-perceptual judgments and to also serve as a platform for investigating the effects of asymmetric vocal fold vibration on voice quality.
Normal voice production is typically described as the periodic vibration of left and right vocal folds that mirror each other as they oscillate. Vocal fold vibratory asymmetry generally refers to deviations from this mirroring between the left and right vocal folds during phonation. Recent work has demonstrated that HSV-based methods are required to obtain a comprehensive assessment of asymmetric vocal fold vibration because videostroboscopy is not capable of revealing cycle-to-cycle variations between the left and right vocal fold vibratory patterns (Mehta, Deliyski, Zeitels, Quatieri, & Hillman, 2010).
Visual observations of deviations in left-right symmetry have been treated as clinical indicators of vocal fold pathology (Bless, Hirano, & Feder, 1987) and have been linked to the presence of vocal lesions (Gallivan, Gallivan, & Eitnier, 2008; Qiu, Schutte, Gu, & Yu, 2003), paralysis (Švec, Šram, & Schutte, 2007), and scarring (Haben, Kost, & Papagiannis, 2003). In addition, certain levels of vocal fold vibratory asymmetry have been exhibited by speakers without voice disorders (Bonilha, Deliyski, & Gerlach, 2008; Haben et al., 2003; Shaw & Deliyski, 2008). Auditory-perceptual descriptions of voice quality have been implicated as reflections of asymmetric vocal fold vibration, including the perceptions of roughness and breathiness (Niimi & Miyaji, 2000; Verdonck-de Leeuw, Festen, & Mahieu, 2001).
Categories of vocal fold vibratory asymmetry observable with high-speed imaging technology include left-right amplitude asymmetry, left-right phase asymmetry, and axis shift during glottal closure (Švec et al., 2007). The cycle-to-cycle quantification of these measures has already proven critical in an initial assessment of the impact of asymmetric vocal fold vibration on the acoustic voice signal (Mehta et al., 2010).
Alternative HSV-based approaches have been previously described to obtain vibratory measures along the anterior-posterior length of the glottis, including the comprehensive phonovibrogram (Lohscheller & Eysholdt, 2008; Lohscheller, Eysholdt, Toy, & Döllinger, 2008). Phonovibrography is an attempt to represent, in one summary image, the results of detailed measures of the relative opening and closing phases of the left and right vocal folds for all of the individual vibratory cycles in a sample of sustained phonation. A display based on this type of data reduction requires more formal evaluation to assess its clinical validity and utility. In contrast, the current approach aims to obtain HSV-based measures that are directly related to the way in which voice clinicians visually assess videoendoscopic images.
This research note briefly describes our current approach for extracting measures of vocal fold vibratory asymmetry from HSV recordings and the results from initial attempts to validate these measures. The methodology improves upon previous work (Mehta et al., 2010) by incorporating the ability to estimate measures of left-right asymmetry at multiple positions along the anterior-posterior length of the glottis. In addition, the measures of asymmetry were applied to a normative subject group phonating in both comfortable and pressed conditions.
METHOD
Subject sample
HSV recordings from a previous study of 52 adult subjects (24 male, 28 female) with normal voice function were available for analysis (Bonilha et al., 2008). HSV data were recorded in monochrome using the High-Speed Video System Model 9700 (KayPENTAX, Lincoln Park, NJ). The frame rate was set at 2000 images per second with maximum integration time, and the spatial resolution was 120 horizontal pixels by 256 vertical pixels for an approximately 2 cm2 target area. Subjects were instructed to produce sustained vowels for 5 s in both comfortable and pressed manners at normal pitch and loudness. Phonatory segments of 2.2 s in duration were recorded and saved. From each saved token, a stable region of 160 ms (320 images) in duration was extracted for processing.
Objective measures of vocal fold vibratory asymmetry
Figure 1 illustrates how lateral displacement waveforms were obtained from HSV recordings. Translational motion artifacts were compensated for so that edge detection was equivalent to motion tracking of the vocal fold edge closest to the glottal midline (Deliyski, 2005). The glottal midline was defined interactively by endpoints at the anterior commissure and the posterior end of the musculo-membranous glottis on the first HSV image capturing maximum glottal area. All images in the HSV recording were rotated such that the glottal midline was oriented vertically. Color images with red (R), green (G), and blue (B) information were converted to a grayscale intensity (I) using the following luminance equation (The Society of Motion Picture and Television Engineers, 2004):
| (1) |
Figure 1.

Algorithm for obtaining lateral displacement waveforms from a laryngeal high-speed videoendoscopy image sequence.
An intensity threshold was selected to segment the glottis through an iterative process. An initial threshold was automatically estimated at the minimum between the first two peaks of a smoothed version of the intensity histogram. Image pixels with intensities below this threshold were segmented as glottis. Due to some illumination inconsistency and arytenoid hooding, visual perception of the glottal area contour was necessary to confirm the resulting glottal segmentation or modify the threshold. Lateral displacement waveforms of the left and right vocal folds were obtained by tracking the edges defined by the boundary between the glottis and vocal fold tissue regions.
Figure 2 defines variables used for computing measures of left-right phase asymmetry, left-right amplitude asymmetry, and axis shift during closure. Left-right phase asymmetry PA quantified the phase delay between the left and right vocal folds (Bonilha et al., 2008; Lohscheller et al., 2008):
| (2) |
where nR was the frame index at maximum lateral displacement of the right vocal fold; nL was the frame index at maximum lateral displacement of the left vocal fold; and period P was the number of frames between successive glottal closure instants. Zero indicated no phase asymmetry; positive values indicated that the left vocal fold led the right vocal fold in phase; and negative values indicated that the right vocal fold led the left vocal fold in phase.
Figure 2.
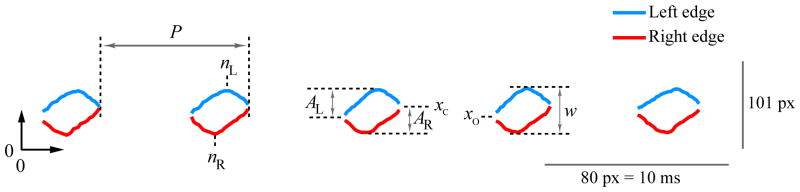
Parameterization of lateral displacement waveforms to obtain measures of vocal fold vibratory asymmetry. See text for definitions of variables.
Left-right amplitude asymmetry AA quantified the relative peak-to-peak displacements of the left and right vocal folds (Qiu et al., 2003):
| (3) |
where AL was the peak-to-peak lateral displacement, in pixels, of the left vocal fold; and AR was the peak-to-peak lateral displacement, in pixels, of the right vocal fold. Zero indicated no amplitude asymmetry; positive values reflected a relative reduction of the right vocal fold displacement; and negative values reflected a relative reduction of the left vocal fold displacement.
Finally, the axis shift AS quantified the mediolateral distance traveled by the vocal folds during glottal closure (Švec et al., 2007):
| (4) |
where xO was the mediolateral position of the vocal folds prior to glottal opening; xC was the mediolateral position of the vocal folds at glottal closure; and w was the normalization factor defined by the distance, in pixels, spanning the maximum lateral displacements of the left and right vocal folds. Zero indicated no axis shift; positive values indicated that the axis shifted toward the left vocal fold during closure; and negative values indicated that the axis shifted toward the right vocal fold during closure.
Histogram-based analysis and first-order descriptive statistics allowed for comparisons of the prevalence of the different types of vocal fold vibratory asymmetry in the two phonatory conditions.
Cross validation
The automated measures were initially validated by determining how well they correlated with other measures based on computing Pearson’s r statistic at a 95 % confidence level.
PA measures at mid-glottis were compared to results in previous work that obtained a manually derived measure of left-right phase asymmetry from three cycles in the DKG (Bonilha et al., 2008). Consistent with the previous study, cubic interpolation was performed on the DKG to increase the effective sampling rate by a factor of four to enhance edge visualization. Pearson’s r was computed between absolute values of the automated and manually derived measures of left-right phase asymmetry to determine the agreement of these two approaches.
The correlation between AS and PA was computed to determine the extent of a purported relationship between axis shift and left-right phase asymmetry (Isshiki, Tanabe, Ishizaka, & Broad, 1977; Švec et al., 2007).
Finally, data were available from three voice specialists who were instructed to judge the degree of left-right phase asymmetry in each HSV recording using a 5-point rating scale (1 = completely asymmetrical, 2 = severely asymmetrical, 3 = moderately asymmetrical, 4 = mildly asymmetrical, 5 = symmetrical). Details of the rating procedure have been previously documented (Bonilha et al., 2008). Pearson’s r measured the relationship between the visual ratings of left-right phase asymmetry and the average magnitudes of PA. PA measures were computed from each horizontal cross section along the anterior-posterior length of the glottis to determine if particular cross sections received perceptual preference by the raters.
RESULTS
Figure 3 displays the prevalence of the average measures of left-right phase asymmetry PA, left-right amplitude asymmetry AA, and axis shift during closure AS for the comfortable and pressed phonatory conditions. In particular, distributions of the pressed-condition measurements overlapped to a large extent with the respective distributions of the comfortable-condition measurements, suggesting that any measure taken out of context was insufficient as an indicator of phonatory condition. Directionality was preserved to document any sidedness bias of the measures in the subject sample. Table I shows summary statistics of the magnitudes of the average asymmetry measures. To the authors’ knowledge, Figure 3B and Figure 3C represent the first quantitative measures of left-right amplitude asymmetry and axis shift in a large sample of speakers with no history of voice disorders producing two voice conditions.
Figure 3.

Distributions of average measures of HSV-based vocal fold vibratory asymmetry for the two phonatory conditions (N = 52): (A) left-right phase asymmetry PA, (B) left-right amplitude asymmetry AA, and (C) axis shift during closure AS. The value above each bar refers to the number of subjects.
Table I.
Summary statistics for the three HSV-based measures of vocal fold vibratory asymmetry for recordings of comfortable and pressed phonatory conditions. Measures were averaged over all cycles in the middle DKG, and directionality was removed by computing the absolute values prior to finding the mean, standard deviation (SD), and range.
| Measure | Subject group | Mean | SD | Range |
|---|---|---|---|---|
| Left-right phase asymmetry, PA (%) | Comfortable | 6.27 | 4.33 | [0.13, 22.2] |
| Pressed | 5.40 | 4.63 | [0.00, 20.2] | |
|
| ||||
| Left-right amplitude asymmetry, AA (%) | Comfortable | 6.45 | 4.66 | [0.25, 31.5] |
| Pressed | 5.97 | 5.92 | [0.12, 29.8] | |
|
| ||||
| Axis shift during closure, AS (%) | Comfortable | 10.4 | 8.30 | [0.36, 52.1] |
| Pressed | 13.5 | 12.1 | [0.16, 64.0] | |
At mid-glottis, there was a strong correlation between the automated measure PA and the manually derived measure of left-right phase asymmetry (r = 0.85, p < 0.001). A strong correlation was also found between average measures of PA and AS across both subject groups (r = 0.86, p < 0.001).
Table II lists the results of the cross validation of the average measure of PA with visual ratings of left-right phase asymmetry. Correlations obtained were comparable or higher than reported correlations using the manually derived measure of left-right phase asymmetry in Table 5 of Bonilha et al. (2008). Figure 4 displays the effect of position along the glottis on the correlation between average PA and visual judgments of left-right asymmetry by the three raters. Although the overall strength of the correlation varied among raters, similar correlation trends versus glottal position were observed within each rater. The strength of the correlation was similar over more than half of the glottal area around the mid-glottis, and correlations weakened toward the endpoints of the glottal midline. (The correlation coefficients in Table II and Figure 4 are negative because larger absolute values of PA indicated higher phase asymmetry, whereas larger values on the visual rating scale were defined to indicate lower phase asymmetry.)
Table II.
Pearson’s correlation coefficient r (p < 0.05) comparing objective measures of left-right phase asymmetry and visual judgments of left-right phase asymmetry for the two phonatory conditions. Absolute values were taken of average PA and the manually derived measure of left-right phase asymmetry, both from the digital kymogram taken halfway between the endpoints of the glottal midline. Cf. Table 5 in Bonilha et al. (2008).
| Rater | Subject group | PA | Manual |
|---|---|---|---|
| 1 | Comfortable | −.66 | −.47 |
| Pressed | −.84 | −.71 | |
| 2 | Comfortable | −.41 | −.38 |
| Pressed | −.51 | −.55 | |
| 3 | Comfortable | −.67 | −.63 |
| Pressed | −.67 | −.70 |
Figure 4.

Correlation (Pearson’s coefficient r and 95 % confidence interval) between visual judgments of left-right phase asymmetry and magnitude of average PA measured from different horizontal cross sections along the glottal midline. Visual ratings were taken from (A) Rater 1, (B) Rater 2, and (C) Rater 3. Data were aggregated across phonatory conditions (N = 101), with three HSV recordings considered unsuitable for rating. (D) A reference image displays how locations were defined along the glottal midline.
DISCUSSION
The diagnosis of voice disorders depends upon a number of evaluation procedures that describe abnormal voice production to aid in establishing appropriate intervention strategies. Although the relationship between asymmetric vocal fold vibration and voice quality is not well understood, the presence of vocal fold vibratory asymmetry is often considered a clinical indicator of abnormal vocal function that would be linked to any signs or complaints of degraded voice quality and/or inefficient voice production. In the current study, three types of vocal fold vibratory asymmetry were measured from each glottal cycle in an automated HSV-based system. Average values of left-right phase asymmetry, left-right amplitude asymmetry, and axis shift during closure were obtained in a group of normal speakers phonating in comfortable and pressed manners.
The initial attempt at validation produced a strong, but not perfect, correlation between automated (PA) and manually derived measures of left-right phase asymmetry (r = 0.85, p < 0.001). There were clearly some discrepancies between these two estimates. In some cases, manual markings labeled regions of mucosal wave deformation that were not tracked using the automated system.
Although an improvement over the manual method in terms of reproducibility and efficiency, the automated system still required user interaction to define the glottal midline and set glottal segmentation thresholds. It was found that an iterative threshold-based approach resulted in computational efficiency and robustness. Errant endoscopic angles potentially generated artifacts in measures of vocal fold vibratory asymmetry. Partial exposure of the glottis can affect even effective segmentation algorithms of HSV segments due to arytenoid hooding or laryngeal compression. In addition, significant amounts of mucus on the vocal fold epithelium can prevent accurate estimation of underlying tissue motion. Future work calls for the comparison of fully automated image segmentation algorithms with those requiring user interaction based on objective error criteria. Directions include the development and validation of techniques based on principles such as region growing, active contours, thresholding, and level sets. Efficient glottal segmentation has been the subject of intense study using these types of approaches (Lohscheller, Toy, Rosanowski, Eysholdt, & Döllinger, 2007; Moukalled, Deliyski, Schwarz, & Wang, 2009; Yan, Damrose, & Bless, 2007; Zhang, Bieging, Tsui, & Jiang, 2010). Efforts are in place for validating these methods against human judgments and for comparing the reliability and accuracy of these different approaches.
The three types of vocal fold vibratory asymmetry were observed to similar degrees across phonatory conditions. Results yielded quantitative evidence for a strong correlation between axis shift and left-right phase asymmetry, suggesting a dynamic spatiotemporal relationship during phonation. Visual judgments of left-right phase asymmetry served as another validation of the automated measure of left-right phase asymmetry to reflect the clinical situation where objective measures must be complemented by auditory and visual assessments of voice production (Hillman, Montgomery, & Zeitels, 1997).
The automated measure of left-right asymmetry (PA) maximally explained about 70 % of the variance in the visual judgments. Substantial differences were evident among raters, underscoring the need to incorporate objective measurements of vibratory asymmetry into clinical voice assessment. Intra-rater and inter-rater reliability of auditory-perceptual judgments are known to vary depending on stimulus context and experience. Listener disagreement can stem from drifts in internal representations of a particular quality, scale resolution, the absolute magnitude of the quality, and the presence of anchor stimuli (Kreiman, Gerratt, & Ito, 2007). The visual-perceptual rating task potentially suffered from similar issues. HSV-based measurement could contribute to improving visual rating protocols because of a better understanding of the nature and extent of asymmetric vocal fold vibration.
The correlations between visual judgments and the automated measures were relatively consistent over a wide range of locations along the glottis from which the automated measures were computed. Thus, at least in terms of visual perception, objective correlates of left-right phase asymmetry were similarly estimated from positions around the mid-glottis. Objective measures estimated near the anterior and posterior endpoints of the glottal midline correlated weakly with the visual judgments due to limited resolution of the lateral displacement waveforms.
The ability to quantify measures of cycle-to-cycle variation in asymmetry using HSV-based approaches has received recent attention (Lohscheller et al., 2008; Mehta et al., 2010). In particular, average levels of left-right vibratory asymmetry did not necessarily correlate with elevated acoustic perturbation measures in a study on the acoustic effects of asymmetric vocal fold vibration (Mehta et al., 2010). Instead, standard deviations of the measures were shown to correlate moderately with measures of acoustic jitter and shimmer. This sort of detailed study directly relating vocal fold vibratory properties to acoustic measures of voice quality is becoming possible with current imaging technology. The digital kymography–based approach provides a processing framework that has the same temporal and spatial dimensions as the original recorded data, such that the objective measures are always traceable to vocal fold tissue motion. The specific categories of asymmetry measured in this study complement the asymmetry measures obtainable from the phonovibrogram (Lohscheller et al., 2008).
CONCLUSIONS
An HSV-based automated system for quantifying vocal fold vibratory asymmetries found asymmetry to be prevalent in speakers without voice disorders. Statistically-significant correlations between objective measures of left-right phase asymmetry and visual-perceptual judgments substantiate the use of these types of measures in future investigations into the impact of asymmetric vocal fold vibration on voice quality measures. As high-speed imaging becomes less novel and its properties better understood, the additional temporal information gained by this technology has the potential to complement current diagnostic tools in the voice clinic.
Acknowledgments
This work was supported by grants from the NIH National Institute on Deafness and Other Communication Disorders (T32 DC00038 and R01 DC007640) and by the Institute of Laryngology and Voice Restoration. Its contents are solely the responsibility of the authors and do not necessarily represent the official views of the NIH. The work of T. F. Quatieri was sponsored under Air Force Contract FA8721-05-C-0002. The opinions, interpretations, conclusions, and recommendations are those of the authors and are not necessarily endorsed by the United States Government. The authors would like to thank Terri Treman Gerlach, PhD, and Heather Shaw Bonilha, PhD, for recording the HSV data and for assisting in accessing and organizing the pre-existing visual-perceptual ratings database (Bonilha et al., 2008) that was used in the current study.
References
- Bless DM, Hirano M, Feder RJ. Videostroboscopic evaluation of the larynx. Ear, Nose, and Throat Journal. 1987;66:289–296. [PubMed] [Google Scholar]
- Bonilha HS, Deliyski DD, Gerlach TT. Phase asymmetries in normophonic speakers: Visual judgments and objective findings. American Journal of Speech-Language Pathology. 2008;17:367–376. doi: 10.1044/1058-0360(2008/07-0059). [DOI] [PMC free article] [PubMed] [Google Scholar]
- Deliyski DD. Endoscope motion compensation for laryngeal high-speed videoendoscopy. Journal of Voice. 2005;19:485–496. doi: 10.1016/j.jvoice.2004.07.006. [DOI] [PubMed] [Google Scholar]
- Deliyski DD, Petrushev PP, Bonilha HS, Gerlach TT, Martin-Harris B, Hillman RE. Clinical implementation of laryngeal high-speed videoendoscopy: Challenges and evolution. Folia Phoniatrica et Logopaedica. 2008;60:33–44. doi: 10.1159/000111802. [DOI] [PubMed] [Google Scholar]
- Gallivan GJ, Gallivan HK, Eitnier CM. Dual intracordal unilateral vocal fold cysts: A perplexing diagnostic and therapeutic challenge. Journal of Voice. 2008;22:119–124. doi: 10.1016/j.jvoice.2006.08.009. [DOI] [PubMed] [Google Scholar]
- Haben CM, Kost K, Papagiannis G. Lateral phase mucosal wave asymmetries in the clinical voice laboratory. Journal of Voice. 2003;17:3–11. doi: 10.1016/s0892-1997(03)00032-8. [DOI] [PubMed] [Google Scholar]
- Hillman RE, Montgomery WW, Zeitels SM. Appropriate use of objective measures of vocal function in the multidisciplinary management of voice disorders. Current Opinion in Otolaryngology & Head and Neck Surgery. 1997;5:172–175. [Google Scholar]
- Isshiki N, Tanabe M, Ishizaka K, Broad D. Clinical significance of asymmetrical vocal cord tension. Annals of Otology, Rhinology, and Laryngology. 1977;86:58–66. doi: 10.1177/000348947708600109. [DOI] [PubMed] [Google Scholar]
- Kreiman J, Gerratt BR, Ito M. When and why listeners disagree in voice quality assessment tasks. The Journal of the Acoustical Society of America. 2007;122:2354–2364. doi: 10.1121/1.2770547. [DOI] [PubMed] [Google Scholar]
- Lohscheller J, Eysholdt U. Phonovibrogram visualization of entire vocal fold dynamics. Laryngoscope. 2008;118:753–758. doi: 10.1097/MLG.0b013e318161f9e1. [DOI] [PubMed] [Google Scholar]
- Lohscheller J, Eysholdt U, Toy H, Döllinger M. Phonovibrography: Mapping high-speed movies of vocal fold vibrations into 2-D diagrams for visualizing and analyzing the underlying laryngeal dynamics. IEEE Transactions on Medical Imaging. 2008;27:300–309. doi: 10.1109/TMI.2007.903690. [DOI] [PubMed] [Google Scholar]
- Lohscheller J, Toy H, Rosanowski F, Eysholdt U, Döllinger M. Clinically evaluated procedure for the reconstruction of vocal fold vibrations from endoscopic digital high-speed videos. Medical Image Analysis. 2007;11:400–413. doi: 10.1016/j.media.2007.04.005. [DOI] [PubMed] [Google Scholar]
- Mehta DD, Deliyski DD, Zeitels SM, Quatieri TF, Hillman RE. Voice production mechanisms following phonosurgical treatment of early glottic cancer. Annals of Otology, Rhinology, and Laryngology. 2010;119:1–9. doi: 10.1177/000348941011900101. [DOI] [PMC free article] [PubMed] [Google Scholar]
- Moukalled HJ, Deliyski DD, Schwarz RR, Wang S. In: Manfredi C, editor. Segmentation of laryngeal high-speed videoendoscopy in temporal domain using paired active contours; Proceedings of the 6th International Workshop on Models and Analysis of Vocal Emissions for Biomedical Applications MAVEBA; Firenze, Italy: Firenze University Press; 2009. pp. 137–140. [Google Scholar]
- Niimi S, Miyaji M. Vocal fold vibration and voice quality. Folia Phoniatrica et Logopaedica. 2000;52:32–38. doi: 10.1159/000021510. [DOI] [PubMed] [Google Scholar]
- Qiu Q, Schutte HK, Gu L, Yu Q. An automatic method to quantify the vibration properties of human vocal folds via videokymography. Folia Phoniatrica et Logopaedica. 2003;55:128–136. doi: 10.1159/000070724. [DOI] [PubMed] [Google Scholar]
- Shaw HS, Deliyski DD. Mucosal wave: A normophonic study across visualization techniques. Journal of Voice. 2008;22:23–33. doi: 10.1016/j.jvoice.2006.08.006. [DOI] [PubMed] [Google Scholar]
- Švec JG, Šram F, Schutte HK. Videokymography in voice disorders: What to look for? Annals of Otology, Rhinology, and Laryngology. 2007;116:172–180. doi: 10.1177/000348940711600303. [DOI] [PubMed] [Google Scholar]
- The Society of Motion Picture and Television Engineers. SMPTE Standards. 2004. SMPTE 170M-2004. Television—Composite analog video signal—NTSC for studio applications (Revision of SMPTE 170M-1999) [Google Scholar]
- Verdonck-de Leeuw IM, Festen JM, Mahieu HF. Deviant vocal fold vibration as observed during videokymography: The effect on voice quality. Journal of Voice. 2001;15:313–322. doi: 10.1016/S0892-1997(01)00033-9. [DOI] [PubMed] [Google Scholar]
- Yan Y, Damrose E, Bless D. Functional analysis of voice using simultaneous high-speed imaging and acoustic recordings. Journal of Voice. 2007;21:604–616. doi: 10.1016/j.jvoice.2006.05.011. [DOI] [PubMed] [Google Scholar]
- Zhang Y, Bieging E, Tsui H, Jiang JJ. Efficient and effective extraction of vocal fold vibratory patterns from high-speed digital imaging. Journal of Voice. 2010;24:21–29. doi: 10.1016/j.jvoice.2008.03.003. [DOI] [PMC free article] [PubMed] [Google Scholar]