

Abstract
Cancer germline (CG) genes are normally expressed in germ cells and aberrantly expressed in a variety of cancers; their immunogenicity has led to the widespread development of cancer vaccines targeting these antigens. BORIS/CTCFL is an autosomal CG antigen and promising cancer vaccine target. BORIS is the only known paralog of CTCF, a gene intimately involved in genomic imprinting, chromatin insulation, and nuclear regulation. We have previously shown that BORIS is expressed in epithelial ovarian cancer (EOC) and that its expression coincides with promoter and global DNA hypomethylation. Recently, 23 different BORIS mRNA variants have been described, and have been functionally grouped into six BORIS isoform families (sf1–sf6). In the present study, we have characterized the expression of BORIS isoform families in normal ovary (NO) and EOC, the latter of which were selected to include two groups with widely varying global DNA methylation status. We find selective expression of BORIS isoform families in NO, which becomes altered in EOC, primarily by the activation of BORIS sf1 in EOC. When comparing EOC samples based on methylation status, we find that BORIS sf1 and sf2 isoform families are selectively activated in globally hypomethylated tumors. In contrast, CTCF is downregulated in EOC, and the ratio of BORIS sf1, sf2, and sf6 isoform families as a function of CTCF is elevated in hypomethylated tumors. Finally, the expression of all BORIS isoform families was induced to varying extents by epigenetic modulatory drugs in EOC cell lines, particularly when DNMT and HDAC inhibitors were used in combination.
Keywords: ovarian cancer, epigenetics, BORIS, DNA methylation, CTCF
Introduction
Epithelial ovarian cancer (EOC), which comprises greater than 90% of ovarian cancer cases, is the most lethal gynecologic malignancy (1). The most common form of EOC is high-grade serous (HG-SOC), which is believed to originate from cells in the fallopian tube fimbriae (2). Approximately 70% of EOC cases are diagnosed at late stages, where the disease has disseminated and long-term survival is poor (1). Clinical management of late-stage EOC consists of surgical debulking and adjuvant chemotherapy. While initially responsive to front-line chemotherapy using platinum/taxane regimens, EOC patients frequently relapse, and second line therapies are noncurative. These sobering facts emphasize the need for novel biomarkers and therapeutic targets for EOC.
Cancer/Testis (CT) or cancer germline (CG) genes are normally expressed in germ cells and aberrantly expressed in a variety of cancers; the immunogenicity of CG antigens has led to the development of cancer vaccines based on these antigens (3). CG genes also have emerging roles in oncogenesis, suggesting a potential utility as therapeutic targets (4). CG genes are frequently resident on the X chromosome, but there are various autosomal members of the gene family. One of these, BORIS/CTCFL, is located at Ch. 20q13, a region of frequent amplification in cancer. BORIS is normally expressed in the germ cells of the testis and ovary, and is silent in somatic tissues. However, BORIS is frequently expressed in cancer, including breast, uterine, and ovarian (5–7). Ectopic expression of BORIS in cell lines promotes cellular immortalization and cell growth, implicating a role in oncogenesis (8). BORIS has also been reported to be an upstream activator of other CG genes, but this effect is cell-specific (9–12). In addition to its putative oncogenic role, BORIS has promise as an immunological target in cancer, which is reflected by its prioritization by the NCI as a cancer immunotherapy target (13–16).
BORIS is a paralog of CCCTC-binding factor (CTCF), a key factor in chromatin insulation and genomic imprinting (17–19). CTCF has tumor suppressor activity and is located at Ch.16q22, a common region of allelic loss in breast, prostate, and ovarian cancers (18, 20). BORIS and CTCF share a high degree of homology in their central zinc finger domain, but have divergent N- and C-termini (18). Intriguingly, BORIS and CTCF show mutually exclusive expression patterns in normal tissues: BORIS is expressed in CTCF-negative cells during male germ cell development, while CTCF is ubiquitously expressed and BORIS is silenced in most normal somatic tissues (21). Part of this inverse expression pattern may reflect transcriptional silencing of BORIS by CTCF (22). In contrast to normal tissues, BORIS and CTCF are frequently co-expressed in cancer cells. This may lead to competition for DNA targets, as well as cellular phenotypes, including cell proliferation status (11, 18). One example of the divergent functions of BORIS and CTCF is the fact that, while both proteins bind the cerebroside sulfotransferase (CST) promoter, only BORIS acts as a potent transcriptional activator of this testis-specific gene (21). In addition to their demonstrated roles in chromatin regulation, recent data suggest that BORIS and CTCF play roles in other nuclear functions, including nucleolar transcription and centrosome regulation (23).
We previously reported that BORIS is frequently expressed in EOC, and that its activation in this disease occurs in close association with promoter DNA hypomethylation (7). More recently, we investigated the significance of the BORIS/CTCF expression ratio in EOC, based on the opposing functions of the two genes. We found that elevated BORIS/CTCF expression is associated with global DNA hypomethylation, tumor progression, and reduced progression-free and overall survival (24). These data suggest the BORIS/CTCF expression ratio as a potentially useful and novel prognostic biomarker in EOC.
A recent study reported on the structural complexity of the human BORIS gene (21). The authors identified 23 distinct BORIS mRNA variants (or isoforms) generated from alternative splicing (21). It is likely that these 23 isoforms are biologically relevant, because they maintain the features of typical spliced transcripts, with canonical exon-intron junctions and conserved poly A signals (21). Moreover, the splicing junctions and alternative coding sequences created are conserved in primates, providing further evidence of their functional significance (21). Pugacheva et al. classified these isoforms into six distinct families (sf1 through sf6) based on common 3’ sequences, and showed that these encode up to 17 different BORIS proteins (21). Cloned versions of these proteins localized to nuclei in three different cell types, consistent with a function for each isoform in nuclear control (21). Interestingly, alternative splicing leads to loss of zinc fingers in several isoforms and the formation of novel hybrid zinc fingers in other members. BORIS isoforms show functional distinction with regard to their ability to bind to specific target sequences, and to regulate target gene expression (21). Delineation of which BORIS isoforms are expressed in specific tumor types is likely to be an initial requirement for full understanding of the role of BORIS in cancer (25).
We previously observed the expression of multiple BORIS protein isoforms in EOC samples, based on the appearance of differentially migrating bands in Western blot assays (24). However, the technical limitations of Western blotting do not enable either the accurate or quantitative determination of BORIS isoform expression in EOC. In contrast, Pugacheva et al. designed TaqMan RT-qPCR assays to directly and quantitatively measure the expression of each of six distinct BORIS isoform families (21). Based on this technological development, the goal of the current study was to use the RT-qPCR method to characterize BORIS mRNA isoform family expression in normal ovary (NO) and EOC, both independently and as a function of CTCF mRNA expression. In addition, based on our prior studies (24), we sought to determine whether BORIS isoform family expression is associated with global DNA methylation status in EOC. We also complemented primary tissue-based studies with an investigation into the roles of DNA methylation and histone acetylation in BORIS isoform family regulation, using a pharmacological approach in EOC cell lines.
Results
BORIS isoform expression in testis, normal ovary, and epithelial ovarian cancer
To determine BORIS isoform mRNA expression, we measured each of the six reported BORIS isoform subfamilies (sf1–sf6) by RT-qPCR, using specific TaqMan probe sets, as reported previously (21). We used normal human testis as a positive control for BORIS expression, bulk NO as a normal tissue control for EOC, and EOC samples, which were largely Stage III HG-SOC, the most common clinical form of the disease (Table 1 and data not shown). The smallest BORIS isoform family, sf5 (which consists only of one BORIS transcript, B1 (21)), was not detected in any sample, including testis (data not shown), and thus is not plotted in the ensuing figures. This observation is consistent with the significantly reduced level of expression of this isoform family in most cell lines and tissues reported by Pugacheva et al. (21).
Table 1.
Epithelial ovarian cancer (EOC) sample characteristics.
| Total EOC | Hypomethylated EOC | Hypermethylated EOC | |
|---|---|---|---|
| n | 41 | 20 | 21 |
| Mean % LINE-1 methylation | 56.6 | 38.7 | 73.8 |
| Mean Age (years) | 62.7 | 62.8 | 62.7 |
| STAGE | |||
| 1 | 2 | 0 | 2 |
| 2 | 3 | 0 | 3 |
| 3 | 30 | 15 | 15 |
| 4 | 5 | 4 | 1 |
| Unknown | 1 | 1 | 0 |
| HISTOLOGY | |||
| Serous | 26 | 14 | 12 |
| Mixed | 4 | 2 | 2 |
| Mucinous | 2 | 1 | 1 |
| Clear Cell | 3 | 1 | 2 |
| Carcinosarcoma | 2 | 1 | 1 |
| Endometriod | 1 | 0 | 1 |
| PNET | 1 | 0 | 1 |
| Granulosa | 1 | 0 | 1 |
| Unknown | 1 | 1 | 0 |
BORIS isoform expression in testis and three NO samples is shown in Figure 1A. The expression of BORIS isoforms was relatively similar in testis and NO, with the exception of BORIS sf1, which was highly expressed in testis but not detected in NO (Figure 1A). BORIS sf1 was the dominant isoform expressed in the testis, as reported previously (21). We found substantial levels of BORIS isoform expression in adult human ovary, in contrast to a prior study which reported that BORIS isoform expression was confined to fetal ovary (21). However, both the prior study and our current data are consistent in that they show highest expression of BORIS sf3 among the BORIS isoform families expressed in ovary, and that BORIS sf5 is not detectable at either stage of ovary development (21).
Figure 1.
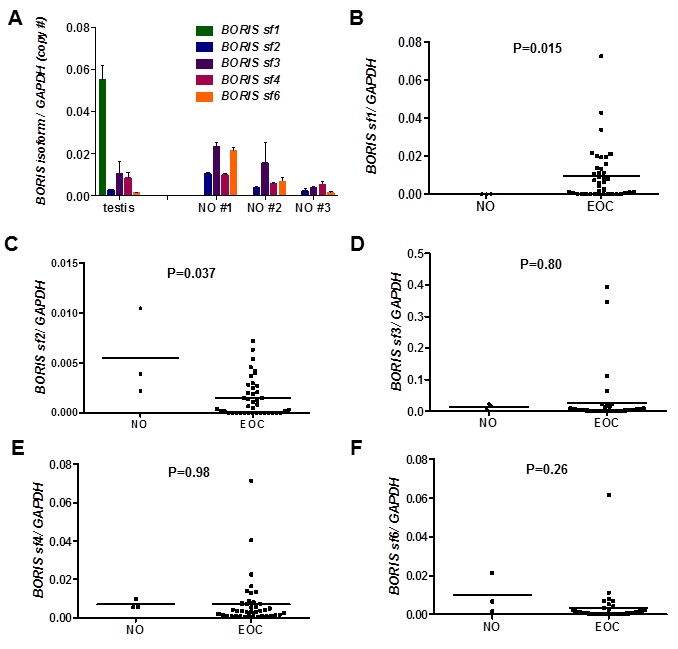
BORIS isoform family expression in testis, normal ovary, and epithelial ovarian cancer. BORIS sf1, sf2, sf3, sf4, and sf6 isoform family expression was determined by RT-qPCR as described in the Materials and Methods. (A) BORIS isoform family expression in human testis and three human normal ovary (NO) samples. Expression of the five indicated isoform subfamilies is shown. Error bars indicated +1 SD. (B–F) BORIS isoform sf1 (B), sf2 (C), sf3 (D), sf4 (E), and sf6 (F) family expression in NO and EOC. Mean lines and p values are shown. Note: BORIS sf1 expression was not detected in NO.
We compared BORIS isoform expression in NO and EOC. Notably, BORIS sf1 was highly (but variably) expressed in EOC but undetectable in NO, and this difference was statistically significant (Figure 1B). In contrast, BORIS sf2 showed significantly decreased expression in EOC as compared to NO (Figure 1C). BORIS sf3 and sf4 showed a similar pattern of expression in NO and EOC as BORIS sf1, but because of the small numbers of tumors with increased BORIS expression, these differences did not meet statistical significance (Figure 1, D and E). BORIS sf6 expression also showed no significant difference between the groups (Figure 1F). In all cases, heterogeneous expression of BORIS isoforms was apparent within the EOC samples, and this phenomenon was investigated further (see below).
BORIS isoform expression and global DNA hypomethylation in epithelial ovarian cancer
We previously observed that full-length BORIS (BORIS B0, a member of isoform family sf1) expression is associated with global DNA hypomethylation in EOC (24). To determine whether an association with global hypomethylation is true for specific BORIS isoform families, we selected two groups of EOC tumors for analysis: i) tumors showing a high degree of LINE-1 hypomethylation as compared to NO (we refer to this group as “hypomethylated EOC”), and ii) tumors showing similar levels of LINE-1 methylation as NO (we refer to this group as “hypermethylated EOC”) (Figure 2A and Table 1). We used methylation of the LINE-1 repetitive element as a biomarker for global DNA methylation status, based on our prior study of different global DNA methylation markers in EOC (24). The two EOC sample groups were age-matched, and the majority of samples in each group were advanced stage and serous histology (Table 1). Notably, BORIS sf1 and sf2 isoform family expression was significantly elevated in hypomethylated EOC (Figure 2, B and C). In contrast, BORIS sf3, sf4, and sf6 did not show a significant difference in expression between the two groups (Figure 2, D–F). Despite this, we noted that one to three LINE-1 hypermethylated tumors showed high levels of BORIS sf3, sf4, or sf6 expression, suggesting that expression of these isoforms is favored in a small subset of hypermethylated tumors (Figure 2, D–F). Taken together, our observations provide evidence for a link between global DNA methylation status and the expression of specific BORIS isoform families in EOC.
Figure 2.

BORIS isoform family expression in LINE-1 hypomethylated and LINE-1 hypermethylated epithelial ovarian cancer. (A) LINE-1 methylation levels were determined by sodium bisulfite pyrosequencing as described in the Materials and Methods. Data are shown for NO and the two EOC sample groups. Mean lines and the p value for the difference between the two EOC sample groups is shown. (B–F) BORIS isoform sf1 (B), sf2 (C), sf3 (D), sf4 (E), and sf6 (F) family expression was measured by RT-qPCR in the EOC sample groups shown in (A). Mean lines and p values are shown.
We next evaluated the BORIS sf1/sf3 ratio as a biomarker associated with global methylation in EOC, as BORIS sf1 expression is elevated in hypomethylated EOC, while, in some instances, BORIS sf3 expression is decreased (Figure 2, B and D). As anticipated, BORIS sf1/sf3 expression was significantly higher in LINE-1 hypomethylated tumors (Figure 3A).
Figure 3.
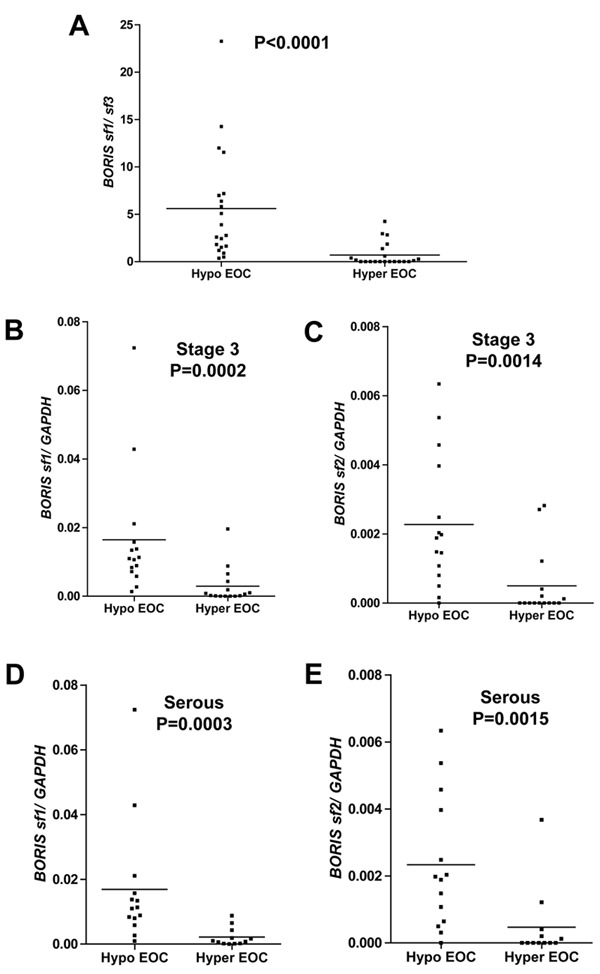
BORIS sf1/sf3 expression in epithelial ovarian cancer, and BORIS sf1 and sf2 expression in stage and histology matched samples. (A) BORIS sf1/sf3 expression in hypomethylated and hypermethylated EOC was determined by RT-qPCR. (B–C) BORIS sf1 (B) and sf2 (C) expression in LINE-1 hypomethylated and LINE-1 hypermethylated Stage III EOC samples. (D–E) BORIS sf1 (D) and sf2 (E) expression in LINE-1 hypomethylated and LINE-1 hypermethylated serous EOC samples. Mean lines and p values are shown.
An additional clinically relevant question was whether elevated BORIS sf1 and sf2 isoform expression in globally hypomethylated EOC held true in samples matched for stage and histology. Consistent with data using unstratified samples, BORIS sf1 and sf2 expression was significantly elevated in hypomethylated EOC in samples matched for either Stage III (Figure 3, B and C) or serous histology (Figure 3, D and E). These observations demonstrate that increased BORIS sf1 and sf2 expression in hypomethylated EOC is not simply a consequence of tumor progression or altered histology, but rather is linked to the underlying molecular pathology.
BORIS isoform/CTCF mRNA expression ratios in normal ovary and epithelial ovarian cancer
BORIS is the only known paralog of the chromatin insulator CTCF and has an opposing function in gene regulation (18). We recently showed that an elevated BORIS/CTCF mRNA expression ratio is a biomarker for global DNA hypomethylation and poor prognosis in EOC (24). Here, we determined BORIS isoform family expression in EOC measured as a function of CTCF expression. We determined CTCF mRNA expression by RT-qPCR in NO, LINE-1 hypomethylated, and LINE-1 hypermethylated EOC samples. CTCF was significantly downregulated in both EOC groups as compared to NO (Figure 4A). This finding is consistent with the proposed role of CTCF as a tumor suppressor (20). Next, we determined BORIS isoform/CTCF mRNA expression ratios in NO and EOC. Similar to the data shown in Figure 1 for BORIS isoform family expression alone, BORIS sf1/CTCF, but not other BORIS isoform families, was highly elevated in EOC (data not shown). We additionally compared BORIS isoform/CTCF expression in the differentially methylated EOC groups. BORIS sf1, sf2, and sf6 were significantly elevated in LINE-1 hypomethylated EOC as compared to LINE-1 hypermethylated EOC (Figure 4, B–D). No significant difference was seen for BORIS sf3 and sf4 (data not shown). Taken together, these data strengthen the link between elevated BORIS/CTCF expression and global DNA hypomethylation in EOC, and suggest that this association is a characteristic of some, but not all, BORIS variants.
Figure 4.
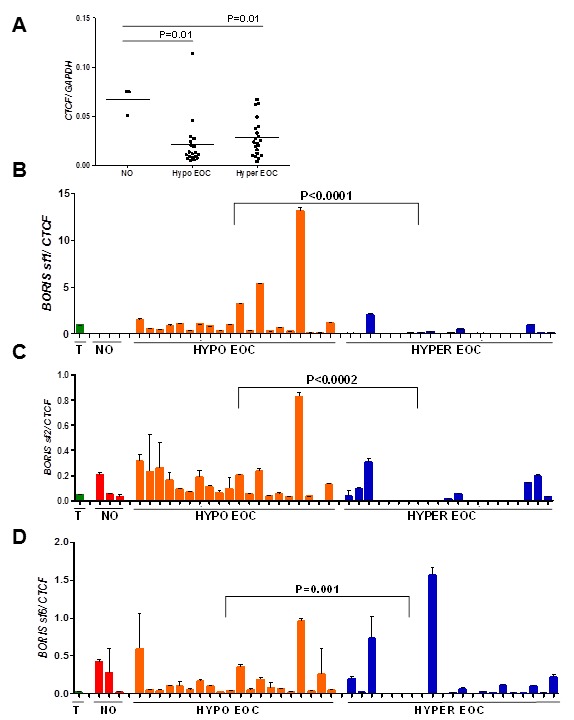
BORIS isoform/CTCF expression in normal ovary and epithelial ovarian cancer. (A) CTCF mRNA expression was measured using RT-qPCR in NO, LINE-1 hypomethylated, and LINE-1 hypermethylated EOC samples. Mean lines and significant p values are shown. (B–D) BORIS sf1/CTCF (B), sf2/CTCF (C), and sf6/CTCF (D) mRNA expression ratios were determined using RT-qPCR. Bars indicate means +1 SD, and p values indicate significant differences between hypomethylated and hyper-methylated EOC. T = human testis RNA. Note: BORIS sf1 expression was not detected in NO.
Epigenetic regulation of BORIS isoform family expression in epithelial ovarian cancer cell lines
We used a pharmacological approach to determine the functional connection between BORIS isoform expression and epigenetic regulation in EOC. For this task, we treated EOC cells with two different epigenetic modulatory drugs to assess the role of the corresponding epigenetic marks in BORIS isoform family regulation. We treated four different ovarian cancer cell lines (OVCAR3, OVCAR429, SKOV3, and A2780) and an immortalized normal ovarian surface epithelial cell line (IOSE121) with the DNMTi decitabine (DAC) and/or the HDACi Trichostatin A (TSA) as described in the Materials and Methods, using the drug concentrations shown in Figure 5A. Overall, we observed a marked induction of numerous BORIS isoform families following treatment with these epigenetic modulators (Figure 5, B–F). In general, BORIS sf2 showed the lowest level of induction, while other BORIS isoform families were more responsive (Figure 5, B–F). The response to epigenetic drugs was both isoform family- and cell line-specific. When considering the different isoform families, BORIS sf1, sf4, and sf6 generally showed a lower level of baseline expression and were most robustly induced by decitabine alone or decitabine + TSA (Figure 5, B–F). In contrast, BORIS sf3 generally showed a higher level of baseline expression, and was induced by these agents to a lesser extent (Figure 5, B–F). When considering the different cell lines, 3/5 cell types examined (IOSE121, OVCAR429, A2780) showed the greatest level of BORIS isoform family induction when decitabine and TSA were used in combination (Figure 5, B, D, and F). In contrast, one cell line (OVCAR3) showed maximal induction with decitabine alone (Figure 5C), and one cell line (SKOV3) showed maximal induction with TSA alone (Figure 5E). In contrast to BORIS isoforms, CTCF showed no consistent pattern of expression in EOC cell lines treated with epigenetic modulators (data not shown). These data provide functional confirmation that epigenetic marks play key roles in regulating BORIS isoform family expression in EOC.
Figure 5.
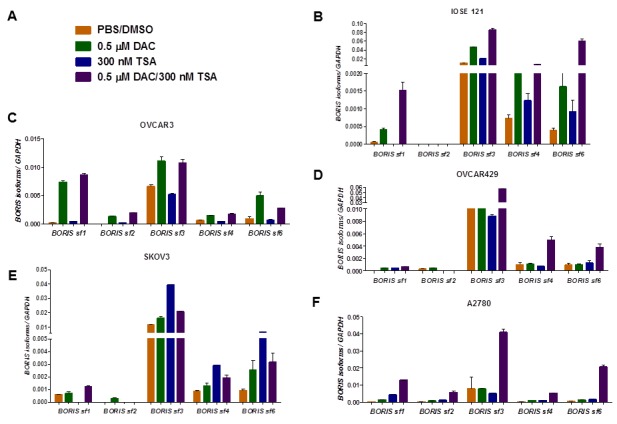
BORIS isoform expression in epithelial ovarian cancer cell lines treated with epigenetic modulatory drugs. (A) Sample key. DAC (decitabine) and TSA (Trichostatin A) were used at the indicated drug concentrations, and PBS/DMSO served as the negative control. (B–F) Cells were treated with the indicated agents alone or in combination, as described in the Materials and Methods, and BORIS isoform family mRNA expression was measured using RT-qPCR. (B) IOSE121 cells, (C) OVCAR3 cells, (D) OVCAR429 cells, (E) SKOV3 cells, (F) A2780 cells. Mean bars +1 SD are shown.
Discussion
Here we report on BORIS isoform family expression in EOC, and describe the role of epigenetic processes in their regulation. Our findings reveal that: i) BORIS sf1 family is not expressed in NO, but is highly expressed in EOC; ii) BORIS sf2, sf3, sf4, and sf6 families are expressed in both NO and EOC; iii) BORIS sf5 is not expressed at detectable levels in either NO or EOC; iv) BORIS sf1 and sf2 are upregulated in globally hypomethylated EOC tumors, either in unstratified samples or in tumors matched for stage or histology; v) BORIS sf1/CTCF, sf2/CTCF, and sf6/CTCF mRNA expression is significantly elevated in globally hypomethylated EOC tumors; and vi) DNMTi and HDACi induce BORIS isoform expression in EOC cell lines, in an isoform- and cell line-specific manner.
It is likely that our detection of BORIS expression in bulk NO is due to the presence of germ cells (oocytes) in this tissue. This hypothesis is supported by the fact that BORIS isoform expression, with the exception of BORIS sf3, was significantly lower in IOSE121 cells, which are derived from ovarian surface epithelium, as compared to the normal ovary (compare the axes in Figure 1A and Figure 5B). Future studies will seek to measure BORIS expression in selected populations of primary human cells likely to represent the cells of origin of EOC. These experiments will require obtaining high quality RNA from epithelial cells lining the normal human ovary and fallopian tubes (26).
Among BORIS isoform families, only BORIS sf1 and sf2 show significantly increased expression in hypomethylated EOC. This observation extends our earlier report, which showed that BORIS B0 (a member of BORIS sf1) is expressed in globally hypomethylated tumors (24). These data provide further evidence that CG antigen gene expression in cancer is in part a consequence of global epigenetic deregulation (27). Upregulation of BORIS sf1 and sf2 family members in hypomethylated EOC is likely to impact gene expression in the affected tumors. All members of BORIS sf1 and sf2 contain the same N-terminal region (N258), which includes a transcriptional activation domain, and each member can bind CTCF sites (21). The N258 region is conserved among the most frequently expressed individual BORIS isoform proteins, suggesting its functional importance (21). Among the targets of the N258 domain are the murine and human CST genes (21). While the N-terminal region of BORIS sf1 and sf2 is conserved, members of these isoform families can express distinct zinc fingers, which is thought to allow BORIS to bind a diversity of genomic targets, depending on which transcript variants are expressed in specific cells or tissues. In addition, both the N- and C-termini of BORIS isoforms, as well as the central zinc finger domain, influence the nature and migration of BORIS-DNA complexes with the IGF2/H19 ICR in EMSA assays, suggesting subtle but distinct functional roles for individual isoforms (21).
We recently reported that an elevated BORIS/CTCF mRNA expression ratio coincides with global DNA hypomethylation in EOC (24). In the present study, we observed specific elevation of the BORIS sf1/CTCF, sf2/CTCF, and sf6/CTCF ratios in hypomethylated EOC. Of these, the BORIS sf1/CTCF ratio was the single best discriminator of hypomethylated and hypermethylated tumors. BORIS B0, the previously measured isoform, is a member of the BORIS sf1 isoform family, and is the dominantly expressed isoform in the family (21, 24). Thus, it is plausible that assays which specifically measure the BORIS B0/CTCF ratio may be the most suitable marker for global hypomethylation in EOC. The mechanism by which altered BORIS/CTCF expression may contribute to global DNA hypomethylation in EOC is a topic of current investigation.
With regard to the mechanism of BORIS isoform regulation, it is important to consider the BORIS promoter structure. Lobanenkov and co-workers have reported the existence of three different BORIS promoters (A, B, C), and that promoters B and C are regulated by DNA methylation (22). However, our previous RLM-RACE study of BORIS expression in human testis, DNMT1/DNMT3b-deficient cancer cells, and EOC tumors only revealed transcription emanating from the CpG island region that resides between the reported promoters B and C (7). This apparent discrepancy regarding the usage of promoter A may be due to the different samples studied, or due to the high sensitivity methods employed by Renauld et al. to detect transcripts derived from promoter A, which involved nested PCR amplifications (22). In any event, the data from both groups reveal an important role for DNA methylation in BORIS gene regulation, and our present data suggest that this is true for all BORIS isoform families. In addition to DNA methylation, CTCF was reported as a negative regulator of BORIS expression (22). However, in the current study, we did not observe an inverse relationship between CTCF and BORIS expression in EOC, as might have been expected if CTCF represses BORIS (data not shown). Wild-type p53 has also been reported as a negative regulator of BORIS expression (22). This model is supported by our data, in that p53 mutations are extremely common (i.e., 96%) in HG-SOC (28), and we frequently observe BORIS expression in this disease. However, the almost ubiquitous presence of p53 mutations in HG-SOC suggests that other tumor models with more heterogeneous p53 mutations will prove more informative to study this relationship.
We show that multiple BORIS isoforms are activated synergistically by DAC + TSA treatment, indicating that both DNA hypomethylation and histone acetylation are required for expression of some BORIS isoforms in EOC cells. This observation draws a parallel with the known interplay between these epigenetic marks in cancer cells and their cooperativity in tumor suppressor gene repression (29, 30). The present findings also lend support to the idea that epigenetic modulators could be useful for augmenting the efficacy of future immunotherapy approaches directed against BORIS (14, 15, 31).
Finally, we note that a limitation of our study is that while we characterized the expression of the six BORIS isoform families, we did not quantify the expression of the 23 BORIS transcript variants individually. Pugacheva et al. were able to garner information on the expression of a substantial number of individual BORIS isoforms in two biological samples using a combination of techniques including RT-qPCR, Northern blot, and standard RT-PCR analysis (21). However, the methodology employed was laborious and not easily amenable to analysis of a large number of samples, as profiled in the current study. In the future, it is possible that a more complete analysis of specific BORIS transcript variant expression in large sample sets could be achieved using next generation sequencing approaches. The resulting information would be highly relevant for beginning to decipher the precise biological impact of BORIS variant expression in individual tumors.
Acknowledgments
We thank Drs. Nelly Auersperg and Bert Vogelstein for kindly providing cell lines. We thank Dr. Stacey Akers for assistance with the clinical data. This work was supported by NIH R01CA116674 (ARK) and the Ovarian Cancer Research Fund (KO and ARK). Author contributions: PAL, ARK designed the study; PAL, WZ performed the experiments; PAL, ARK analyzed the data; KO contributed reagents; PAL, ARK wrote the paper.
Abbreviations
- BORIS
Brother of the Regulator of Imprinting Sites;
- CG antigen
cancer germline antigen;
- CTCF
CCCTC-binding factor;
- CTCFL
CTCF-like protein;
- DAC
5-aza-2’-deoxycytidine;
- EOC
epithelial ovarian cancer;
- NO
normal ovary
Materials and methods
Patient samples and RNA extraction
Human testis RNA was purchased from BioChain, Inc. Normal ovary (NO, n = 3) and epithelial ovarian cancer (EOC, n = 41) samples were obtained from patients at Roswell Park Cancer Institute (RPCI) under IRB-approved protocols. NO samples were obtained from women undergoing oophorectomy for benign conditions. EOC samples have been described in detail previously (32). Based on H&E staining, all EOC tissues were estimated to contain ≥ 90% neoplastic cells. Samples were homogenized using a motor pestle and total RNA was extracted using TRIzol (Invitrogen). RNA was quantified using the Nanodrop instrument (Thermo Scientific), and RNA integrity was assessed using denaturing agarose gel electrophoresis.
LINE-1 pyrosequencing
LINE-1 repetitive element methylation was determined by sodium bisulfite pyrosequencing as described previously (32). Briefly, genomic DNA was isolated using the Puregene kit (QIAGEN), and 1 μg DNA was sodium bisulfite converted using the EZ DNA Methylation Kit (Zymo Research). Pyrosequencing was conducted using the PSQ HS96 system (QIAGEN). Unmethylated and methylated genomic DNAs were run as controls, and samples were analyzed in duplicate using independent PCR reactions.
Reverse transcriptase quantitative PCR (RT-qPCR)
One μg of RNA was DNAse-treated using the DNA-free kit (Ambion), and cDNA was generated using the iScript cDNA synthesis kit (Bio-Rad). 2 μl of 1:5 cDNA sample dilutions were used in qPCR reactions. mRNA levels of BORIS isoform families sf1–sf6, CTCF, and GAPDH were determined using primer and probe sets (Applied Biosystems) and absolute quantification methods as described previously (21). Standard curves were prepared using gel-purified end-point RT-PCR products amplified from testis RNA. PCR reactions were performed in triplicate using an Applied Biosystems 7300 System and the TaqMan master mix (Applied Biosystems). The cycling conditions were: 50°C for 2 min, 95°C for 10 min, 40 cycles of 95°C for 15 sec, and 60°C for 1 min.
Cell lines and drug treatments
EOC cell lines (OVCAR3, OVCAR429, A2780, SKOV3) were obtained from ATCC and were propagated as described previously (7). SV40 immortalized normal human ovarian surface epithelium cells (IOSE121) were obtained from Dr. Nelly Auersperg (University of British Columbia) and the Canadian Ovarian Tissue Bank, and propagated as described previously (7). DAC (5-aza-2’-deoxycytidine; decitabine) and TSA (Trichostatin A) were obtained from Sigma. Cells were treated with 0.5 μM DAC resuspended in PBS, and 300 nM TSA resuspended in DMSO, alone or in combination as follows: for DAC-only treatments, DAC was added on day 0 and day 2, and cell extracts were harvested on day 5; for TSA-only treatments, TSA was added on day 0 and cell extracts were harvested on day 2; for combination treatments, DAC was added on day 0 and day 2, and TSA was added on day 3, and cell extracts were harvested on day 5. PBS + DMSO treated cells served as the negative control. Drug concentrations were chosen based on maximal inhibition of DNA methylation and/or induction of histone acetylation, together with manageable cytotoxicity. RNA was extracted and processed for gene expression analysis as described above.
Statistical analysis
Sample groups were compared using the Mann-Whitney test, using GraphPad Prism software. Significant p values (p < 0.05) are indicated.
References
- 1.Cannistra SA. Cancer of the ovary. N Engl J Med. 2004;351:2519–2529. doi: 10.1056/NEJMra041842. [DOI] [PubMed] [Google Scholar]
- 2.Crum CP, Drapkin R, Miron A, Ince TA, Muto M, Kindelberger DW, Lee Y. The distal fallopian tube: A new model for pelvic serous carcinogenesis. Curr Opin Obstet Gynecol. 2007;19:3–9. doi: 10.1097/GCO.0b013e328011a21f. [DOI] [PubMed] [Google Scholar]
- 3.Simpson AJ, Caballero OL, Jungbluth A, Chen YT, Old LJ. Cancer/testis antigens, gametogenesis and cancer. Nat Rev Cancer. 2005;5:615–625. doi: 10.1038/nrc1669. [DOI] [PubMed] [Google Scholar]
- 4.Scudellari M. A ballsy search for cancer targets. Nat Med. 2011;17:916–918. doi: 10.1038/nm0811-916. [DOI] [PubMed] [Google Scholar]
- 5.D’Arcy V, Pore N, Docquier F, Abdulla ZK, Chernukhin I, Kita GX, Rai S, Smart M, Farrar D, Pack S, Lobanenkov V, Klenova E. BORIS, a paralogue of the transcription factor, CTCF, is aberrantly expressed in breast tumours. Br J Cancer. 2008;98:571–579. doi: 10.1038/sj.bjc.6604181. [DOI] [PMC free article] [PubMed] [Google Scholar]
- 6.Risinger JI, Chandramouli GV, Maxwell GL, Custer M, Pack S, Loukinov D, Aprelikova O, Litzi T, Schrump DS, Murphy SK, Berchuck A, Lobanenkov V, Barrett JC. Global expression analysis of cancer/testis genes in uterine cancers reveals a high incidence of BORIS expression. Clin Cancer Res. 2007;13:1713–1719. doi: 10.1158/1078-0432.CCR-05-2569. [DOI] [PubMed] [Google Scholar]
- 7.Woloszynska-Read A, James SR, Link PA, Yu J, Odunsi K, Karpf AR. DNA methylation-dependent regulation of BORIS/CTCFL expression in ovarian cancer. Cancer Immun. 2007;7:21. [PMC free article] [PubMed] [Google Scholar]
- 8.Renaud S, Loukinov D, Alberti L, Vostrov A, Kwon YW, Bosman FT, Lobanenkov V, Benhattar J. BORIS/CTCFL-mediated transcriptional regulation of the hTERT telomerase gene in testicular and ovarian tumor cells. Nucleic Acids Res. 2011;39:862–873. doi: 10.1093/nar/gkq827. [DOI] [PMC free article] [PubMed] [Google Scholar]
- 9.Hong JA, Kang Y, Abdullaev Z, Flanagan PT, Pack SD, Fischette MR, Adnani MT, Loukinov DI, Vatolin S, Risinger JI, Custer M, Chen GA, Zhao M, Nguyen DM, Barrett JC, Lobanenkov VV, Schrump DS. Reciprocal binding of CTCF and BORIS to the NYESO-1 promoter coincides with derepression of this cancer-testis gene in lung cancer cells. Cancer Res. 2005;65:7763–7774. doi: 10.1158/0008-5472.CAN-05-0823. [DOI] [PubMed] [Google Scholar]
- 10.Woloszynska-Read A, James SR, Song C, Jin B, Odunsi K, Karpf AR. BORIS/CTCFL expression is insufficient for cancer-germline antigen gene expression and DNA hypomethylation in ovarian cell lines. Cancer Immun. 2010;10:6. [PMC free article] [PubMed] [Google Scholar]
- 11.Vatolin S, Abdullaev Z, Pack SD, Flanagan PT, Custer M, Loukinov DI, Pugacheva E, Hong JA, Morse H, 3rd, Schrump DS, Risinger JI, Barrett JC, Lobanenkov VV. Conditional expression of the CTCF-paralogous transcriptional factor BORIS in normal cells results in demethylation and derepression of MAGE-A1 and reactivation of other cancer-testis genes. Cancer Res. 2005;65:7751–7762. doi: 10.1158/0008-5472.CAN-05-0858. [DOI] [PubMed] [Google Scholar]
- 12.Kholmanskikh O, Loriot A, Brasseur F, De Plaen E, De Smet C. Expression of BORIS in melanoma: Lack of association with MAGE-A1 activation. Int J Cancer. 2008;122:777–784. doi: 10.1002/ijc.23140. [DOI] [PubMed] [Google Scholar]
- 13.Cheever MA, Allison JP, Ferris AS, Finn OJ, Hastings BM, Hecht TT, Mellman I, Prindiville SA, Viner JL, Weiner LM, Matrisian LM. The prioritization of cancer antigens: A national cancer institute pilot project for the acceleration of translational research. Clin Cancer Res. 2009;15:5323–5337. doi: 10.1158/1078-0432.CCR-09-0737. [DOI] [PMC free article] [PubMed] [Google Scholar]
- 14.Mkrtichyan M, Ghochikyan A, Loukinov D, Davtyan H, Ichim TE, Cribbs DH, Lobanenkov VV, Agadjanyan MG. DNA, but not protein vaccine based on mutated BORIS antigen significantly inhibits tumor growth and prolongs the survival of mice. Gene Ther. 2008;15:61–64. doi: 10.1038/sj.gt.3303044. [DOI] [PMC free article] [PubMed] [Google Scholar]
- 15.Mkrtichyan M, Ghochikyan A, Davtyan H, Movsesyan N, Loukinov D, Lobanenkov V, Cribbs DH, Laust AK, Nelson EL, Agadjanyan MG. Cancer-testis antigen, BORIS based vaccine delivered by dendritic cells is extremely effective against a very aggressive and highly metastatic mouse mammary carcinoma. Cell Immunol. 2011;270:188–197. doi: 10.1016/j.cellimm.2011.05.007. [DOI] [PMC free article] [PubMed] [Google Scholar]
- 16.Ghochikyan A, Mkrtichyan M, Loukinov D, Mamikonyan G, Pack SD, Movsesyan N, Ichim TE, Cribbs DH, Lobanenkov VV, Agadjanyan MG. Elicitation of T cell responses to histologically unrelated tumors by immunization with the novel cancer-testis antigen, brother of the regulator of imprinted sites. J Immunol. 2007;178:566–573. doi: 10.4049/jimmunol.178.1.566. [DOI] [PMC free article] [PubMed] [Google Scholar]
- 17.Loukinov DI, Pugacheva E, Vatolin S, Pack SD, Moon H, Chernukhin I, Mannan P, Larsson E, Kanduri C, Vostrov AA, Cui H, Niemitz EL, Rasko JE, Docquier FM, Kistler M, Breen JJ, Zhuang Z, Quitschke WW, Renkawitz R, Klenova EM, Feinberg AP, Ohlsson R, Morse HC, 3rd, Lobanenkov VV. BORIS, a novel male germ-line-specific protein associated with epigenetic reprogramming events, shares the same 11-zinc-finger domain with CTCF, the insulator protein involved in reading imprinting marks in the soma. Proc Natl Acad Sci U S A. 2002;99:6806–6811. doi: 10.1073/pnas.092123699. [DOI] [PMC free article] [PubMed] [Google Scholar]
- 18.Klenova EM, Morse HC, 3rd, Ohlsson R, Lobanenkov VV. The novel BORIS + CTCF gene family is uniquely involved in the epigenetics of normal biology and cancer. Semin Cancer Biol. 2002;12:399–414. doi: 10.1016/s1044-579x(02)00060-3. [DOI] [PubMed] [Google Scholar]
- 19.Hore TA, Deakin JE, Marshall Graves JA. The evolution of epigenetic regulators CTCF and BORIS/CTCFL in amniotes. PLoS Genet. 2008;4:e1000169. doi: 10.1371/journal.pgen.1000169. [DOI] [PMC free article] [PubMed] [Google Scholar]
- 20.Fiorentino FP, Giordano A. The tumor suppressor role of CTCF. J Cell Physiol. 2012;227:479–492. doi: 10.1002/jcp.22780. [DOI] [PubMed] [Google Scholar]
- 21.Pugacheva EM, Suzuki T, Pack SD, Kosaka-Suzuki N, Yoon J, Vostrov AA, Barsov E, Strunnikov AV, Morse HC, 3rd, Loukinov D, Lobanenkov V. The structural complexity of the human BORIS gene in gametogenesis and cancer. PLoS One. 2010;5:e13872. doi: 10.1371/journal.pone.0013872. [DOI] [PMC free article] [PubMed] [Google Scholar]
- 22.Renaud S, Pugacheva EM, Delgado MD, Braunschweig R, Abdullaev Z, Loukinov D, Benhattar J, Lobanenkov V. Expression of the CTCF-paralogous cancer-testis gene, brother of the regulator of imprinted sites (BORIS), is regulated by three alternative promoters modulated by CpG methylation and by CTCF and p53 transcription factors. Nucleic Acids Res. 2007;35:7372–7388. doi: 10.1093/nar/gkm896. [DOI] [PMC free article] [PubMed] [Google Scholar]
- 23.Rosa-Garrido M, Ceballos L, Alonso-Lecue P, Abraira C, Delgado MD, Gandarillas A. A cell cycle role for the epigenetic factor CTCFL/BORIS. PLoS One. 2012;7:e39371. doi: 10.1371/journal.pone.0039371. [DOI] [PMC free article] [PubMed] [Google Scholar]
- 24.Woloszynska-Read A, Zhang W, Yu J, Link PA, Mhawech-Fauceglia P, Collamat G, Akers SN, Ostler KR, Godley LA, Odunsi K, Karpf AR. Coordinated cancer germline antigen promoter and global DNA hypomethylation in ovarian cancer: Association with the BORIS/CTCF expression ratio and advanced stage. Clin Cancer Res. 2011;17:2170–2178. doi: 10.1158/1078-0432.CCR-10-2315. [DOI] [PMC free article] [PubMed] [Google Scholar]
- 25.de Necochea-Campion R, Ghochikyan A, Josephs SF, Zacharias S, Woods E, Karimi-Busheri F, Alexandrescu DT, Chen CS, Agadjanyan MG, Carrier E. Expression of the epigenetic factor BORIS (CTCFL) in the human genome. J Transl Med. 2011;9:213. doi: 10.1186/1479-5876-9-213. [DOI] [PMC free article] [PubMed] [Google Scholar]
- 26.Ahmed AA, Becker CM, Bast RC., Jr The origin of ovarian cancer. BJOG. 2012;119:134–136. doi: 10.1111/j.1471-0528.2011.03149.x. [DOI] [PubMed] [Google Scholar]
- 27.Akers SN, Odunsi K, Karpf AR. Regulation of cancer germline antigen gene expression: Implications for cancer immunotherapy. Future Oncol. 2010;6:717–732. doi: 10.2217/fon.10.36. [DOI] [PMC free article] [PubMed] [Google Scholar]
- 28.Cancer Genome Atlas Research Network Integrated genomic analyses of ovarian carcinoma. Nature. 2011;474:609–615. doi: 10.1038/nature10166. [DOI] [PMC free article] [PubMed] [Google Scholar]
- 29.Cameron EE, Bachman KE, Myohanen S, Herman JG, Baylin SB. Synergy of demethylation and histone deacetylase inhibition in the re-expression of genes silenced in cancer. Nat Genet. 1999;21:103–107. doi: 10.1038/5047. [DOI] [PubMed] [Google Scholar]
- 30.Karpf AR, Jones DA. Reactivating the expression of methylation silenced genes in human cancer. Oncogene. 2002;21:5496–5503. doi: 10.1038/sj.onc.1205602. [DOI] [PubMed] [Google Scholar]
- 31.Karpf AR. A potential role for epigenetic modulatory drugs in the enhancement of cancer/germ-line antigen vaccine efficacy. Epigenetics. 2006;1:116–120. doi: 10.4161/epi.1.3.2988. [DOI] [PMC free article] [PubMed] [Google Scholar]
- 32.Woloszynska-Read A, Mhawech-Fauceglia P, Yu J, Odunsi K, Karpf AR. Intertumor and intratumor NY-ESO-1 expression heterogeneity is associated with promoter-specific and global DNA methylation status in ovarian cancer. Clin Cancer Res. 2008;14:3283–3290. doi: 10.1158/1078-0432.CCR-07-5279. [DOI] [PMC free article] [PubMed] [Google Scholar]