Abstract
Analysis of anomericity is one of the most important issues in the structure elucidation of carbohydrates. Mass spectrometry (MS)-based methods are of particular interest and important to address the issue related to resolving anomericity of monosaccharide units in a glycan. However, direct analysis of hemiacetals has not been possible by MS because of the nonavailability of information regarding the gas-phase behavior of such ion species. We addressed this issue by using stage-discriminated energy-resolved mass spectrometry (ERMS) at the stages of MSn and MSn+1 and showed that such analysis can be made. This was achieved by proving that individual anomers can be identified and that the equilibrium of sodium adducted ion species of α- and β-anomers can be negated in the gas phase under collision-induced dissociation (CID) conditions. On the basis of these results, we could 1) observe the mutarotation of lactose and 2) speculate the hydrolysis mechanism of endo-glycosylceramidase by using mass spectrometry.
Keywords: Gas-phase reaction, mass spectrometry, collision-induced dissociation, anomeric configuration, mechanism, anomerization
Introduction
The diverse glycans often serve as biochemical markers determining the antigenicity of molecules in immunity and host specificity in infectious diseases.1)–3) Expanding interest in the biology of glycoconjugates has not only prompted but also necessitated that many researchers investigate their structures themselves, because most secreted and membrane-anchored proteins and sphingolipids are glycosylated as a part of post-translational modifications taking place in the Golgi apparatus. An important issue in the structural elucidation is to address isomeric structures formed as a result of combination of stereoisomers, ring size, linkage position, and branching that are not generally present in other biopolymers with the exception of the sequence isomers. However, the amount of glycans available often limits the analytical methods to be employed. The use of mass spectrometry in the analysis of glycan structure is a current focus area because of its low sample consumption, which is at a low picomole level.4),5) Mass spectrometry (MS) that involves collision-induced dissociation (CID) is considered to be useful for such investigations. The ions of a molecule with a proton, metal ions, or a deprotonated molecule can be made to collide with a molecule of a neutral gas such as helium under low-energy collision-induced MS/MS experimental conditions. The collision leads to conversion of the kinetic energy of a molecular ion or a trapped ion species into potential energy, and eventually leads to the formation of a series of fragment ions and molecules. CID, especially that carried out on a quadrupole ion-trap mass spectrometer (QITMS)6) has been shown to be extremely important in the structure elucidation of glycans because it can be used to obtain information on the precursor ion, which is the subject to be fragmented, through repeated ion-molecule reactions at multiple CID stages (MSn).7)–10) The collision energy can be controlled in order to observe the energy dependence of the dissociation reactions (Fig. 1a).11),12) With this powerful technique, energy-resolved mass spectrometry (ERMS), investigation of isomeric oligosacchar-ides has been carried out.13)–19) The advantage of this method is that it can be used to distinguish closely related glycans, such as anomers of glycosides and linkage isomers.15)–18),20),21) Furthermore, we recently reported that the purity of an analyte can be studied by ERMS by comparing two sets of ERMS data obtained at different stages of MS/MS, named as stage-discriminated correlation (SDC) of ERMS.22) In our investigation, we found that the analyte consists of a pair of sodiated hemiacetals (α/β-anomeric mixture) was judged as a mixture. This suggests that each anomer can be identified and that anomerization may not occur under the low-energy CID conditions used in our investigations. However, the question of whether individual hemiacetals anomerized still remained. This is quite important because the hemiacetal ion species called C-ions are often produced under CID conditions and further fragmentation patterns of such ions are compared to deduce their structures. If the C-ions isomerize (anomerize), one has to take great precaution for the use the spectra in structural determination. In order to answer this question and provide reliability in MS-based structural analysis, the gas-phase behavior and configuration of C-ions must be investigated.
Fig. 1.
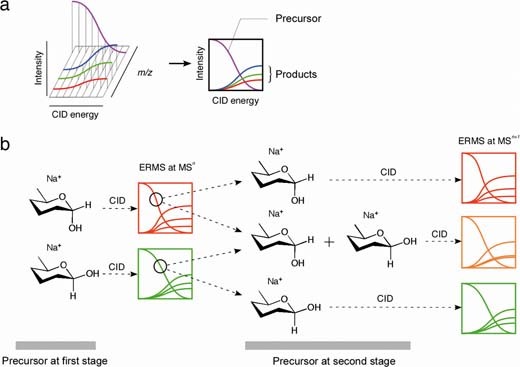
a: ERMS spectra and the graphs used in this study. A series of MS/MS spectra is obtained first where CID energy is varied. From the obtained three dimensional ERMS data, a projection of CID energy over signal intensity is used to describe the dissociation of a precursor ion to produce a series of product ions. b: A method for investigating the structural change in a given ion under CID conditions. Upon CID of a precursor ion, a series of fragment ions are generated. At some point of the CID process, the unfragmented precursor (indicated by a circle) is isolated and is subjected to a second CID. Subsequently, the characteristics of the two precursors are determined by comparing their fragmentation profiles obtained by ERMS.
We conducted a set of ERMS experiments of a sodiated hemiacetal ion species at different stages of CID (MSn vs. MSn+1) in order to investigate whether the fragmentation patterns differ between the obtained spectra. After the first CID experiment, the unfragmented precursor ion was isolated and once again subjected to CID.
Herein, for the first time, we report evidence for the fact that the sodiated hemiacetal ion species did not isomerize under CID conditions. On the basis of this result, we used our method for observing the mutarotation process of lactose, and accomplished for the first time by using mass spectrometry. The method was also shown to be very powerful for investigating the mechanism of glycosidase-catalyzed reactions.
Materials and methods
Materials. Samples of α-enriched lactose (8) and β-enriched lactose (9) were obtained from Sigma, St. Louis, MO. The α- and β-anomers of Boc-protected 4-aminobutyl lactosides (1α and 1β) were synthesized according to the procedure described in a reference.18) β-Gal-(1 → 3)-α-GlcNAc-O(CH2)4NHBoc (3α) and β-Gal-(1 → 3)-β-GlcNAc-O(CH2)4NHBoc (3β) were synthesized from phenyl 2-azido-3,4,6-tri-O-benzyl-2-deoxy-1-thio-β-d-glucopyranoside (4) and 4-(N-Boc-amino)butanol (5) via 4-(N-Boc-amino)butyl 2-azido-3,4,6-tri-O-benzyl-2-deoxy-d-glucopyranoside (6) and 4-(N-Boc-amino)butyl 2-acetamido-2-deoxy-α- and -β-d-glucopyranoside (7), followed by galactosylation using β-galactosidase (See below for the experimental details). For analyses that involved the use of a mass spectrometer, HPLC grade solvents—MeOH and anhydrous DMSO—were used (Wako Pure Chemical Industries Ltd., Osaka, Japan). Deuterated methyl sulfoxide-d6 (NMR Grade) (Acros Organics, Geel, Belgium) was used for NMR experiments. Bovine lactosyl ceramide was purchased from Calbiochem: EMD Biosciences Inc., La Jolla, CA, USA. Recombinant endo-glycosylceramidase II isolated from Rhodococcus sp. [EC 3.2.1.123] was purchased from Takara Bio Inc., Shiga, Japan.
Instrumentation and data collection. Samples were analyzed using a quadrupole ion-trap mass spectrometer coupled with an electrospray interface (Esquire 3000 plus, Bruker Daltonics GmbH, Bremen, Germany). Samples dissolved in anhydrous DMSO (1 pmol/μL) were introduced into the ion source via infusion (flow rate: 120 μL/h). The analytical conditions were as follows: 1) “dry temperature”, 250 °C; 2) nebulizer gas (N2), 10 psi; 3) dry gas (N2), 4.0 L/min; 4) “Smart frag.,” off; 5) scan range, m/z 50–600 (lactose, synthetic) and m/z 50–400 (lactose, commercial); 6) compound stability, 300%; 7) ICC target, 8000; 8) maximum acquisition time, 200 ms; 9) average number of spectra, 10; and 10) “cutoff,” 27.6% (synthetic lactose) and 27.1% (commercial lactose) of the corresponding precursor ion. In our MSn experiments, the end cap radio frequency (rf) amplitude for activating precursor ion through controlling the ion motion was increased in 0.02-V increments until the precursor ion could no longer be detected (plateau at less than 0.9% of total ion current). Only the end cap rf amplitude was controlled during the CID experiments. The He pressure was maintained at 4.86 × 10⁻⁶ mbar, and the CID time was 40 ms. Averages of m – 4 spectra were used for CID experiments (m = 15–28, where m is the number of spectra obtained during the experiment). To avoid inaccuracies in the measurements, the first and the last two data sets, which correspond to the transient period before the steady state in an rf amplitude step, were neglected. Isotopic peaks corresponding to [Ii + 1] and [Ii + 2], where In indicates a fragment ion, were used for the calculations (see also Data handling). For the isolation of a product ion, fragment ions corresponding to m/z ± 2 (w = 2) were isolated and subjected to the CID experiments to include isotopes.
Data handling. In order to obtain graphs of the ERMS, the equation given below was used. When an ion “IP” produces a series of product ions, I1, I2, I3, . . . Ii, the relative ion currents for individual ions are defined by the equation
| [1] |
where relC is the ion current of a particular observed ion expressed as a percentage of the total ion current. CIi is the observed ion current in focus, and CIP is the ion current of a precursor ion. Calculations were performed using a program that we developed with Excel (Excel 2000, Microsoft Corp.), which was based on the DSUM function and was programmed to choose a range of isotopes (w) to be taken into consideration (w = 2 in the experiments).
Sigmoidal curve fittings. A set of MSn data obtained at various rf amplitudes (end cap) on a mass spectrometer was analyzed using Excel. Sets of peaks having certain m/z values were grouped together as a data series. The relative intensities of each individual signal in the total ion current were obtained at each amplitude (Eq. 1). The data were analyzed using Prism 4 (GraphPad Software Inc.). Individual data sets were fitted using the Boltzmann sigmoidal function with nonlinear regression analysis [Eqs. 2 (growth) and 3 (decay)].
| [2] |
| [3] |
where the parameters “a”, “b” and “c” denote the maximum response, half the maximum response, and the slope, respectively, which were obtained for each curve.
In the data series used in this report, the sigmoidal curves and parameters were obtained by plotting regression curves for all the data obtained from the above Excel program.
Stage-discriminated correlation (SDC). In the SDC, ERMS spectra were compared at the stages of MSn and MSn+1, MS4 and MS5 in the current experiments. The spectrum at MSn+1 was obtained using isolated precursor ions at MSn when ca. 25% consumed. The sum of distances from a hypothetical curve (y = x) describes the differences of a set of spectra. For this purpose, we define the distance d to be,
| [4] |
where ai is the intensity of a fragment i, n indicates the stage of CID experiments, and m is the total number of observed ions (i). l is the number of data points obtained along with rf amplitude for individual i in ERMS. Therefore, the d value indicates departure from the theoretical value (d = 0). Note that all data obtained for ERMS, except for the data sets of fragment ions with lesser intensities (less than 5% of total intensity), were used as ai. According to our statistical analysis, we use d = 1.5 as a border line. The substances with d values smaller that this is considered to be “pure” or more accurately “not identified as mixture” otherwise mixture.22)
Mutarotation. Aqueous solutions (10 mg/mL, 25 °C) of α- and β-enriched lactose were prepared for all experiments and fractionated by 0.1 mL at the designated time period up to 4 h. The fractions were frozen immediately using liquid nitrogen and then lyophilized. Each sample was dissolved in anhydrous DMSO and DMSO-d6 and analyzed by MS and NMR. DMSO was used as a solvent for the experiments because aprotic solvents prevent anomerization.23)
Sample consumption for measurement by MS. Solutions of α- and β-enriched lactose in DMSO (1 pmol/μL) were used for the MS-based analysis. A volume of 12.3 μL of the solution was used under the infusion conditions (120 μL/h, 6 min). A total of 123 pmol of each compound was consumed in the experiment.
NMR analysis.1H NMR (500 MHz) spectra were recorded with an Avance 500 spectrometer. The ratio of α-lactose to β-lactose in DMSO-d6 was determined by the integration of hydroxyl protons at the anomeric position (glucose moiety).
Optical rotation. Aqueous solutions of α- and β-enriched lactose (10 mg/mL) were rapidly poured into a 10-cm cell, and their optical rotations were measured at 25 °C at the designated time using an SEPA-200 polarimeter (HORIBA Ltd. Kyoto, Japan).
Endo-glycosylceramidase reaction. Lacto-syl ceramide (50 nmol) was dissolved in 50 μL of 50 mM ammonium acetate solution (pH 6.0) containing 0.3% sodium cholate and BSA (10 μg), and incubated with 2mU of the enzyme (endo-glycosylceramidase) for 15 and 60 min at 37 °C. The sample solutions were passed through Sep-Pak C18 cartridge columns immediately after predetermined reaction time periods, and the fractions eluted with water (4 mL) were collected. Each fraction was immediately lyophilized, dissolved in DMSO (1 mL), and analyzed by ERMS.
General methods for synthesis. Thin-layer chromatography (TLC) was performed on Kieselgel 60 F254 (Merck) plates and the spots were detected by charring with 1% Ce(SO4)2-1.5% (NH4)6MoO24. 4H2O-10% H2SO4. Column chromatography was carried out using silica gel (Wakogel C-300, Wako Pure Chemical Industries Ltd.). Sep-Pak C18 was obtained from Waters Corp. UDP-Gal · 2Na and pNP-β-Gal were purchased from Sigma-Aldrich Corp. Alkaline phosphatase was purchased from Nacalai Tesque Inc. β1,3-Gal-aase was kindly gifted by Prof. Katsumi Ajisaka (Niigata University of Pharmacy and Applied Life Sciences). 1H NMR (500 MHz) spectra were recorded with an Avance 500 spectrometer (Bruker Biospin Inc.) with the solvent peak (residual CHD2OD; 3.31 ppm) as the reference.
4-(N-Boc-amino)butyl 2-acetamido-2-deoxy-α-d-glucopyranoside (7α) and 4-(N-Boc-amino)butyl 2-acetamido-2-deoxy-β-d-glucopyranoside (7β). A mixture of phenyl 2-azido-3,4, 6-tri-O-benzyl-2-deoxy-1-thio-β-d-glucopyranoside 4 (120 mg, 0.12 mmol), 4-(N-Boc-amino)butanol 5 (81 mg, 0.43 mmol), and AW-300 (ca. 0.5 g) in DCE (2.0 mL) was stirred for 1 h at 25 °C under a nitrogen atmosphere. To this mixture were added NIS (72 mg, 0.32 mmol) and TfOH (2.0 μL, 0.21 mmol) at 0 °C, and the resulting mixture was stirred for 1 h. The reaction was terminated by adding sat. NaHCO3. The reaction mixture was then diluted with DCM and filtered through a Celite pad. The filtrate was poured into a sat. NaHCO3 solution containing Na2S2O4, extracted with DCM, washed with H2O, dried over MgSO4, and concentrated in vacuo. The residue was purified by silica-gel column chromatography (n-hexane:EtOAc = 5:1–2:1) to afford pure 4-(N-Boc-amino) butyl 2-azido-3,4,6-tri-O-benzyl-2-deoxy-d-glucopyranoside (6) (80 mg, 58%, α/β = 4/6). To an EtOAc (1 mL) solution of 6 (80 mg, 0.12 mmol, α/β = 4/6) were added Pd(OH)2/C (20%, ca. 10 mg), Ac2O (1.0 mL), and MeOH (1.0 mL), and the mixture was stirred for 47 h under a hydrogen atmosphere and filtered. The filtrate was concentrated in vacuo to afford 4-(N-Boc-amino) butyl GlcNAc derivatives 7α and 7β (23 mg, 47%, α/β = 1.5). These anomeric isomers were separated by silica-gel column chromatography (DCM:MeOH = 19:1–8.5:1).
7α. 1H NMR (CD3OD): δ 4.78 (d, 1H, J1,2 3.5 Hz, H-1), 3.88 (dd, 1H, J2,3 10.7 Hz, H-2), 3.82 (dd, 1H, J5,6a 2.2 Hz, J6a,6b 11.9 Hz, H-6a), 3.76–3.71 (m, 1H, OCH2(CH2)2CH2N), 3.68 (dd, 1H, J5,6b 6.0 Hz, H-6b), 3.67 (t, 1H, J3,4 10.6 Hz, H-3), 3.58 (ddd, 1H, J4,5 9.8 Hz, H-5), 3.42–3.37 (m, 1H, OCH2(CH2)2CH2N), 3.34 (t, 1H, H-4), 3.07 (t, 2H, J 6.6 Hz, OCH2(CH2)2CH2N), 1.99 (s, 3H, NHAc), 1.66–1.53 (m, 4H, OCH2(CH2)2CH2N), 1.43 (s, 9H, tBu).
7β. 1H NMR (CD3OD): δ 4.38 (d, 1H, J1,2 8.4 Hz, H-1), 3.92–3.87 (m, 1H, OCH2(CH2)2CH2N), 3.88 (dd, 1H, J5,6a 2.0 Hz, J6a,6b 12.0 Hz, H-6a), 3.68 (dd, 1H, J5,6b 5.8 Hz, H-6b), 3.64 (dd, 1H, J2,3 9.2 Hz, H-2), 3.50–3.45 (m, 1H, OCH2(CH2)2CH2N), 3.44 (dd, 1H, J3,4 8.7 Hz, H-3), 3.31 (dd, 1H, J4,5, 9.7 Hz, H-4), 3.26 (ddd, 1H, H-5), 3.04 (t, 2H, J 6.4 Hz, OCH2(CH2)2CH2N), 1.97 (s, 3H, NHAc), 1.58–1.48 (m, 4H, OCH2(CH2)2CH2N), 1.43 (s, 9H, t Bu).
4-(N-Boc-amino)butyl 2-acetamido-2-deoxy-3-O-β-d-galactopyranosyl-α-d-glucopyra-noside (3α). A mixture of 7α (6.5 mg, 17 μmol), pNP-β-Gal (5.0 mg, 17 μmol), phosphate buffer (0.16 mL, 0.10 M, pH 6.0, containing 0.15 M NaCl), DMF (40 μL) and β1,3-Gal-ase (20 μL, 13 U/mL) was incubated for 3 h at 37 °C. The solvent was evaporated, and the residue was loaded on Sep-Pak C18 and then eluted with H2O. The products containing the unreacted 7α and 3α were eluted with MeOH. The mixture was purified by silica-gel column chromatography (DCM:MeOH = 9:1–7:3) to afford compound 7α (2.8 mg, 30%) and 3α (3.6 mg, 55%).
3α. 1H NMR (CD3OD): δ 4.78 (d, 1H, J1,2 3.3 Hz, H-1), 4.37 (d, 1H, J1’,2’ 7.6 Hz, H-1’), 4.06 (dd, 1H, J2,3 10.6 Hz, H-2), 3.85–3.67 (m, 7H, H-3,4’,6a,6’a,6b,6’b, OCH2(CH2)2CH2N), 3.62 (ddd, 1H, J4,5 9.8 Hz, J5,6a 1.9 Hz, J5,6b 5.4 Hz, H-5), 3.56 (dd, 1H, J5’,6’a 4.5 Hz, J5’,6’b 7.5 Hz, 7.5 Hz, H-5’), 3.53 (dd, 1H, J2’,3’ 9.5 Hz, H-2’), 3.48–3.41 (m, 3H, H-3’,4, OCH2(CH2)2CH2N), 3.07 (t, 2H, J 6.5 Hz, OCH2(CH2)2CH2N), 1.98 (s, 3H, NHAc), 1.68–1.53 (m, 4H, OCH2(CH2)2CH2N), 1.44 (s, 9H, tBu).
4-(N-Boc-Amino)butyl 2-acetamido-2-deoxy-3-O-β-d-galactopyranosyl-β-d-glucopyra-noside (3β). A mixture of 7β (5.0 mg, 13 μmol), pNP-β-Gal (3.8 mg, 13 μmol), phosphate buffer (0.16 mL, 0.10 M, pH 6.0, containing 0.15 M NaCl), DMF (40 μL) and β1,3-Gal-ase (20 μL, 13U/mL) was incubated for 3 h at 37 °C. The solvent was evaporated, and the residue was loaded on Sep-Pak C18 and then eluted with H2O. The products containing the unreacted 4-(N-Boc-amino)butyl glyco-side and 3β were eluted using MeOH. The mixture was purified by silica-gel column chromatography (EtOAc:MeOH = 9:1–2:1, then EtOAc:MeOH:H2O = 12:3:1) to afford 7β (0.8 mg, 11%) and 3β (3.5 mg, 70%).
3β. 1H NMR (CD3OD): δ 4.46 (d, 1H, J1,2 8.3, Hz, H-1), 4.27 (d, 1H, J1’,2’ 7.6 Hz, H-1’), 3.93–3.88 (m, 1H, OCH2(CH2)2CH2N), 3.89 (dd, 1H, J5,6a 1.9 Hz, J6a,6b 11.7 Hz, H-6’a), 3.80 (d, 1H, J3’,4’ 3.0 Hz, H-4’), 3.76 (dd, 1H, J5,6a 7.7 Hz, J6a’6b 11.5 Hz, H-6a), 3.77–3.65 (m, 4H, H-2,3,6b,6’b), 3.57–3.44 (m, 4H, H-2’,3’,5’, OCH2(CH2)2CH2N), 3.29–3.35 (m, 1H, H-5), 3.04 (t, 2H, J 6.9 Hz, OCH2(CH2)2CH2N), 1.97 (s, 3H, NHAc), 1.59–1.48 (m, 4H, OCH2(CH2)2CH2N), 1.43 (s, 9H, tBu).
Results and discussion
Gas-Phase behavior of sodiated hemiacetals. In anomerization in an aqueous solution, interconversion of the α- and β-forms of sugar molecules occurs via a linear aldehyde form. The interconversion is observed as mutarotation using a polarimeter. In the current investigation on the behavior of hemiacetals in the gas phase, we focused on the sodiated species (Scheme 1).
Scheme 1.

Anomerization of sodiated hemiacetal species has not been fully understood.
For the successful analysis of hemiacetal species, the individual anomers must be easily distinguished from each other under the given experimental conditions. Fig. 1b demonstrates the hypothesis that if the structures of the precursors at the first and second stages of MS/MS are the same, they should yield the same MSn spectra. The purpose is to carry out experiments to study the anomerization. When the first precursor is an α-anomer and anomerization takes place, the second precursor is a mixture of α-and β-anomers. The spectrum of this mixture will be different from that of the pure α-anomer. In order to confirm the validity of our experiment, it is necessary to confirm that the α- and β-anomers yield different spectra. In this experiment, the first precursor is subjected to a fragmentation reaction to yield a series of product ions. From these product ions, the ion that has the same m/z value as its precursor, presumably the unfragmented precursor, is isolated (this becomes the second precursor) and once again subjected to CID under the same conditions. If the structures of these precursors are identical, their fragmentation profiles will also be identical.
We will now discuss distinguishing individual α-and β-hemiacetals (criterion 1). Lactose was used in the following experiments because we intended to examine the behavior of hemiacetal structures while other linkages including C–O and C–C bonds were dissociated. This ensured that sufficient energy for anomerization was applied. Our previous investigations revealed that sodiated 4-aminobutyl α- and β-lactoside (2α and 2β) yielded sodiated lactose, respectively, which was believed to retain the original configuration of the parents, under CID conditions. The ERMS spectrum of the sodiated lactoses were compared with ERMS spectrum obtained from the sodiated lactose derived from GM3 ganglioside; this comparison revealed that the hemiacetal ion species is useful in structure elucidation.18) Despite the apparent usefulness of the hemiacetal species in a spectral matching, it was necessary to confirm that the sodiated hemiacetals did not anomerize under CID conditions. In this way, the method can be generally applied to structural investigation. In order to investigate the behavior of a pair of hemiacetals, the α-and β-anomers of Boc-protected 4-aminobutyl glycosides19),21) were used for the gas-phase synthesis of both anomers of hemiacetals (Scheme 2), which were then analyzed by ERMS. It was confirmed that the spectra of the ions produced from individual α- and β-glycosides were different (Fig. 2a, 2c). Recently, it was reported that a pair of ions associated with the C-ion of monosaccharides obtained from α- and βlinked glucosyl glucoses produced indistinguishable MS/MS spectra in the negative mode.24) This difference might be due to the difference in the form of C–1 of glucose that the negatively charged species might preferentially exist as an aldehyde and the sodium adduct might preferentially exist as a hemiacetal.
Scheme 2.
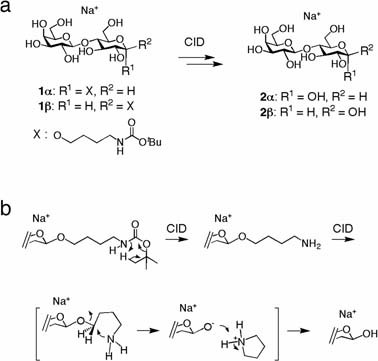
a: Stereospecific synthesis of sodiated hemiacetal species, α- (3α) and β-lactose (3β), under CID conditions. b: Reaction mechanism in the generation of hemiacetal species from Boc-protected aminobutyl glycoside.
Fig. 2.
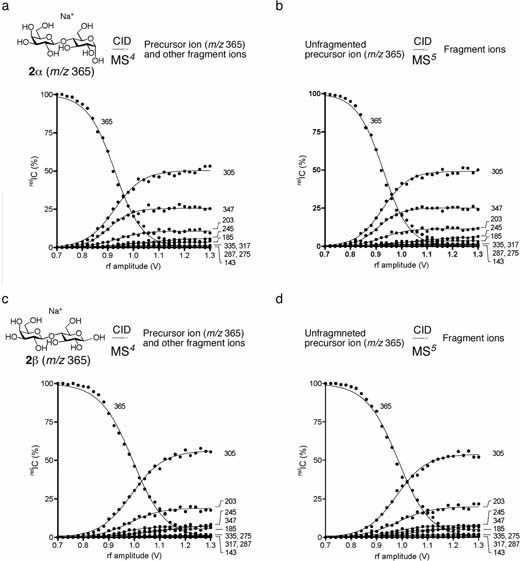
a. ERMS spectrum of 2α (m/z 365) at the MS4 stage. b. ERMS spectrum of the unfragmented precursor (m/z 365) isolated during CID of 2α at the MS5 stage. The d value and r2 between spectra 2a and 2b were 0.867 and 0.997, respectively. For d value, see experimental section. c. ERMS spectrum of 2β (m/z 365) at the MS4 stage. d. ERMS spectrum of the unfragmented precursor (m/z 365) isolated during CID of 2βat the MS5 stage. The d value and r2 between spectra 2c and 2d were 0.966 and 0.997, respectively. For d value, see experimental section.
Using these individual ions of lactose (believed to be 2α and 2β, respectively), we examined whether an anomerization proceeds in the gas phase under CID conditions (criterion 2). For this purpose, we carried out ERMS on both ions at the MS5 stage where the experiments were carried out at CID energies at which approximately 25% of the first precursors were fragmented [0.86 V (α) and 0.92 V (β)] (Fig. 2a vs. 2b and 2c vs. 2d). For both the α- and β-anomers, the spectra obtained at the MS4 and MS5 stages showed very good correlation with small “d values” in SDC (See Materials and methods),22) suggesting that the unfragmented precursor ion in the MS4 stage remained same structure during CID process. If there is an equilibrium between the two anomers, the spectra obtained for α- and β-anomers at the MS5 stage are expected to be different from those obtained at the MS4 stage. These spectra change to some degree from one stage to the next and converge to yield a spectrum corresponding to the equilibrium mixture. (Fig. 1b) This hypothesis is eligible based on an evidence that a known anomeric mixture of lactose could be determined as “a mixture” by similar CID experiment at MS2 and MS3.22) In the current experiments, however, the spectra obtained at the MS4 and MS5 stages were indistinguishable for both α- and β-lactoses, which suggested that equilibrium between anomers (at least in sodiated form) was either not attained in the gas phase or was too slow to be detected. It should be noted that various fragment ions were generated under the experimental conditions, as shown in Fig. 3, indicating that the energy supplied was sufficient for isomerization of the precursor. Although reactions occurring in gas-phase chemistry are generally considered to be nonequilibrium reactions, anomerization, if it occurs, is considered to be an equilibrium process because it involves an intramolecular ring opening and ring closing.
Fig. 3.
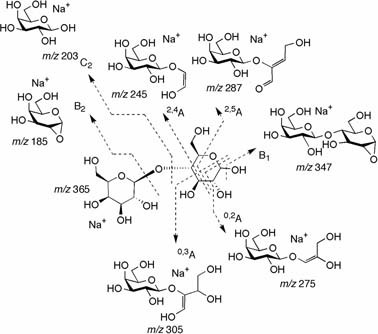
The fragmentation paths and possible structures of the generated ion species. It is obvious that several C–O and C–C bonds were cleaved under the given CID conditions. Assignments B1, B2, 2,5A, etc., are given, as suggested by Domon, B. and Costello, C. E. (1988) Glycoconj. J. 5, 397–409.
Generality of the observation that sodiated hemiacetal molecules do not anomerize under CID conditions. An important basis for our experiments is the fact that the sodiated hemiacetals do not anomerize under gas-phase CID conditions. In order to confirm the generality of this phenomenon, we conducted experiments similar to those described above, using a pair of synthesized Boc-protected aminobutyl glycosides, such as β-Gal-(1 → 3)-α-GlcNAc-O(CH2)4NHBoc (3α) and β-Gal-(1 → 3)-β-GlcNAc-O(CH2)4NHBoc (3β) (See Materials and methods). These compounds yielded sodiated hemiacetal ion species at the MS3 stage, as did the lacto-sides. These species were then analyzed by ERMS at the MS4 and MS5 stages. As shown in Fig. 4, the ERMS of [β-Gal-(1 → 3)-α-GlcNAc-OH+Na]+ and [β-Gal-(1 → 3)-β-GlcNAc-OH+Na]+ obtained at the MS4 stage (Fig. 4a and 4c, respectively) were different, as expected. On the other hand, the ERMS of these ions obtained at the MS4 stage (Fig. 4a, 4c) were indistinguishable from those obtained at the MS5 stage (Fig. 4b, 4d). These results reinforced the fact that individual hemiacetals (sodium adducts) are distinguishable and that they do not anomerize under the CID conditions.
Fig. 4.
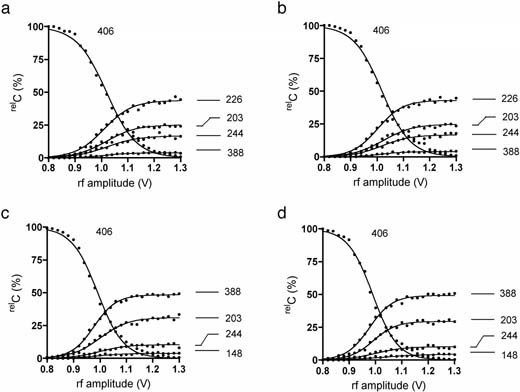
a. ERMS spectrum of [β-Gal-(1 → 3)-α-GlcNAc-OH+Na]+ at the MS4 stage. b. ERMS spectrum of unfragmented precursor of [β-Gal-(1 → 3)-α-GlcNAc-OH+Na]+ at the MS5 stage. c. ERMS spectrum of [β-Gal-(1 → 3)-β-GlcNAc-OH+Na]+ at the MS4 stage. d. ERMS spectrum of unfragmented precursor of [β-Gal-(1 → 3)-β-GlcNAc-OH+Na]+ at the MS5 stage.
Observation of mutarotation by MS. We demonstrated that it is possible to study the isomerism of anomers of the sodium adducts of lactose and that it is possible to distinguish between the anomers of α- and β-hemiacetals. On the basis of these results, we examined the mutarotation of lactose in aqueous solution (Fig. 5a). Solutions of α-enriched (8, α:β = ∼98:2) and β-enriched (9, α:β = ∼30:70) lactoses were independently incubated at 25 °C, and aliquots of each solution were analyzed by ERMS. The plots of the estimated plateau values (maximum response values) of the observed fragment ions against time showed that equilibrium was attained in approximately 4 h (Fig. 5b) as was confirmed using a polarimeter (Fig. 5c). This indicated that MS can be used for the measurement of mutarotation. The results of MS analysis showed that the expected normalized intensities of the signals corresponding to three common fragments at equilibrium are 16% (m/z 203), 56% (m/z 305) and 28% (m/z 347). The anomeric ratio (α/β) estimated by NMR was 42:5823) (Fig. 5d). Thus, the usefulness of MS for measuring mutarotation was demonstrated for the first time.
Fig. 5.
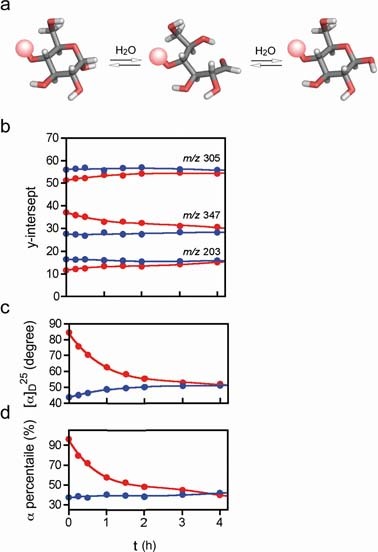
a: Schematic representation of the anomerization of lactose; galactose residue is shown as a red sphere. Gray: carbon; white: hydrogen; red: oxygen. b: Observation of equilibrium between α-enriched (8, red) and β-enriched lactose (9, blue). Relative intensities (calculated using the plateau values estimated for each product ion in the ERMS plot) of common fragments (m/z 203, 305 and 346) observed for both reactions. c: Data obtained using a polarimeter. Colors used are same as in Fig. 5b. d: Data obtained by 1H NMR. The α/β ratios calculated for anomeric protons were used. Colors used are same as in Fig. 5b.
Investigation of endo-glycosylceramidase catalyzed hydrolysis mechanism. Finally, an attempt to reveal the enzymatic reaction mechanism was carried out to expand the scope of the method allowing distinguishing α- and β-anomers. The investigation of the hydrolysis mechanism of glycosidase is important because glycosidase may lead to the synthesis of medically important compounds as a result of transglycosidation reactions. Endo-glycosylceramidase is one of the enzymes that hydrolyzes glycosphingolipids into glycans and ceramides with retention of stereochemistry at the anomeric center.25)–27) The reaction mechanisms of glycosidases are usually investigated by NMR and X-ray crystallography,28),29) both of which are considered to be indirect methods because the former requires deuterium oxide as the solvent (also works as a nucleophile) instead of water and the latter mutant proteins and crystallization.
We attempted to analyze the reaction mechanism of endo-glycosylceramidase II from Rhodococcus sp. by using our method. To carry out this analysis, lactosyl ceramide was treated with the enzyme for 15 and 60 min (Fig. 6a). Aliquots of reaction mixture were taken and the released lactose was recovered, analyzed by ERMS, and compared with equilibrated data obtained for lactose (Fig. 6b). Note that since the initial product is expected to anomerize in the reaction mixture, we anticipated subtle differences in the plateau values of the common ions (ions with m/z 203, 305 and 347) observed in the spectra of α- and β-lactoses. As anticipated, the mixtures obtained after 15 min (blue open circles) and 60 min (blue closed circles) gave different plateau values. The values obtained for individual ions at early stages of MS/MS were found to be far from those for the lactose after 60 min (red circles), which were similar to those for equilibrated lactose (mean indicated by ×, Fig. 5b). This indicates that the initially formed lactose had a β-configuration and underwent anomerization. The β-retaining mechanism of this enzyme further suggests a presence of carboxyl group at α-face of the glucose moiety at the catalytic site to stabilize the generated oxocarbenium ion intermediate that also blocks the access of water molecule from the side. Further, a water molecule attacks the E–S complex to form β-lactose after departure of the ceramide from the binding pocket. The enzymatic reaction conditions were determined to be ca. 60% of the substrate was consumed in (ca. 9%) 15 min, so that the reaction velocities of enzyme reaction (t1/2 < 15 min) was greater than anomerization (t1/2 ≈ 50 min). Thus, this MS-based method was successfully used to confirm the β-retaining mechanism of endo-glycosylceramidase II, which illustrates that it can be used to investigate the glycosidase mechanism. Furthermore, the newly introduced method is the only method that allows direct analysis of the enzyme reaction takes place under normal conditions.
Fig. 6.
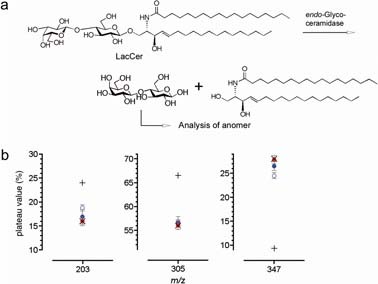
a: endo-Glycosylceramidase hydrolyzes glycosphingolipids to produce a glycan and ceramide. Lactosyl ceramide (LacCer) is used as a substrate in this experiment. b: Results of the analysis of the anomers of lactose produced by the endo-glycosylceramidase. The estimated plateau values obtained from the ERMS spectra for ions with m/z 203, 305 and 347 are presented. The reaction was terminated after 15 min (blue open circle) and 60 min (blue closed circle). Red closed circle: equilibrated lactose (in the reaction medium); “+”: estimated value for pure β-anomer (The data presented in Fig. 2c were recalculated using the common ions.); “×”: equilibrated lactose (in the water); Error bar: 95% confidence interval.
Conclusion. Mutarotation was first observed in the 19th century30) and is still valuable in estimating the rotary power of a given optically active compound and kinetic constants at equilibrium, such as those in the anomerization of hemiacetals. The method, however, requires large quantities of samples at millimolar concentrations. NMR is a powerful method and can also be used to investigate the mutarotation.31) Recently, a new technique for the determination of anomeric configuration has been reported, which is based on vibrational circular dichroism (VCD).32) A method based on MS described in this report requires picomolar amounts of samples, and thus, meets the current requirements of micro-analysis. The method also allowed us to investigate the mechanism of one of the glycosidase reactions. The advantage of this method is clearly its low sample consumption. These achievements became possible after a detailed analysis of the gas-phase behavior of the hemiacetals. Individual anomers of lactose were obtained independently from their respective precursors (α- and β-aminobutyl glycosides), and their ERMS spectra were obtained under CID conditions. Comparison of the spectra thus obtained for sodiated α- and β-hemiacetals at the MS4 and MS5 stages showed that 1) α- and β-lactoses were stereo-specifically synthesized from their corresponding precursors under CID conditions and 2) the sodiated hemiacetals may not anomerize in the gas phase under CID conditions.
Furthermore, it should be emphasized that the sodiated ion species corresponding to the hemiacetals (C-ions) are useful in the structure elucidation of glycans because the ion species are often observed in the MS/MS spectra of glycans. There a discovery of irreversible nature of individual sodiated hemiacetals may become a basis of a reliable structural analysis because one cannot use the MS/MS spectra of C-ions for comparison when they anomerize.
Acknowledgments
We acknowledge financial support from the Mitsubishi Chemical Co. and the Key Technology Research Promotion Program of the New Energy and Industrial Development Organization (NEDO), a part of the Ministry of Economy, Trade and Industry of Japan.
References
- 1).Yamamoto, E. (2004) ABO blood group system-ABH oligosaccharide antigens, anti-A and anti-B, A and B glycosyltransferases, and ABO genes. Immunohematol. 20, 3–22 [PubMed] [Google Scholar]
- 2).Hakomori, S.-I. (1984) Tumor-associated carbohydrate antigens. Ann. Rev. Immunol. 2, 103–126 [DOI] [PubMed] [Google Scholar]
- 3).Ilver, D., Arnqvist, A., Ögren, J., Frick, I.-M., Kersulyte, D., Incecik, E. T.et al. (1996) Helicobacter pylori adhesin binding fucosylated histoblood group antigens revealed by retagging. Science 279, 373–377 [DOI] [PubMed] [Google Scholar]
- 4).Dell, A. (1987) Mass spectrometry of carbohydrates. Adv. Carbohydr. Chem. Biochem. 45, 19–72 [DOI] [PubMed] [Google Scholar]
- 5).Harvey, D. J. (1999) Matrix-assisted laser desorption/ionization mass spectrometry of carbohydrates. Mass Spectrom. Rev. 18, 349–450 [DOI] [PubMed] [Google Scholar]
- 6).Hayes, R. N. and Gross, M. L. (1990) Collision-Induced Dissociation, InMethods Enzymol. (ed. McCloskey, J. A.), Vol. 193, pp. 237–263 [DOI] [PubMed] [Google Scholar]
- 7).Mühlecker, W., Gulati, S., McQuillen, D. P., Ram, S., Rice, P. A. and Reinhold, V. N. (1999) An essential saccharide binding domain for the mAb 2C7 established for Neisseria gonorrhoeae LOS by ES-MS and MSn. Glycobiology 9, 157–171 [DOI] [PubMed] [Google Scholar]
- 8).Ashline, D., Singh, S., Hanneman, A., Reinhold, V. N. (2005) Congruent strategies for carbohydrate sequencing. 1. Anal. Chem. 77, 6250–6262 [DOI] [PMC free article] [PubMed] [Google Scholar]
- 9).Zhang, H., Singh, S., Reinhold, V. (2005) Congruent strategies for carbohydrate sequencing. 2. FragLib: an MSn spectral library. Anal. Chem. 77, 6263–6270 [DOI] [PMC free article] [PubMed] [Google Scholar]
- 10).Lapadula, A. J., Hatcher, P. J., Hanneman, A. J., Ashline, D. J., Zhang, H. and Reinhold, V. N. (2005) Congruent strategies for carbohydrate sequencing. 3. OSCAR: an algorithm for assigning oligosaccharide topology from MSn data. Anal. Chem. 77, 6271–6279 [DOI] [PMC free article] [PubMed] [Google Scholar]
- 11).Fetterolf, D. D. and Yost, R. A. (1982) Energy-resolved collision-induced dissociation in tandem mass spectrometry. Int. J. Mass Spectrom. Ion Phys. 44, 37–50 [Google Scholar]
- 12).Louris, J. N., Cooks, R. G., Syka, J. E. P., Kelley, P. E., Stafford, G. C. Jr. and Todd, J. F. J. (1987) Instrumentation, applications, and energy deposition in quadrupole ion-trap tandem mass spectrometry. Anal. Chem. 59, 1677–1685 [Google Scholar]
- 13).Laine, R. A., Pamidimukkala, K. M., French, A. D., Hall, R. W., Abbas, S. A., Jain, R. K.et al. (1988) Linkage position in oligosaccharides by fast atom bombardment ionization, collision-activated dissociation, tandem mass spectrometry and molecular modeling. l-Fucosylp (β1-X)-N-acetyl-d-glucosaminylp-(β1–3)-d-galactosylp-(β1-O-methyl) where X = 3,4, or 6″. J. Am. Chem. Soc. 110, 6931–6939 [Google Scholar]
- 14).Xue, J., Song, L., Khaja, S. D., Locke, R. D., West, C. M., Laine, R. A.et al. (2004) Determination of linkage position and anomeric configuration in Hex-Fuc disaccharides using electrospray ionization tandem mass spectrometry. Rapid Commun. Mass Spectrom. 18, 1947–1955 [DOI] [PubMed] [Google Scholar]
- 15).Kurimoto, A., Daikoku, S., Mutsuga, S. and Kanie, O. (2006) Analysis of energy-resolved mass spectra at MSn in a pursuit to characterize structural isomers of oligosaccharides. Anal. Chem. 78, 3461–3466 [DOI] [PubMed] [Google Scholar]
- 16).Daikoku, S., Ako, T., Kurimoto, A. and Kanie, O. (2007) Anomeric information obtained from a series of synthetic trisaccharides using energy resolved mass spectra. J. Mass Spectrom. 42, 714–723 [DOI] [PubMed] [Google Scholar]
- 17).Kurimoto, A. and Kanie, O. (2007) Distinguishing isomeric pyridylaminated high-mannose (Man7) oligosaccharides based on energy-resolved mass spectra. Rapid Commun. Mass Spectrom. 21, 2770–2778 [DOI] [PubMed] [Google Scholar]
- 18).Suzuki, K., Daikoku, S., Ako, T., Shioiri, Y., Kurimoto, A., Ohtake, A.et al. (2007) High-yielding and controlled dissociation of glycosides producing B- and C-ion species under collision-induced dissociation MS/MS conditions and use in structural determination. Anal. Chem. 79, 9022–9029 [DOI] [PubMed] [Google Scholar]
- 19).Zaia, J., Miller, M. J. C., Seymour, J. L. and Costello, C. E. (2007) The role of mobile protons in negative ion CID of oligosaccharides. J. Am. Soc. Mass Spectrom. 18, 952–960 [DOI] [PMC free article] [PubMed] [Google Scholar]
- 20).Daikoku, S., Ako, T., Kato, R., Ohtsuka, I., Kanie, O. (2007) Discrimination of 16 structural isomers of fucosyl galactoside based on energy-resolved mass spectrometry. J. Am. Soc. Mass Spectrom. 18, 1873–1879 [DOI] [PubMed] [Google Scholar]
- 21).Shioiri, Y., Kurimoto, A., Daikoku, D., Ishida, H., Kiso, M., Suzuki, K.et al. (2008) Energy-resolved structural details obtained from gangliosides. Anal. Chem. 81, 139–145 [DOI] [PubMed] [Google Scholar]
- 22).Daikoku, S., Kurimoto, A., Mutuga, S., Ako, T., Kanemitsu, T., Shioiri, Y.et al. (2009) Ion-trap mass spectrometry unveils the presence of isomeric oligosaccharides in an analyte: stage-discriminated correlation of energy-resolved mass spectrometry. Carbohydr. Res. 344, 384–394 [DOI] [PubMed] [Google Scholar]
- 23).Casu, B., Reggiani, M., Gallo, G. G. and Vigevani, A. (1964) Hydroxyl proton resonances of sugars in dimethylsulphoxide solution. Tetrahedron Lett. 39, 2839–2843 [DOI] [PubMed] [Google Scholar]
- 24).Fang, T. T. and Bendiak, B. (2007) The stereochemical dependence of unimolecular dissociation of monosaccharide-glycolaldehyde anions in the gas phase: a basis for assignment of the stereochemistry and anomeric configuration of monosaccharides in oligosaccharides by mass spectrometry via a key discriminatory product ion of disaccharide fragmentation, m/z 221. J. Am. Chem. Soc. 129, 9721–9736 [DOI] [PubMed] [Google Scholar]
- 25).Ito, M. and Yamagata, T. (1986) A novel glycosphingolipid-degrading enzyme cleaves the linkage between the oligosaccharide and ceramide of neutral and acidic glycosphingolipids. J. Biol. Chem. 261, 14278–14282 [PubMed] [Google Scholar]
- 26).Li, S.-C., DeGasperi, R., Muldrey, J. E. and Li, Y.-T. (1986) A unique glycosphingolipid-splitting enzyme (ceramide-glycanase from leech) cleaves the linkage between the oligosaccharide and the ceramide. Biochem. Biophys. Res. Commun. 141, 346–352 [DOI] [PubMed] [Google Scholar]
- 27).Zechel, D. L. and Withers, S. G. (2000) Glycosidase mechanisms: Anatomy of a finely tuned catalyst. Acc. Chem. Res. 33, 11–18 [DOI] [PubMed] [Google Scholar]
- 28).Bock, K. and Sigurkjold, B. W. (1989) Mechanism and binding specificity of β-glucosidase-catalyzed hydrolysis of cellobiose analogues studied by competition enzyme kinetics monitored by 1H-NMR spectroscopy. Eur. J. Biochem. 178, 711–720 [DOI] [PubMed] [Google Scholar]
- 29).Caines, M. E. C., Vaughan, M. D., Tarling, C. A., Hancock, S. M., Warren, R. A. J., Withers, S. G., et al. (2007) Structural and mechanistic analyses of endoglycoceramidase II, a membrane-associated family 5 glycosidase in the apo and GM3 ganglioside-bound forms. J. Biol. Chem. 282, 14300–14308 [DOI] [PubMed] [Google Scholar]
- 30).Dubrunfaut, M. (1846) Note sur quelques phénoménes rotatoires et sur quelques propriétés des sucres. Compt. Rend. Acad. Sci. Fr. 23, 38–44 [Google Scholar]
- 31).Lenz, R. W. and Heeschen, J. P. (1961) The application of NMR to structural studies of carbohydrates in aqueous solutions. J. Polymer Sci. 51, 247–261 [Google Scholar]
- 32).Monde, K., Taniguchi, T., Miura, N. and Nishimura, S.-I. (2004) A specific band observed in VCD predicts anomeric configuration of carbohydrates. J. Am. Chem. Soc. 126, 9496–9497 [DOI] [PubMed] [Google Scholar]


