

Abstract
Vasopressin modulates sodium reabsorption in the collecting duct through adenylyl cyclase-stimulated cyclic AMP, which exists as multiple isoforms; the specific isoform involved in vasopressin-stimulated sodium transport is unknown. To assess this, we studied mice deficient in adenylyl cyclase type VI specifically in the principal cells of the collecting duct. Knockout mice had increased urine volume and reduced urine sodium concentration, but regardless of the level of sodium intake, they did not exhibit significant alterations in urinary sodium excretion, arterial pressure, or pulse rate. Plasma renin concentration was elevated in knockout mice, however, suggesting a compensatory response. Valsartan significantly reduced arterial pressure in knockout mice but not in controls. Knockout mice had decreased renal cortical mRNA content of all three epithelial sodium channel (ENaC) isoforms, and total cell sodium channel isoforms α and γ were reduced in these animals. Patch-clamp analysis of split-open cortical collecting ducts revealed no difference in baseline activity of sodium channels, but knockout mice had abolished vasopressin-stimulated ENaC open probability and apical membrane channel number. In summary, these data suggest that adenylyl cyclase VI mediates vasopressin-stimulated ENaC activity in the kidney.
Arginine vasopressin (AVP) modulation of water flux across the renal collecting duct (CD) is well known; however, it is becoming increasingly apparent that AVP stimulation of epithelial Na channel (ENaC)–mediated Na transport is of substantial importance in Na and water homeostasis. Recent studies indicate that AVP-induced Na reabsorption is important in the hormone’s stimulation of water reabsorption (reviewed in Stockand1). Exogenous AVP enhances renal expression of all ENaC subunits in Brattleboro rats,2 increases ENaC open probability (Po) in MDCK cells,3 and stimulates Na flux in isolated perfused CD.4 A 2- to 3-minute exposure to AVP was shown to increase ENaC Po in the split-open isolated mouse cortical CD (CCD); in addition, 30-minute exposure to AVP increased the ENaC apical membrane channel number (N).5 Recent studies by our group showed that adrenalectomy surprisingly did not reduce renal ENaC abundance, whereas adrenalectomy and AVP V2 receptor antagonism markedly decreased renal ENaC levels.6 The stimulatory effects of AVP on ENaC are mediated by cAMP. In the split-open mouse CCD, the AVP effect was dependent upon adenylyl cyclase (AC) activity, whereas AVP-enhanced apical membrane Na conductance in perfused rat CCD was mediated by cAMP.4 cAMP increases ENaC Po and N in pulmonary epithelial cells, transfected oocytes, CCD cell lines, cultured CDs, and MDCK cells.7–12 The effect of cAMP on ENaC trafficking is due, at least in part, to inhibition of Nedd4–2-induced ENaC ubiquitination via phosphorylation of Nedd4–2 on Ser327, Ser221, and Thr246; notably, these are the same residues that are phosphorylated by serum and glucocorticoid-inducible kinase (SGK), although the cAMP effect is SGK independent.13 Chronic exposure (2 days) to cAMP increases ENaC mRNA and protein levels.14,15 Thus, AVP, via AC-stimulated cAMP production, can regulate CD Na reabsorption.
A key remaining question is which AC isoform(s) in the CD mediate(s) the effects of AVP on Na reabsorption. Nine membrane-associated AC isoforms have been identified,16 whereas the isoforms that are found in CD principal cells (where ENaC is located) are AC3, AC4, and AC6.17 In vitro studies have suggested that AC3 and/or AC6 mediate AVP-stimulated cAMP accumulation in the CD,17,18 although a role for AC4 has not be examined. Studies using mice that were globally deficient in AC6 noted modestly impaired urinary concentrating ability and decreased AVP-stimulated cAMP,19,20 whereas mice with CD-specific disruption of AC6 manifested a similar phenotype.21 Whole animal AC3 knockout (KO) caused a 50% decrease in GFR, largely obviating analysis of the renal actions of AVP.22 None of these AC isoform KO studies investigated AVP-regulated Na transport; hence, this study was undertaken to specifically address this question. Herein, we use a mouse model of CD principal cell-specific AC6 KO and report that this AC isoform is fundamentally important in AVP-stimulated ENaC activity.
Results
Characterization of CD AC6 KO Model
The CD AC6 KO mice were previously characterized and show no developmental, gross morphologic or renal histologic abnormalities up to at least 1 year of age.21 These characteristics were reconfirmed in this study (and were as previously reported) because transgene expression, particularly the degree of expression, can change with successive breedings. In addition, principal cell-specific deletion of AC6 was reconfirmed and was as previously reported.21 Animals that were homozygous for loxP-flanked AC6 but missing the AQP2-Cre transgene (so-called controls) manifested no apparent effect of the loxP sites inserted into the flanking introns as evidenced by normal development, gross morphology, renal histology, and systemic and renal AC6 expression.
Effect of CD AC6 KO on Urinary Na and K Excretion
Control and CD AC6 KO mice were given a low (0.01%), normal (0.3%), or high (3.15%) Na diet and urinary Na and water excretion were assessed on the second, third, and seventh day of each diet. Mice with CD AC6 KO had increased urine volume on a high Na diet (Figure 1 and Table 1), whereas urinary Na concentration was reduced on low, normal, and high Na diets (Table 1). These findings are consistent with a mild nephrogenic diabetes insipidus as previously reported in these animals.21 No differences in urinary Na or K excretion between CD AC6 KO and control mice were observed on any of the varied Na intakes (Figure 1 and Table 1) on any of the days tested; correcting for urinary creatinine did not uncover differences in Na excretion between groups (Table 1). However, small differences in urinary Na excretion would be quite difficult to detect; hence, additional studies were performed to evaluate the effect of CD AC6 deficiency on renal Na handling.
Figure 1.

Effect of CD AC6 KO on daily urinary Na excretion (UNaV). Control and CD AC6 KO mice are given low (0.01%), normal (0.3%), or high (3.15%) Na diets. Data are shown as UNaV on days 2 (A), 3 (B), and 7 (C) after starting each of the different diets (n=8–16 both groups). Not all days are from the same groups of rats, so data are not shown as a line graph comparing values between days.
Table 1.
Metabolic balance data on the third day of low, normal, or high Na diets in CD AC6 KO and control mice (n=12 for each data point)
| Low Na | Normal Na | High Na | ||||
|---|---|---|---|---|---|---|
| Control | KO | Control | KO | Control | KO | |
| Weight (g) | 23.5±0.8 | 23.4±1.0 | 23.8±0.9 | 23.6±0.8 | 24.1±0.8 | 24.3±1.3 |
| Water intake (ml/d) | 2.9±0.3 | 3.0±0.5 | 3.6±0.5 | 3.7±0.8 | 11.1±1.9 | 14.2±3.1 |
| Food intake (g/d) | 6.71±0.09 | 6.59±0.11 | 6.26±0.16 | 6.35±0.22 | 5.44±0.20 | 5.13±0.18 |
| Urine volume (UV) (ml/d) | 2.07±0.33 | 2.17±0.29 | 2.82±0.34 | 2.91±0.33 | 5.5±1.0 | 8.0±0.4a |
| Urine [Na] (mEq/L) | 23.3±1.9 | 15.5±2.0a | 74.8±4.1 | 60.2±2.8a | 429±47 | 313±32a |
| Urine [K] (mEq/L) | 220±24 | 189±13 | 141±20 | 137±18 | 91±10 | 63±7a |
| UKV (µEq/d) | 365±34 | 330±33 | 318±29 | 330±39 | 459±82 | 483±40 |
| UNaV (µEq/d) | 43±6 | 31±6 | 190±18 | 178±19 | 2293±287 | 2435±197 |
| Urine creatinine (mg/dl) | 50.8±1.9 | 48.3±1.6 | 48.0±1.2 | 47.8±2.0 | 22.1±2.9 | 17.9±2.2 |
| UNa/Ucreat (µEq/mg) | 43±4 | 33±4 | 154±12 | 133±6 | 2109±243 | 1811±130 |
UKV, urinary K excretion; UNaV, urinary Na excretion; UNa/Ucreat, urinary Na/creatinine ratio.
P<0.05 versus control.
Effect of CD AC6 KO on Arterial Pressure and Pulse Rate
Because systemic hemodynamics can be an indicator of alterations in renal Na metabolism, arterial pressure and pulse rate were assessed, using radiotelemetry, in CD AC6 KO and control mice on low, normal, or high Na diets for 7 days each. There were no differences in systolic arterial pressure (Figure 2A), diastolic arterial pressure (Figure 2B), or pulse rate (Figure 2C) between CD AC6 KO and control animals on any of the diets. Note that arterial pressure and pulse rate did not vary over the 7 days of each diet, so a composite value for all 7 days is shown in the figures.
Figure 2.

Effect of CD AC6 KO on arterial pressure and pulse. Control and CD AC6 KO mice are given low (0.01%), normal (0.3%), or high (3.15%) Na diets. Systolic BP (A), diastolic BP (B), and pulse rate (C) are determined by radiotelemetry on each diet (n=12 both groups). Hemodynamic values are determined daily for 7 days on each diet and do not vary within the 7-day period; the values shown are the composite of the 7 days on each diet.
Effect of CD AC6 KO on AVP, Renin, and Aldosterone
Having observed no apparent effect of CD AC6 KO on urinary Na excretion, arterial pressure, or pulse rate, the possibility existed that deficiency of CD AC6 altered Na reabsorption but that compensatory mechanisms obscured this effect. To evaluate for this, plasma renin concentration (PRC) and urinary aldosterone excretion were evaluated in CD AC6 KO and control mice on a low, normal, or high Na diet. The PRC was significantly elevated in CD AC6 KO mice compared with controls on a normal or high Na diet (Figure 3A). The PRC tended to be higher in CD AC6 KO mice compared with controls on a low Na diet, but high variability prevented achieving statistical significance. Note that PRC was determined, and not plasma renin activity, because the latter is highly variable and inaccurate in mice. Urinary aldosterone excretion tended to be higher in CD AC6 KO mice compared with controls on low, normal, or high Na diets, but was not statistically significant (Figure 3B). To evaluate whether the increased activity of the renin-angiotensin system might be a compensatory response, the effect of valsartan on arterial pressure in CD AC6 KO and control mice was determined. When valsartan was given at a relatively modest dose, arterial pressure did not change in control mice, but significantly decreased in CD AC6 KO animals (Figure 4), supporting the notion that the renin-angiotensin-aldosterone axis is important in maintaining arterial pressure in the knockout mice. Finally, urinary AVP levels were not different between control and CD AC6 KO mice regardless of the level of salt intake (Figure 5).
Figure 3.

Effect of CD AC6 KO on plasma renin concentration and urinary aldosterone excretion. Control and CD AC6 KO mice are given low (0.15%), normal (0.3%), or high (3.15%) Na diets. PRC (A) or urinary aldosterone excretion (B) is determined after 7 days on each diet (n=12 both groups). *P<0.05 versus control animals on the same diet.
Figure 4.

Effect of valsartan (5 mg/kg per day) on mean arterial pressure in CD AC6 KO and control mice. Arterial pressure is determined by radiotelemetry for 5 days on a normal Na diet, followed by subcutaneous insertion of an osmotic minipump containing valsartan. Two days are allowed for recovery, followed by arterial pressure determination for the next 5 days (n=5 each group). †P<0.05 versus control values on same day.
Figure 5.

Effect of CD AC6 KO on urinary AVP excretion. Control and CD AC6 KO mice are given low (0.15%), normal (0.3%), or high (3.15%) Na diets. Urine AVP excretion (24 h) is determined after 7 days on each diet (n=12 both groups).
Effect of CD AC6 KO on ENaC Expression
Given that elevations in PRC suggested that compensation for CD AC6 KO was occurring, the possibility existed that the major Na transport mechanism in the CD, namely ENaC, was affected by CD AC6 deficiency. To initially assess for this, ENaC isoform mRNA was determined. The mRNA steady-state levels of all three ENaC isoforms (α, β, and γ) were reduced by about 40%–50% in CD AC6 KO renal cortex from mice fed a normal Na diet (Figure 6). Total renal cortex protein (including all cellular components) from CD AC6 KO mice showed significant decreases in the 88 kD band for ENaC-α and the 85 kD band for ENaC-γ compared with controls fed a normal Na diet (Figure 7). The presumed proteolytic cleavage 30 kD product of ENaC-α did not show a significant decrease in CD AC6 KO mice, whereas the presumed proteolytic cleavage products of ENaC-γ (approximately 70–80 kD) were decreased in CD AC6 KO animals. Plasma membrane-enriched fractions derived from renal cortex did not show a significant difference in ENaC isoform protein abundance of any molecular size between CD AC6 KO and control animals, although the 88 kD ENaC-α tended to be reduced in the CD AC6 KO-derived plasma membrane-enriched fraction (Figure 7).
Figure 6.

Effect of CD AC6 KO on renal cortical ENaC isoform mRNA content. ENaC isoform mRNA is determined in control and CD AC6 KO mice eating a normal (0.3%) Na diet (n=6 both groups). ENaC isoform mRNA is determined by real-time PCR; data are expressed as CD AC6 KO as a percentage of control values. All PCR data are normalized to glyceraldehyde-3-phosphate dehydrogenase to control for total RNA analyzed. ‡P<0.05 versus control.
Figure 7.
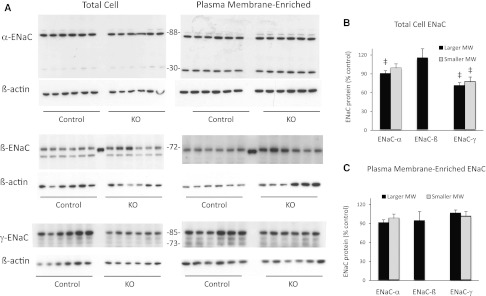
AC6 knockout in the CD reduces ENaC mRNA and protein expression. (A) Effect of CD AC6 KO on renal cortical ENaC isoform protein content. ENaC isoform protein content is determined in control and CD AC6 KO mice eating a normal (0.3%) Na diet (n=6 both groups). (B) ENaC protein expression is determined in total renal cortex and (C) in renal cortical plasma membrane-enriched fractions; data are expressed as CD AC KO as a percentage of control values and are normalized to β-actin to control for loading. Blots are analyzed by densitometry. The larger molecular mass bands for ENaC-α and ENaC-γ are 88 and 85 kD, respectively; the smaller molecular mass bands for ENaC-α and ENaC-γ are 30 and 70–80 kD, respectively. ‡P<0.05 versus control.
AC6 Is Necessary for AVP Stimulation of ENaC
The above findings suggested that CD AC6 did indeed affect CD ENaC; hence, studies were undertaken to directly assess this possibility. The role of CD principal cell AC6 in vasopressin (AVP)-stimulated apical membrane ENaC activity was assessed in split-open CCDs using patch-clamp electrophysiology. Representative current traces for ENaC in control and CD AC6 KO mice before and after treatment with AVP are shown in Figure 8, A–D. Summarized results for AVP effects on total activity (NPo), channel number (N), and single channel Po for ENaC in principal cells from control and CD AC6 KO mice are shown in Figure 8, E–G, and Table 2 (latter shown to describe number of channels studied). Consistent with our previous findings,5 exogenous AVP stimulates ENaC in principal cells from control mice, elevating activity (NPo) by increasing both N and Po. In contrast, exogenous AVP had no effect on the activity (neither N nor Po) of ENaC in CD AC6 KO mice. Notably, the basal activity of ENaC in the absence of AVP was not different between control and CD AC6 KO mice. Next, water deprivation studies were conducted to determine whether ENaC function is altered under high endogenous AVP states in CD AC6 KO mice. Water deprivation increased ENaC activity in control mice, but failed to do so in CD AC6 KO animals (Table 2). Taken together, these results demonstrate that normal expression and function of AC6 in principal cells is required for AVP stimulation of ENaC. In addition, in unstressed mice, AC6 contributes little to resting ENaC activity, whereas AC6 is important in signaling increased ENaC activity in water-deprived animals.
Figure 8.

AC6 is necessary for AVP stimulation of ENaC. Representative gap-free current traces from cell-attached patches made on the apical membrane of principal cells in split-open CDs from control (A and B) and CD AC6 KO (C and D) mice on a normal (0.3%) Na diet before (A and C) and after (B and D) treatment with 1 μM AVP for 30 minutes. The closed state (c) is denoted with a dashed line. Inward current is downward. The holding potential for these patches is −Vp = −60 mV. Summary graphs of NPo (E), N (F), and Po (G) for ENaC show control (gray) and CD AC6 KO (black) mice in the absence (hatched bars) and presence (filled bars) of AVP. §Significantly greater compared with the absence of AVP within the same group (P<0.05). **Significantly less than control under identical conditions (P<0.05). Sample sizes are shown in Table 1.
Table 2.
The effect of AVP and water deprivation on ENaC in control versus CD AC6 KO mice
| Treatmenta | NPo | N | Po | Frequencyb | |
|---|---|---|---|---|---|
| Control | Vehicle | 0.84±0.18 | 2.88±0.26 | 0.24±0.02 | 0.64 (57/89) |
| + AVP | 1.50±0.22c | 3.96±0.46c | 0.36±0.03c | 0.81 (26/32) | |
| WD | 1.41±0.20c | 3.21±0.36 | 0.42±0.03c | 0.60 (31/52) | |
| CD AC6 KO | Vehicle | 0.92±0.14 | 3.02±0.26 | 0.26±0.03 | 0.56 (40/71) |
| + AVP | 0.94±0.19d | 3.00±0.37 | 0.25±0.03d | 0.61 (33/54) | |
| WD | 0.79±0.15d | 2.35±0.30 | 0.30±0.03d | 0.58 (23/40) |
All groups were maintained with regular chow containing 0.3% Na.
Isolated CDs pretreated with vehicle or 1 μM AVP for 30 minutes before patch-clamp analysis or isolated from mice that were water deprived (WD) for 24 hours.
Patches with at least one active channel/total number of viable seals for that condition.
Significant increase compared with no AVP within the same group (P<0.05).
Significantly less compared with control under identical conditions (P<0.05).
Discussion
There are several key findings in this study. First, CD AC6 KO increases PRC in an apparent compensation to prevent renal Na loss and reduced arterial pressure. Second, renin-angiotensin system blockade causes hypotension in CD AC6 KO but not control mice. Third, CD AC6 KO mice have reduced renal cortical ENaC mRNA (all three isoforms) and total cell ENaC-α and ENaC-γ protein expression. Finally, AC6 is necessary for acute AVP or water deprivation-induced stimulation of ENaC activity. These findings implicating AC6 as a key mediator of AVP-stimulated ENaC activity are particularly significant when one considers that three AC isoforms exist in the CD that might be modulated by AVP, including AC3, AC4, and AC617 (AC5 is also found in the CD, but is confined to intercalated cells).23–25 A soluble AC isoform is expressed throughout the CD26; however, it is a chemosensor that responds to intracellular pH. It is likely that two or more AC isoforms in the CD mediate AVP stimulation of water transport because mice with CD AC6 gene disruption manifest only a modest urinary concentrating defect (i.e., other AC isoforms must be involved in AVP stimulation of CD water transport).21 In contrast, AC6 appears to be the key mediator of AVP-stimulated ENaC activity in the CD. This suggests that activation of individual AC isoforms by AVP may result in differing biologic effects. Such a scenario has never been described with regard to AVP signaling and, indeed, has never been described, at least to our knowledge, for any biologic system involving cAMP.
Given the above considerations, a fundamentally important question is whether one would expect that individual AC isoforms could exert different biologic effects, even when activated by the same agonist (AVP in this case). It is now clear that once cAMP is formed, it acts within microdomains and does not diffuse widely throughout the cell. Studies have shown that individual AC isoforms colocalize subcellularly with specific G-protein–coupled receptors, phosphodiesterases (PDE), cAMP-activated kinases, and A-kinase anchoring proteins.27,28 Thus, the potential exists for a given agonist to selectively modulate individual AC isoforms with resultant activation of specific signaling pathways. What remains to be demonstrated is whether this does in fact occur. Key questions include whether AC isoforms have discrete subcellular locations, whether several isoforms are physically associated with V2 (or other) receptors, and whether multiple isoforms can be selectively activated by AVP (or other agonists).
Although AVP is by far the best-studied regulator of CD cAMP production, a number of other factors stimulate CD cAMP accumulation, including aldosterone,29 PGI2,30 PGE2 (via the EP4 receptor),31 β-adrenergic agonists,32,33 oxytocin,34 adenosine,35 angiotensin II,36 and glucagon.25,37 A number of agents also inhibit CD cAMP production; however, such analysis has been essentially confined to examination of factors that inhibit AVP actions. These include PGE2 (via the EP3 receptor38), dopamine,39,40 ATP,41 endothelin-1,42 and nitric oxide.43 Taken together, this complexity of regulation of CD cAMP suggests that control of AC isoform activity is extremely complex and must be viewed in the context of which AC isoform is specifically associated with which receptor.
The finding that AC6 is a key mediator of AVP-stimulated ENaC activity may help shed light on how other systems, through modulation of AC6, could affect ENaC activity and potentially water transport. The AC6 isoform is inhibited by nitric oxide, protein kinase A (PKA), receptor tyrosine kinases, protein kinase C, and other factors.16,44–46 AC6 is also inhibited by submicromolar Ca2+ concentrations47 possibly via capacitive Ca2+ entry.16,48 Indeed, several of these factors, including nitric oxide and protein kinase C, have been shown to inhibit AVP-stimulated cAMP accumulation in the CD.49
Another important question is how individual AC isoforms selectively modulate CD function. Three pathways are known to be directly activated by cAMP, including PKA, exchange protein directly activated by cAMP (Epac), and cation channels. With regard to PKA, AVP-stimulated ENaC Po in mouse CCDs was reduced by PKA blockade,5 whereas in lung cells, cAMP increased ENaC N via PKA.50 Epac binds cAMP and activates Rap1, which can activate a variety of signaling systems, including Raf-B and extracellular signal–regulated kinase.51,52 Epac is expressed throughout the CD.53,54 In lung cells, dopamine and Epac agonism increased ENaC Po10; an effect of Epac on CD ENaC activity has not been reported, at least to our knowledge. Cyclic nucleotide gated and hyperpolarization activated cyclic nucleotide gated cation channels have been described in the CD,55,56 although there is no evidence that they mediate AVP effects on Na or water transport. Finally, it will be potentially important to determine which PDE(s) are associated with specific AC isoforms. PDE1, PDE3, and PDE4 have been found in the CD57–62; however, virtually nothing is known about the association between specific PDEs and AC isoforms. Such information would clearly be useful in understanding the fundamental biology of these systems, and may ultimately be of clinical relevance when considering the effects of PDE inhibitors.
Ultimately, one must consider what the clinical relevance of finding that AC6 regulates AVP-stimulated ENaC activity in the CD, as well as having a more modest role in modulating CD water transport. In this regard, it is relevant to consider this system in polycystic kidney disease (PKD). Crossing Brattleboro rats with rats with autosomal recessive PKD (Pkhd1 knockout) rats results in almost complete inhibition of cystogenesis, whereas exogenous AVP restored the full cystic phenotype.63 This cystic effect of AVP is thought to be due to stimulation of cAMP.64 When the C-terminal tail of mouse polycystin-1 is overexpressed in CD cells, cAMP agonism stimulates cell growth, whereas in normal cells, cAMP inhibits cell growth.65 Embryonic renal tubules from PKD1 kidneys respond to cAMP with cystic fibrosis transmembrane conductance regulator-dependent cystic dilation.66 Most importantly, clinical trials have been initiated examining the effectiveness of AVP receptor antagonism in ameliorating kidney disease in patients with PKD.67 A significant potential side effect of such V2 blockade is inappropriate diuresis; clearly, if the proliferative and/or fluid secretory effects of AVP were mediated by specific AC isoforms, then impetus would be given to the development of strategies to target these specific AC isoforms. Knowing the role of individual AC isoforms in the basic physiology of renal Na and water transport would thus assume added importance. Relevant to this, no specific AC isoform inhibitors exist, although this represents an active area of drug development.16,68,69
In summary, we have demonstrated, using a mouse model of CD-specific deletion of the Adcy6 gene, that AC6 is responsible for AVP stimulation of CD ENaC activity. Absence of AC6 prevents AVP stimulation of ENaC open channel probability, apical membrane ENaC abundance (at least acutely), and ENaC mRNA and total cell protein expression (at least chronically). Further exploration of the biology of CD AC6 specifically, and all CD AC isoforms in general, should shed substantial light on the mechanism by which receptor-ligand interactions control cell function in health and disease, and may point the way toward the use and development of drugs targeting components of the AC signaling system.
Concise Methods
Animals
All animal use and welfare adhered to the National Institutes of Health (NIH) Guide for the Care and Use of Laboratory Animals following protocol reviews and approval by the Institutional Laboratory Animal Care and Use Committees of the University of Texas Health Science Center at San Antonio and the University of Utah Health Science Center. CD principal cell-specific knockout of AC6 (CD AC6 KO) was achieved by breeding mice with loxP-flanked (floxed) exons 3–12 of the ADCY6 gene with mice transgenic for the aquaporin 2 promoter driving Cre recombinase expression (AQP2-Cre) as previously described.21 Littermates of the same sex that were homozygous for floxed AC6 but missing AQP2-Cre were used as controls.
Metabolic Cage Studies
Control and CD AC6 KO mice were given free access to water and a 0.3% Na diet for 6 days. Mice were then placed in metabolic cages (Hatteras Instruments, Cary, NC) for 24 hours with free access to food and water, and food and fluid intake were monitored and urine output was collected. Mice were then fed a low Na (0.01%) diet for 7 days; metabolic cage studies were done on the second, third, and seventh days of the low Na diet. Subsequently, mice were fed a high Na (3.15%) diet for 7 days with metabolic cage studies performed on the second, third, and seventh days of the high Na diet.
BP Monitoring and Valsartan Administration
BP was monitored by radiotelemetry (TA11-PAC10; Data Sciences International, St. Paul, MN) with catheters inserted into the right carotid artery. The mice were allowed to recover for 1 week after surgery. BP and heart rate were monitored continuously throughout the normal, low, and high Na diets described under metabolic studies.
A subset of control and CD AC6 mice underwent telemetric monitoring of BP for 5 days after the 1-week equilibration period while on a normal Na diet. An Alzet osmotic minipump set to deliver valsartan at 5 mg/kg per day for 14 days was inserted subcutaneously and hemodynamic recordings resumed 2 days later and continued for another 5 days.
Blood and Urine Assays
PRC was measured by enzyme immunoassay as the amount of angiotensin I generated after incubation with excess angiotensinogen (Peninsula Laboratories, San Carlos, CA). PRC was expressed as the amount of angiotensin I generated per hour per ml of plasma. Urine was hydrolyzed with HCl, ethyl acetate extracted, and aldosterone determined by enzyme immunoassay (Enzo Life Sciences, Farmingdale, NY). Urine Na was determined on an EasyVet Analyzer (Medica, Bedford, MA). Urine AVP was analyzed by ELISA (Enzo Life Sciences, Plymouth Meeting, PA).
Analyses of mRNA
Renal cortical mRNA was isolated using the RNeasy kit (Qiagen, Valencia, CA). Total mRNA was reverse transcribed using the Omniscript Reverse Transcription kit (Qiagen) including an oligo-dT primer and RNase inhibitor RNasin Plus (Invitrogen, Carlsbad, CA). Real-time PCR was performed using the TaqMan gene expression assay (Applied Biosystems, Carlsbad, CA). The ENaC-α, ENaC-β, and ENaC-γ isoforms were assayed using TaqMan probes Mm00803386_m1, Mm00441215_m1, and Mm00441228_m1, respectively. Results were normalized to glyceraldehyde-3-phosphate dehydrogenase using TaqMan probe Mm03302249_g1.
Isolated, Split-Open CD Preparation and Electrophysiologic Analyses
Isolation of CDs suitable for electrophysiology has been described.1,5,70 Kidney slices (<1 mm) were placed into ice-cold physiologic saline solution buffered with 4-(2-hydroxyethyl)-1-piperazineethanesulfonic acid (HEPES) (pH 7.4) and CDs were microdissected. Isolated CDs settled on a cover glass coated with poly-l-lysine were placed in a perfusion chamber mounted on an inverted Nikon Eclipse TE2000 microscope and superfused with room temperature buffered saline solution. CDs were split open with two sharpened micropipettes to gain access to the apical membrane of principal cells. Patch-clamp analysis was done within 2 hours after sacrifice.
ENaC activity in principal cells of murine CDs was quantified in cell-attached patches of the apical membrane made under voltage-clamp conditions (−Vp = −60 mV) using standard procedures.1,5,70 For the current experiments, the typical bath and pipette solutions were as follows (values shown in mM): 150 NaCl, 5 mM KCl, 1 CaCl2, 2 MgCl2, 5 glucose, and 10 HEPES (pH 7.4), and 140 LiCl, 2 MgCl2, and 10 HEPES (pH 7.4), respectively. For each experimental condition, CDs from at least three different mice were assayed.
Protein Isolation and Western Analyses
For measurement of total protein, renal cortex was homogenized in ice-cold sucrose buffer (10 mM triethanolamine, 250 mM sucrose, pH 7.6) and Complete Protease Inhibitors (Roche, Pleasanton, CA) and an aliquot taken for analysis of total protein content using the Bradford method. The remaining sample was solubilized with Laemmli loading buffer containing 0.5% lithium dodecyl sulfate and boiled.
For measurement of the plasma membrane-enriched fraction, renal cortex was homogenized and centrifuged at 1000×g for 15 minutes at 4°C, and the supernatant was removed and re-spun at 17,000×g for 60 minutes at 4°C. The resulting pellet was suspended in Hanks balanced salt solution buffer and an aliquot taken for determination of total protein content. The remaining sample was solubilized with Laemmli loading buffer containing 0.5% lithium dodecyl sulfate and boiled. Note that this method yields membranes that are highly enriched for plasma membrane constituents.71
Total protein and plasma membrane-enriched fractions were run on a denaturing NUPAGE 4%–12% Bis-Tris minigel using a 3-(N-morpholino)propanesulfonic acid buffer system (Invitrogen, Grand Island, NY). Proteins were transferred to a polyvinylidene difluoride plus nylon membrane and visualized with the Advance ECL system (GE Healthcare, Piscataway, NJ). Densitometry was performed with a Bio-Rad gel documentation system (Hercules, CA).
Primary antibodies used for immunoblotting were incubated with membranes in blocking buffer for 2 hours at room temperature. The primary antibodies used were rabbit polyclonal anti-ENaC-α, ENaC-β, or ENaC-γ (StressMarq, Victoria, BC) at a dilution of 1:1000. These antibodies were provided to StressMarq by Dr. Mark Knepper at the NIH and have been extensively characterized.72,73 Secondary horseradish peroxidase-conjugated antibodies (goat anti-rabbit; Santa Cruz Biotech, Santa Cruz, CA) at a dilution of 1:2000 were incubated at room temperature in blocking buffer for 1 hour. After visualization, blots were reprobed with anti-β-actin antibody (Cell Signaling, Danvers, MA) at a dilution of 1:2000 to control for loading, and exposed to secondary antibody at a dilution of 1:5000.
Statistical Analyses and Data Presentation
Data are reported as mean ± SEM. Studies involving varying Na intake, hemodynamics, ELISA, or ENaC mRNA and protein content were analyzed by ANOVA. Patch-clamp studies were analyzed by a two-sided unpaired t test. The criterion for significance was P≤0.05. In patch-clamp studies, for presentation, slow baseline drifts were corrected and current data from some patches were software filtered at 50 Hz.
Disclosures
None.
Acknowledgments
This research was supported by a Merit Review from the Department of Veterans Affairs (D.E.K.) and by Grant R01 DK059594 from the National Institutes of Health (J.D.S.).
Footnotes
Published online ahead of print. Publication date available at www.jasn.org.
References
- 1.Stockand JD: Vasopressin regulation of renal sodium excretion. Kidney Int 78: 849–856, 2010 [DOI] [PubMed] [Google Scholar]
- 2.Ecelbarger CA, Kim GH, Terris J, Masilamani S, Mitchell C, Reyes I, Verbalis JG, Knepper MA: Vasopressin-mediated regulation of epithelial sodium channel abundance in rat kidney. Am J Physiol Renal Physiol 279: F46–F53, 2000 [DOI] [PubMed] [Google Scholar]
- 3.Lahr TF, Record RD, Hoover DK, Hughes CL, Blazer-Yost BL: Characterization of the ion transport responses to ADH in the MDCK-C7 cell line. Pflugers Arch 439: 610–617, 2000 [DOI] [PubMed] [Google Scholar]
- 4.Schafer J, Williams J Jr: Flux measurements in isolated perfused tubules. In: Methods in Enzymology, edited by Fleischer SFB, San Diego, CA, Academic Press, 1990, pp 354–370 [DOI] [PubMed] [Google Scholar]
- 5.Bugaj V, Pochynyuk O, Stockand JD: Activation of the epithelial Na+ channel in the collecting duct by vasopressin contributes to water reabsorption. Am J Physiol Renal Physiol 297: F1411–F1418, 2009 [DOI] [PMC free article] [PubMed] [Google Scholar]
- 6.Mironova E, Bugaj V, Roos KP, Kohan DE, Stockand JD: Aldosterone-independent regulation of the epithelial Na+ channel (ENaC) by vasopressin in adrenalectomized mice. Proc Natl Acad Sci U S A 109: 10095–10100, 2012 [DOI] [PMC free article] [PubMed] [Google Scholar]
- 7.Butterworth MB, Edinger RS, Johnson JP, Frizzell RA: Acute ENaC stimulation by cAMP in a kidney cell line is mediated by exocytic insertion from a recycling channel pool. J Gen Physiol 125: 81–101, 2005 [DOI] [PMC free article] [PubMed] [Google Scholar]
- 8.Gonin S, Deschênes G, Roger F, Bens M, Martin PY, Carpentier JL, Vandewalle A, Doucet A, Féraille E: Cyclic AMP increases cell surface expression of functional Na,K-ATPase units in mammalian cortical collecting duct principal cells. Mol Biol Cell 12: 255–264, 2001 [DOI] [PMC free article] [PubMed] [Google Scholar]
- 9.Morris RG, Schafer JA: cAMP increases density of ENaC subunits in the apical membrane of MDCK cells in direct proportion to amiloride-sensitive Na(+) transport. J Gen Physiol 120: 71–85, 2002 [DOI] [PMC free article] [PubMed] [Google Scholar]
- 10.Helms MN, Chen XJ, Ramosevac S, Eaton DC, Jain L: Dopamine regulation of amiloride-sensitive sodium channels in lung cells. Am J Physiol Lung Cell Mol Physiol 290: L710–L722, 2006 [DOI] [PubMed] [Google Scholar]
- 11.Yang LM, Rinke R, Korbmacher C: Stimulation of the epithelial sodium channel (ENaC) by cAMP involves putative ERK phosphorylation sites in the C termini of the channel’s beta- and gamma-subunit. J Biol Chem 281: 9859–9868, 2006 [DOI] [PubMed] [Google Scholar]
- 12.Segal A, Cucu D, Van Driessche W, Weber WM: Rat ENaC expressed in Xenopus laevis oocytes is activated by cAMP and blocked by Ni(2+). FEBS Lett 515: 177–183, 2002 [DOI] [PubMed] [Google Scholar]
- 13.Snyder PM, Olson DR, Kabra R, Zhou R, Steines JC: cAMP and serum and glucocorticoid-inducible kinase (SGK) regulate the epithelial Na(+) channel through convergent phosphorylation of Nedd4-2. J Biol Chem 279: 45753–45758, 2004 [DOI] [PubMed] [Google Scholar]
- 14.Mustafa SB, Castro R, Falck AJ, Petershack JA, Henson BM, Mendoza YM, Choudary A, Seidner SR: Protein kinase A and mitogen-activated protein kinase pathways mediate cAMP induction of alpha-epithelial Na+ channels (alpha-ENaC). J Cell Physiol 215: 101–110, 2008 [DOI] [PubMed] [Google Scholar]
- 15.Vasquez MM, Castro R, Seidner SR, Henson BM, Ashton DJ, Mustafa SB: Induction of serum- and glucocorticoid-induced kinase-1 (SGK1) by cAMP regulates increases in alpha-ENaC. J Cell Physiol 217: 632–642, 2008 [DOI] [PubMed] [Google Scholar]
- 16.Beazely MA, Watts VJ: Regulatory properties of adenylate cyclases type 5 and 6: A progress report. Eur J Pharmacol 535: 1–12, 2006 [DOI] [PubMed] [Google Scholar]
- 17.Strait KA, Stricklett PK, Chapman M, Kohan DE: Characterization of vasopressin-responsive collecting duct adenylyl cyclases in the mouse. Am J Physiol Renal Physiol 298: F859–F867, 2010 [DOI] [PMC free article] [PubMed] [Google Scholar]
- 18.Hoffert JD, Chou CL, Fenton RA, Knepper MA: Calmodulin is required for vasopressin-stimulated increase in cyclic AMP production in inner medullary collecting duct. J Biol Chem 280: 13624–13630, 2005 [DOI] [PMC free article] [PubMed] [Google Scholar]
- 19.Chien CL, Wu YS, Lai HL, Chen YH, Jiang ST, Shih CM, Lin SS, Chang C, Chern Y: Impaired water reabsorption in mice deficient in the type VI adenylyl cyclase (AC6). FEBS Lett 584: 2883–2890, 2010 [DOI] [PubMed] [Google Scholar]
- 20.Rieg T, Tang T, Murray F, Schroth J, Insel PA, Fenton RA, Hammond HK, Vallon V: Adenylate cyclase 6 determines cAMP formation and aquaporin-2 phosphorylation and trafficking in inner medulla. J Am Soc Nephrol 21: 2059–2068, 2010 [DOI] [PMC free article] [PubMed] [Google Scholar]
- 21.Roos KP, Strait KA, Raphael KL, Blount MA, Kohan DE: Collecting duct-specific knockout of adenylyl cyclase type VI causes a urinary concentration defect in mice. Am J Physiol Renal Physiol 302: F78–F84, 2012 [DOI] [PMC free article] [PubMed] [Google Scholar]
- 22.Pluznick JL, Zou DJ, Zhang X, Yan Q, Rodriguez-Gil DJ, Eisner C, Wells E, Greer CA, Wang T, Firestein S, Schnermann J, Caplan MJ: Functional expression of the olfactory signaling system in the kidney. Proc Natl Acad Sci U S A 106: 2059–2064, 2009 [DOI] [PMC free article] [PubMed] [Google Scholar]
- 23.Chabardès D, Firsov D, Aarab L, Clabecq A, Bellanger AC, Siaume-Perez S, Elalouf JM: Localization of mRNAs encoding Ca2+-inhibitable adenylyl cyclases along the renal tubule. Functional consequences for regulation of the cAMP content. J Biol Chem 271: 19264–19271, 1996 [DOI] [PubMed] [Google Scholar]
- 24.Bek MJ, Zheng S, Xu J, Yamaguchi I, Asico LD, Sun XG, Jose PA: Differential expression of adenylyl cyclases in the rat nephron. Kidney Int 60: 890–899, 2001 [DOI] [PubMed] [Google Scholar]
- 25.Héliès-Toussaint C, Aarab L, Gasc JM, Verbavatz JM, Chabardès D: Cellular localization of type 5 and type 6 ACs in collecting duct and regulation of cAMP synthesis. Am J Physiol Renal Physiol 279: F185–F194, 2000 [DOI] [PubMed] [Google Scholar]
- 26.Hallows KR, Wang H, Edinger RS, Butterworth MB, Oyster NM, Li H, Buck J, Levin LR, Johnson JP, Pastor-Soler NM: Regulation of epithelial Na+ transport by soluble adenylyl cyclase in kidney collecting duct cells. J Biol Chem 284: 5774–5783, 2009 [DOI] [PMC free article] [PubMed] [Google Scholar]
- 27.Cooper DM: Compartmentalization of adenylate cyclase and cAMP signalling. Biochem Soc Trans 33: 1319–1322, 2005 [DOI] [PubMed] [Google Scholar]
- 28.Edwards HV, Christian F, Baillie GS: cAMP: Novel concepts in compartmentalised signalling. Semin Cell Dev Biol 23: 181–190, 2011 [DOI] [PubMed]
- 29.Sheader EA, Wargent ET, Ashton N, Balment RJ: Rapid stimulation of cyclic AMP production by aldosterone in rat inner medullary collecting ducts. J Endocrinol 175: 343–347, 2002 [DOI] [PubMed] [Google Scholar]
- 30.Veis JH, Dillingham MA, Berl T: Effects of prostacyclin on the cAMP system in cultured rat inner medullary collecting duct cells. Am J Physiol 258: F1218–F1223, 1990 [DOI] [PubMed] [Google Scholar]
- 31.Nasrallah R, Laneuville O, Ferguson S, Hébert RL: Effect of COX-2 inhibitor NS-398 on expression of PGE2 receptor subtypes in M-1 mouse CCD cells. Am J Physiol Renal Physiol 281: F123–F132, 2001 [DOI] [PubMed] [Google Scholar]
- 32.Wallace DP, Reif G, Hedge AM, Thrasher JB, Pietrow P: Adrenergic regulation of salt and fluid secretion in human medullary collecting duct cells. Am J Physiol Renal Physiol 287: F639–F648, 2004 [DOI] [PubMed] [Google Scholar]
- 33.Yasuda G, Umemura S, Jeffries WB: Effect of epinephrine on cAMP accumulation in cultured rat inner medullary collecting duct cells. Am J Physiol 272: F192–F197, 1997 [DOI] [PubMed] [Google Scholar]
- 34.Wargent ET, Burgess WJ, Laycock JF, Balment RJ: Separate receptors mediate oxytocin and vasopressin stimulation of cAMP in rat inner medullary collecting duct cells. Exp Physiol 84: 17–25, 1999 [DOI] [PubMed] [Google Scholar]
- 35.Hoenderop JG, Hartog A, Willems PH, Bindels RJ: Adenosine-stimulated Ca2+ reabsorption is mediated by apical A1 receptors in rabbit cortical collecting system. Am J Physiol 274: F736–F743, 1998 [DOI] [PubMed] [Google Scholar]
- 36.Lee YJ, Song IK, Jang KJ, Nielsen J, Frøkiaer J, Nielsen S, Kwon TH: Increased AQP2 targeting in primary cultured IMCD cells in response to angiotensin II through AT1 receptor. Am J Physiol Renal Physiol 292: F340–F350, 2007 [DOI] [PubMed] [Google Scholar]
- 37.Aarab L, Siaume-Perez S, Chabardès D: Cell-specific coupling of PGE2 to different transduction pathways in arginine vasopressin- and glucagon-sensitive segments of the rat renal tubule. Br J Pharmacol 126: 1041–1049, 1999 [DOI] [PMC free article] [PubMed] [Google Scholar]
- 38.Breyer MD, Zhang Y, Guan YF, Hao CM, Hebert RL, Breyer RM: Regulation of renal function by prostaglandin E receptors. Kidney Int Suppl 67: S88–S94, 1998 [DOI] [PubMed] [Google Scholar]
- 39.Schafer JA, Li L, Sun D: The collecting duct, dopamine and vasopressin-dependent hypertension. Acta Physiol Scand 168: 239–244, 2000 [DOI] [PubMed] [Google Scholar]
- 40.Li L, Schafer JA: Dopamine inhibits vasopressin-dependent cAMP production in the rat cortical collecting duct. Am J Physiol 275: F62–F67, 1998 [DOI] [PubMed] [Google Scholar]
- 41.Kishore BK, Chou C-L, Knepper MA: Extracellular nucleotide receptor inhibits AVP-stimulated water permeability in inner medullary collecting duct. Am J Physiol 269: F863–F869, 1995 [DOI] [PubMed] [Google Scholar]
- 42.Oishi R, Nonoguchi H, Tomita K, Marumo F: Endothelin-1 inhibits AVP-stimulated osmotic water permeability in rat inner medullary collecting duct. Am J Physiol 261: F951–F956, 1991 [DOI] [PubMed] [Google Scholar]
- 43.García NH, Pomposiello SI, Garvin JL: Nitric oxide inhibits ADH-stimulated osmotic water permeability in cortical collecting ducts. Am J Physiol 270: F206–F210, 1996 [DOI] [PubMed] [Google Scholar]
- 44.Cooper DM: Regulation and organization of adenylyl cyclases and cAMP. Biochem J 375: 517–529, 2003 [DOI] [PMC free article] [PubMed] [Google Scholar]
- 45.McVey M, Hill J, Howlett A, Klein C: Adenylyl cyclase, a coincidence detector for nitric oxide. J Biol Chem 274: 18887–18892, 1999 [DOI] [PubMed] [Google Scholar]
- 46.Goldstein J, Silberstein C, Ibarra C: Adenylyl cyclase types I and VI but not II and V are selectively inhibited by nitric oxide. Braz J Med Biol Res 35: 145–151, 2002 [DOI] [PubMed] [Google Scholar]
- 47.Stevens T, Nakahashi Y, Cornfield DN, McMurtry IF, Cooper DM, Rodman DM: Ca(2+)-inhibitable adenylyl cyclase modulates pulmonary artery endothelial cell cAMP content and barrier function. Proc Natl Acad Sci U S A 92: 2696–2700, 1995 [DOI] [PMC free article] [PubMed] [Google Scholar]
- 48.Sunahara RK, Taussig R: Isoforms of mammalian adenylyl cyclase: Multiplicities of signaling. Mol Interv 2: 168–184, 2002 [DOI] [PubMed] [Google Scholar]
- 49.Breyer MD, Breyer RM: G protein-coupled prostanoid receptors and the kidney. Annu Rev Physiol 63: 579–605, 2001 [DOI] [PubMed] [Google Scholar]
- 50.Thomas CP, Campbell JR, Wright PJ, Husted RF: cAMP-stimulated Na+ transport in H441 distal lung epithelial cells: role of PKA, phosphatidylinositol 3-kinase, and sgk1. Am J Physiol Lung Cell Mol Physiol 287: L843–L851, 2004 [DOI] [PubMed] [Google Scholar]
- 51.de Rooij J, Zwartkruis FJ, Verheijen MH, Cool RH, Nijman SM, Wittinghofer A, Bos JL: Epac is a Rap1 guanine-nucleotide-exchange factor directly activated by cyclic AMP. Nature 396: 474–477, 1998 [DOI] [PubMed] [Google Scholar]
- 52.Breckler M, Berthouze M, Laurent AC, Crozatier B, Morel E, Lezoualc’h F: Rap-linked cAMP signaling Epac proteins: Compartmentation, functioning and disease implications. Cell Signal 23: 1257–1266, 2011 [DOI] [PubMed] [Google Scholar]
- 53.Li Y, Konings IB, Zhao J, Price LS, de Heer E, Deen PM: Renal expression of exchange protein directly activated by cAMP (Epac) 1 and 2. Am J Physiol Renal Physiol 295: F525–F533, 2008 [DOI] [PubMed] [Google Scholar]
- 54.Yip KP: Epac-mediated Ca(2+) mobilization and exocytosis in inner medullary collecting duct. Am J Physiol Renal Physiol 291: F882–F890, 2006 [DOI] [PubMed] [Google Scholar]
- 55.McCoy DE, Guggino SE, Stanton BA: The renal cGMP-gated cation channel: Its molecular structure and physiological role. Kidney Int 48: 1125–1133, 1995 [DOI] [PubMed] [Google Scholar]
- 56.Bolívar JJ, Tapia D, Arenas G, Castañón-Arreola M, Torres H, Galarraga E: A hyperpolarization-activated, cyclic nucleotide-gated, (Ih-like) cationic current and HCN gene expression in renal inner medullary collecting duct cells. Am J Physiol Cell Physiol 294: C893–C906, 2008 [DOI] [PubMed] [Google Scholar]
- 57.McSorley T, Stefan E, Henn V, Wiesner B, Baillie GS, Houslay MD, Rosenthal W, Klussmann E: Spatial organisation of AKAP18 and PDE4 isoforms in renal collecting duct principal cells. Eur J Cell Biol 85: 673–678, 2006 [DOI] [PubMed] [Google Scholar]
- 58.Cheng J, Grande JP: Cyclic nucleotide phosphodiesterase (PDE) inhibitors: Novel therapeutic agents for progressive renal disease. Exp Biol Med (Maywood) 232: 38–51, 2007 [PubMed] [Google Scholar]
- 59.Yamaki M, McIntyre S, Rassier ME, Schwartz JH, Dousa TP: Cyclic 3′,5′-nucleotide diesterases in dynamics of cAMP and cGMP in rat collecting duct cells. Am J Physiol 262: F957–F964, 1992 [DOI] [PubMed] [Google Scholar]
- 60.Uawithya P, Pisitkun T, Ruttenberg BE, Knepper MA: Transcriptional profiling of native inner medullary collecting duct cells from rat kidney. Physiol Genomics 32: 229–253, 2008 [DOI] [PMC free article] [PubMed] [Google Scholar]
- 61.Stefan E, Wiesner B, Baillie GS, Mollajew R, Henn V, Lorenz D, Furkert J, Santamaria K, Nedvetsky P, Hundsrucker C, Beyermann M, Krause E, Pohl P, Gall I, MacIntyre AN, Bachmann S, Houslay MD, Rosenthal W, Klussmann E: Compartmentalization of cAMP-dependent signaling by phosphodiesterase-4D is involved in the regulation of vasopressin-mediated water reabsorption in renal principal cells. J Am Soc Nephrol 18: 199–212, 2007 [DOI] [PubMed] [Google Scholar]
- 62.Dousa TP: Cyclic-3′,5′-nucleotide phosphodiesterase isozymes in cell biology and pathophysiology of the kidney. Kidney Int 55: 29–62, 1999 [DOI] [PubMed] [Google Scholar]
- 63.Wang X, Wu Y, Ward CJ, Harris PC, Torres VE: Vasopressin directly regulates cyst growth in polycystic kidney disease. J Am Soc Nephrol 19: 102–108, 2008 [DOI] [PMC free article] [PubMed] [Google Scholar]
- 64.Gattone VH, 2nd, Wang X, Harris PC, Torres VE: Inhibition of renal cystic disease development and progression by a vasopressin V2 receptor antagonist. Nat Med 9: 1323–1326, 2003 [DOI] [PubMed] [Google Scholar]
- 65.Sutters M, Yamaguchi T, Maser RL, Magenheimer BS, St John PL, Abrahamson DR, Grantham JJ, Calvet JP: Polycystin-1 transforms the cAMP growth-responsive phenotype of M-1 cells. Kidney Int 60: 484–494, 2001 [DOI] [PubMed] [Google Scholar]
- 66.Magenheimer BS, St John PL, Isom KS, Abrahamson DR, De Lisle RC, Wallace DP, Maser RL, Grantham JJ, Calvet JP: Early embryonic renal tubules of wild-type and polycystic kidney disease kidneys respond to cAMP stimulation with cystic fibrosis transmembrane conductance regulator/Na(+),K(+),2Cl(-) Co-transporter-dependent cystic dilation. J Am Soc Nephrol 17: 3424–3437, 2006 [DOI] [PubMed] [Google Scholar]
- 67.Torres VE, Meijer E, Bae KT, Chapman AB, Devuyst O, Gansevoort RT, Grantham JJ, Higashihara E, Perrone RD, Krasa HB, Ouyang JJ, Czerwiec FS: Rationale and design of the TEMPO (Tolvaptan Efficacy and Safety in Management of Autosomal Dominant Polycystic Kidney Disease and its Outcomes) 3-4 Study. Am J Kidney Dis 57: 692–699, 2011 [DOI] [PubMed] [Google Scholar]
- 68.Kamenetsky M, Middelhaufe S, Bank EM, Levin LR, Buck J, Steegborn C: Molecular details of cAMP generation in mammalian cells: A tale of two systems. J Mol Biol 362: 623–639, 2006 [DOI] [PMC free article] [PubMed] [Google Scholar]
- 69.Pierre S, Eschenhagen T, Geisslinger G, Scholich K: Capturing adenylyl cyclases as potential drug targets. Nat Rev Drug Discov 8: 321–335, 2009 [DOI] [PubMed] [Google Scholar]
- 70.Pochynyuk O, Rieg T, Bugaj V, Schroth J, Fridman A, Boss GR, Insel PA, Stockand JD, Vallon V: Dietary Na+ inhibits the open probability of the epithelial sodium channel in the kidney by enhancing apical P2Y2-receptor tone. FASEB J 24: 2056–2065, 2010 [DOI] [PMC free article] [PubMed] [Google Scholar]
- 71.Sachs AN, Pisitkun T, Hoffert JD, Yu MJ, Knepper MA: LC-MS/MS analysis of differential centrifugation fractions from native inner medullary collecting duct of rat. Am J Physiol Renal Physiol 295: F1799–F1806, 2008 [DOI] [PMC free article] [PubMed] [Google Scholar]
- 72.Masilamani S, Kim GH, Mitchell C, Wade JB, Knepper MA: Aldosterone-mediated regulation of ENaC alpha, beta, and gamma subunit proteins in rat kidney. J Clin Invest 104: R19–R23, 1999 [DOI] [PMC free article] [PubMed] [Google Scholar]
- 73.Nielsen J, Kwon TH, Masilamani S, Beutler K, Hager H, Nielsen S, Knepper MA: Sodium transporter abundance profiling in kidney: Effect of spironolactone. Am J Physiol Renal Physiol 283: F923–F933, 2002 [DOI] [PubMed] [Google Scholar]