

Abstract
Social and ecologic factors, such as residential segregation, are determinants of health in the general population, but how these factors associate with outcomes among patients with ESRD is not well understood. Here, we examined associations of income inequality and residence, as social determinants of health, with survival among black and white patients with ESRD. We merged U.S. Renal Data System data from 589,036 patients who started hemodialysis from 2000 through 2008 with race-specific median household income data from the Census Bureau. We used Gini Index coefficients to assess income distributional inequality and the Dissimilarity Index to determine residential segregation. Black patients lived in areas of lower median household income compared with white patients ($26,742 versus $41,922; P<0.001). Residence in areas with higher median household income was associated with improved survival. Among whites, income inequality was associated with mortality. Among blacks exclusively, residence in highly segregated areas was associated with increased mortality. In conclusion, black hemodialysis patients in the United States are particularly susceptible to gradients in income and residential segregation. Interventions directed at highly segregated black neighborhoods might favorably affect hemodialysis patient outcomes.
Higher socioeconomic status (SES) is strongly associated with improved health nationally and globally.1–5 SES is typically assessed using income, education, or occupation,6 but recent studies have examined interrelationships of ecologic characteristics, such as neighborhood and environmental conditions, as social determinants of health.7–9 Segregation has been linked to poorer health outcomes in the general population, as well as the ESRD population.7,8,10,11 Perception of discrimination and stress have been proposed as mediators of such effects.8,11 Higher mortality and poorer health are more prevalent in states and nations with inequitable income distribution,5,12,13 recently the subject of intense social, medical, and general media attention. Although clinical outcomes are often stratified by race or income, ecologic or residential markers may enhance understanding of results.9
Black patients, with lower income levels, generally have poorer outcomes than whites in the general and Medicare populations.14,15 In contrast, black hemodialysis patients experience longer survival than whites.16–20 The underlying mechanisms are unclear, but psychosocial factors, such as depressive affect, family factors, perception of social support, and quality of life, potentially experienced differentially by black and white patients with ESRD, have recognized associations with survival.21–24
We assessed survival among hemodialysis patients with ESRD, focusing on SES and ecologic measures, using residential county and ZIP code as tools to evaluate residential segregation, income, and income distributional inequality, to explain improved black patient survival. We hypothesized that higher SES would confer improved survival and increased income inequality and residential segregation would be associated with mortality, but outcomes would vary with race.1,5,6,25
Results
Of 589,036 patients with ESRD, 36.2% were black, 54.9% were male, 55.2% had diabetes, 15% lived in the lowest (most equitable) Gini Index area and 34% in the highest (fourth quartile). Ten percent lived in the area with lowest residential segregation and 51% in the area with the highest segregation. Mean age was 64.0±14.9 years. Median household income was $37,500 (interquartile range, $28,845–$48,165).
Black patients were younger (58.8±15.0 versus 67.0±14.0 years; P<0.001), were more likely to be female (49.7% versus 42.5%; P<0.001) and to have diabetes (56.7% versus 54.3%; P<0.001), and had higher body mass index (BMI) (28.8±8.0 versus 28.1±7.4 kg/m2; P<0.001) than white patients (Table 1). Black patients lived in areas with lower median household income ($26,742 versus $41,922; P<0.001) and were more likely to live in areas with high Gini Index (third and fourth quartiles, 79.7% versus 57.6%; P<0.001) and segregated areas (third and fourth quartiles, 80.5% versus 69.1%; P<0.001) than whites. Lower- compared with higher-income black patients were more likely to have coverage by Medicaid, and black patients were more likely to have Medicaid coverage than whites.
Table 1.
Patient characteristics by race
| Characteristics | All (n=589,036) | Black (n=213,327) | White (n=375,709) | P Valuea |
|---|---|---|---|---|
| Male sex (%) | 54.9 | 50.3 | 57.5 | <0.001 |
| Mean age ± SD (yr) | 64.0±14.9 | 58.8±15.0 | 67.0±14.0 | <0.001 |
| Mean BMI ± SD (kg/m2) | 28.4±7.6 | 28.8±8.0 | 28.1±7.4 | <0.001 |
| Median income (interquartile range) ($) | 37,500 (28,845–48,165) | 26,742 (20,765–35,964) | 41,922 (35,168–52,743) | <0.001 |
| Gini Index (%) | <0.001 | |||
| First quartile | 15.1 | 8.4 | 18.9 | |
| Second quartile | 19.3 | 12.0 | 23.5 | |
| Third quartile | 31.5 | 28.4 | 33.3 | |
| Fourth quartile | 34.1 | 51.3 | 24.3 | |
| Residential segregation (%) | <0.001 | |||
| First quartile | 10.3 | 9.1 | 10.9 | |
| Second quartile | 16.5 | 10.5 | 19.9 | |
| Third quartile | 22.3 | 18.7 | 24.3 | |
| Fourth quartile | 51.0 | 61.8 | 44.8 | |
| Current smoker (%) | 6.3 | 6.5 | 6.2 | <0.001 |
| Diabetes (%) | 55.2 | 56.7 | 54.3 | <0.001 |
| Polycystic kidney disease (%) | 2.0 | 1.0 | 2.5 | <0.001 |
| AIDS nephropathy (%) | 0.9 | 2.3 | 0.1 | <0.001 |
| Comorbid condition (%) | ||||
| Chronic obstructive pulmonary disease | 9.6 | 5.3 | 12.1 | <0.001 |
| Congestive heart failure | 34.6 | 29.4 | 37.5 | <0.001 |
| Peripheral vascular disease | 15.2 | 10.0 | 18.1 | <0.001 |
| Cerebrovascular disease | 10.2 | 9.8 | 10.5 | <0.001 |
| Atherosclerotic heart disease | 27.0 | 16.3 | 33.0 | <0.001 |
| Cancer | 7.3 | 4.6 | 8.9 | <0.001 |
| Insurance status (%) | <0.001 | |||
| Employer group health insurance | 24.0 | 22.5 | 24.9 | |
| Medicaid | 21.8 | 33.2 | 15.4 | |
| Medicare | 39.4 | 25.1 | 47.4 | |
| No insurance | 6.8 | 11.5 | 4.2 | |
| Others | 8.0 | 7.8 | 8.1 | |
| Prior employment status (%) | <0.001 | |||
| Employed | 15.8 | 18.9 | 14.0 | |
| Homemaker/student/other | 10.7 | 10.5 | 10.8 | |
| Retire: age/preference | 40.9 | 26.9 | 48.9 | |
| Retire: disability | 17.7 | 20.6 | 16.1 | |
| Unemployed | 14.9 | 23.0 | 10.3 |
Quartile definitions for Gini Index, and residential segregation were as follows: Gini Index, 0.33–0.41, 0.41–0.43, 0.43–0.46, and 0.46–0.60; for residential segregation, 0–39.50, 39.50–48.95, 48.95–58.60, and 58.60–94.00.
Calculated per the following: t test for continuous variables, chi-square test for categorical variables, and Wilcoxon-Mann-Whitney test for median comparison.
Demographic and medical characteristics are presented by Gini Index quartile (Table 2). Compared with patients living in the areas with the most equitable income distribution, those living in areas with higher Gini Index were more likely to be black and female and less likely to have diabetes. They were more likely to have lower income and be uninsured and were less likely to have employer group health insurance. Dramatic gradients of median household income, percentage of black patients, and proportion insured or unemployed as Gini Index quartile increased were evident (Figure 1A). Figure 1, B–D, shows geographic variations in Gini Index by county and in median household income among whites and blacks, by ZIP code.
Table 2.
Patient characteristics by Gini Index quartile
| Characteristics | Gini Index Quartile | P Valuea | |||
|---|---|---|---|---|---|
| First (n=89,042) | Second (n=113,865) | Third (n=185,453) | Fourth (n=200,676) | ||
| Black race (%) | 20.2 | 22.4 | 32.6 | 54.5 | <0.001 |
| Male sex (%) | 56.2 | 55.8 | 55.4 | 53.4 | <0.001 |
| Mean age ± SD (yr) | 64.8±14.6 | 65.0±14.6 | 64.4±14.8 | 62.8±15.2 | <0.001 |
| Mean BMI ± SD (kg/m2) | 28.7±7.8 | 28.6±7.6 | 28.3±7.6 | 28.2±7.7 | <0.001 |
| Median income (interquartile range) ($) | 46,054 (38,750–56,337) | 38,788 (32,478–48,494) | 37,640 (29,530–48,835) | 31,544 (22,791–41,658) | <0.001 |
| Among non-Hispanic whites | <0.001 | ||||
| Patients (n) | 71,039 | 88,343 | 124,982 | 91,345 | |
| Income ($) | 46,889 (39,994–56,880) | 40,593 (35,017–50,543) | 41,573 (34,558–52,905) | 39,991 (32,115–51,428) | |
| Among non-Hispanic blacks | <0.001 | ||||
| Patients (n) | 18,003 | 25,522 | 60,471 | 109,331 | |
| Income ($) | 41,094 (30,070–53,326) | 29,539 (23,768–38,330) | 27,368 (21,568–36,205) | 24,682 (19,228–32,463) | |
| Current smoker (%) | 6.0 | 6.6 | 6.6 | 6.0 | <0.001 |
| Diabetes (%) | 55.9 | 55.8 | 55.1 | 54.6 | <0.001 |
| Polycystic kidney disease (%) | 2.3 | 2.2 | 2.0 | 1.6 | <0.001 |
| AIDS nephropathy (%) | 0.4 | 0.5 | 0.6 | 1.6 | <0.001 |
| Comorbid condition (%) | |||||
| Chronic obstructive pulmonary disease | 10.8 | 11.3 | 10.1 | 7.7 | <0.001 |
| Congestive heart failure | 35.5 | 35.5 | 35.7 | 32.6 | <0.001 |
| Peripheral vascular disease | 16.4 | 17.0 | 15.8 | 13.0 | <0.001 |
| Cerebrovascular disease | 10.4 | 10.3 | 10.7 | 9.8 | <0.001 |
| Atherosclerotic heart disease | 29.8 | 29.9 | 28.3 | 22.8 | <0.001 |
| Cancer | 8.2 | 8.0 | 7.6 | 6.3 | <0.001 |
| Insurance status (%) | <0.001 | ||||
| Employer group health insurance | 29.6 | 24.8 | 24.3 | 20.9 | |
| Medicaid | 15.3 | 18.4 | 21.8 | 26.7 | |
| Medicare | 42.9 | 43.3 | 39.6 | 35.3 | |
| No insurance | 4.9 | 5.3 | 6.0 | 9.3 | |
| Others | 7.4 | 8.2 | 8.4 | 7.8 | |
| Prior employment status (%) | <0.001 | ||||
| Employed | 16.7 | 15.1 | 15.5 | 16.0 | |
| Homemaker/student/other | 12.3 | 10.9 | 9.9 | 10.5 | |
| Retire: age/preference | 44.6 | 44.8 | 42.4 | 35.7 | |
| Retire: disability | 15.8 | 17.4 | 17.7 | 18.9 | |
| Unemployed | 10.7 | 11.8 | 14.5 | 18.9 | |
Quartile definition for Gini Index was as follows: 0.33–0.41, 0.41–0.43, 0.43–0.46, and 0.46–0.60.
Calculated per the following: ANOVA for continuous variables, chi-square test for categorical variables, and Kruskal-Wallis test for median comparison.
Figure 1.
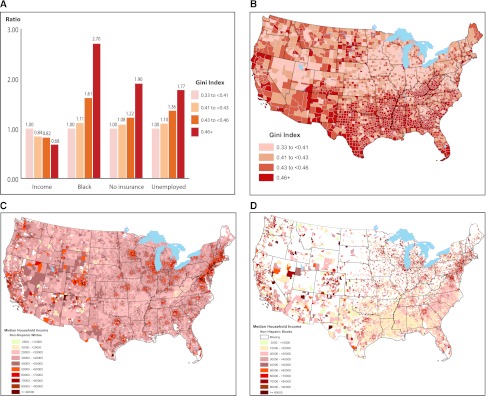
Selected patient characteristics by Gini Index quartile (A), geographic variations in Gini Index by county (B), and geographic variations in median household income among (C) non-Hispanic whites and (D) non-Hispanic blacks, by ZIP code.
The distribution of demographic and medical characteristics varied by quartile of Dissimilarity Index (Table 3). Compared with other quartiles, patients living in the areas with highest segregation were more likely to be black and were less likely to have diabetes and insurance.
Table 3.
Patient characteristics by residential segregation quartile
| Characteristics | Residential Segregation | P Valuea | |||
|---|---|---|---|---|---|
| First (n=60,436) | Second (n=97,153) | Third (n=131,252) | Fourth (n=300,195) | ||
| Black race (%) | 32.0 | 23.0 | 30.3 | 43.9 | <0.001 |
| Male sex (%) | 54.6 | 55.6 | 55.1 | 54.7 | <0.001 |
| Mean age ± SD (yr) | 63.6±14.7 | 64.5±14.6 | 64.1±14.7 | 63.9±15.1 | <0.001 |
| Mean BMI ± SD (kg/m2) | 28.6±7.6 | 28.5±7.6 | 28.5±7.7 | 28.2±7.6 | <0.001 |
| Median income (interquartile range) ($) | 37,315 (28,428–47,270) | 38,785 (31,357–48,828) | 37,679 (29,941–47,839) | 37,014 (27,624–48,423) | <0.001 |
| Among non-Hispanic whites | <0.001 | ||||
| Patients (n) | 41,073 | 74,856 | 91,435 | 168,345 | |
| Income ($) | 41,335 (35,275–50,967) | 41,098 (35,017–51,182) | 40,696 (34,412–51,181) | 43,560 (35,614–54,854) | |
| Among non-Hispanic blacks | <0.001 | ||||
| Patients (n) | 19,363 | 22,297 | 39,817 | 131,850 | |
| Income ($) | 23,650 (19,060–31,600) | 25,726 (20,136–35,824) | 26,494 (20,320–36,563) | 27,670 (21,430–36,261) | |
| Current smoker (%) | 6.8 | 6.6 | 7.0 | 5.8 | <0.001 |
| Diabetes (%) | 56.1 | 55.6 | 56.1 | 54.4 | <0.001 |
| Polycystic kidney disease (%) | 2.2 | 2.2 | 2.2 | 1.7 | <0.001 |
| AIDS nephropathy (%) | 0.5 | 0.4 | 0.6 | 1.3 | <0.001 |
| Comorbid condition (%) | |||||
| Chronic obstructive pulmonary disease | 9.9 | 10.4 | 10.5 | 8.9 | <0.001 |
| Congestive heart failure | 33.3 | 34.0 | 35.4 | 34.6 | <0.001 |
| Peripheral vascular disease | 15.8 | 15.4 | 16.6 | 14.4 | <0.001 |
| Cerebrovascular disease | 10.5 | 10.2 | 10.6 | 10.0 | <0.001 |
| Atherosclerotic heart disease | 26.8 | 27.3 | 28.3 | 26.3 | <0.001 |
| Cancer | 7.1 | 7.6 | 7.5 | 7.2 | <0.001 |
| Insurance status (%) | <0.001 | ||||
| Employer group health insurance | 23.6 | 23.3 | 24.1 | 24.3 | |
| Medicaid | 21.9 | 20.3 | 20.8 | 22.7 | |
| Medicare | 41.0 | 42.4 | 40.4 | 37.6 | |
| No insurance | 6.6 | 5.9 | 6.6 | 7.3 | |
| Others | 6.9 | 8.1 | 8.1 | 8.1 | |
| Prior employment status (%) | <0.001 | ||||
| Employed | 15.7 | 15.5 | 15.5 | 16.0 | |
| Homemaker/student/other | 11.8 | 10.3 | 10.4 | 10.7 | |
| Retire: age/preference | 39.3 | 42.7 | 41.5 | 40.4 | |
| Retire: disability | 19.2 | 18.4 | 19.0 | 16.7 | |
| Unemployed | 14.0 | 13.3 | 13.6 | 16.2 | |
Quartile definition for residential segregation was as follows: 0–39.50, 39.50–48.95, 48.95–58.60, and 58.60–94.00.
Calculated per the following: ANOVA for continuous variables, chi-square test for categorical variables, and Kruskal-Wallis test for median comparison.
During a median 22.5 months of follow-up, 333,427 patients died (56.6% of those at risk). The overall mortality rate was 233.3 (95% confidence interval [CI], 232.5–234.1) deaths/1000 person-years. The mortality rate was 166.0 (95% CI, 165.0–167.1) deaths/1000 person-years in blacks and 283.9 (282.8–285.1) deaths/1000 person-years in whites.
Table 4 shows results of incrementally adjusted Cox models. In the basic model, black patients had 27% lower mortality than whites (hazard ratio [HR], 0.73; 95% CI, 0.72–0.75), after adjustment for age, sex, dialysis initiation year, BMI, smoking, diabetes, polycystic kidney disease, AIDS nephropathy, insurance and prior employment status, and comorbid conditions. This HR was not appreciably altered after additional adjustment for income (model 2), Gini Index (model 3), or segregation quartile (model 4). We found gradients between income and mortality: higher income was associated with longer survival (models 2, 3, and 4). The relationship was consistent after adjustments for Gini Index and segregation quartiles. Patients living in areas in the highest Gini Index quartile had a 4%–6% greater risk of death compared with those living in the areas in the lowest quartile. Patients living in more segregated areas had higher mortality risk than those living in low-segregation areas.
Table 4.
Adjusted hazard ratios of death associated with race, income, Gini Index, and residential segregation (n=580,629)
| Characteristics | Model 1 | Model 2 | Model 3 | Model 4 | ||||
|---|---|---|---|---|---|---|---|---|
| HR (95% CI) | P Value | HR (95% CI) | P Value | HR (95% CI) | P Value | HR (95% CI) | P Value | |
| Race | ||||||||
| White | 1.00 | 1.00 | 1.00 | 1.00 | ||||
| Black | 0.73 (0.72–0.75) | <0.001 | 0.70 (0.69–0.72) | <0.001 | 0.70 (0.69–0.71) | <0.001 | 0.70 (0.69–0.71) | <0.001 |
| Income | ||||||||
| $2500 to <$20,000 | 1.08 (1.06–1.11) | <0.001 | 1.06 (1.04–1.09) | <0.001 | 1.07 (1.05–1.09) | <0.001 | ||
| $20,000 to <$30,000 | 1.04 (1.03–1.06) | <0.001 | 1.04 (1.02–1.05) | <0.001 | 1.04 (1.02–1.05) | <0.001 | ||
| $30,000 to <$40,000 | 1.00 | 1.00 | 1.00 | |||||
| $40,000 to <$50,000 | 0.99 (0.97–1.00) | 0.032 | 0.99 (0.98–1.00) | 0.106 | 0.99 (0.98–1.00) | 0.057 | ||
| $50,000 to <$60,000 | 0.97 (0.95–0.98) | <0.001 | 0.97 (0.96–0.99) | <0.001 | 0.97 (0.95–0.98) | <0.001 | ||
| $60,000 to <$70,000 | 0.95 (0.93–0.97) | <0.001 | 0.95 (0.93–0.97) | <0.001 | 0.95 (0.93–0.97) | <0.001 | ||
| ≥$70,000 | 0.94 (0.92–0.96) | <0.001 | 0.94 (0.92–0.96) | <0.001 | 0.94 (0.92–0.96) | <0.001 | ||
| Gini Indexa | ||||||||
| First quartile (lowest) | 1.00 | 1.00 | ||||||
| Second quartile | 1.00 (0.98–1.03) | 0.86 | 1.00 (0.97–1.02) | 0.77 | ||||
| Third quartile | 1.01 (0.99–1.03) | 0.28 | 1.00 (0.98–1.02) | 0.87 | ||||
| Fourth quartile (highest) | 1.06 (1.04–1.09) | <0.001 | 1.04 (1.02–1.07) | <0.001 | ||||
| Residential segregationb | ||||||||
| First quartile (lowest) | 1.00 | |||||||
| Second quartile | 1.02 (1.00–1.05) | 0.106 | ||||||
| Third quartile | 1.03 (1.01–1.05) | 0.017 | ||||||
| Fourth quartile (highest) | 1.05 (1.02–1.07) | <0.001 | ||||||
In addition to the variables presented in the table, Cox proportional hazards model also adjusted for sex, age, year of dialysis initiation, BMI, smoking, diabetes, polycystic kidney disease, AIDS nephropathy, insurance, prior employment status, and comorbid conditions (chronic obstructive pulmonary disease, congestive heart failure, peripheral vascular disease, cerebrovascular disease, atherosclerotic heart disease, and cancer) in each model.
Quartile definitions for Gini Index and residential segregation were as follows: for Gini Index, 0.33–0.41, 0.41–0.43, 0.43–0.46, and 0.46–0.60; for residential segregation, 0–39.50, 39.50–48.95, 48.95–58.60, and 58.60–94.00.
Table 5 shows separate fully adjusted models for black and white patients. The relationship between lower income and increased mortality was consistent in both whites and blacks. Among whites, increased risks associated with residence in areas with higher Gini Index were apparent only for the highest quartile (HR, 1.06; 95% CI, 1.04–1.09) compared with those living in the lowest-quartile areas. There was no association between segregation and mortality.
Table 5.
Adjusted hazard ratios of death associated with income, Gini Index, and residential segregation, by race
| Characteristics | White (n=370,861) | Black (n=209,768) | ||
|---|---|---|---|---|
| HR (95% CI) | P Value | HR (95% CI) | P Value | |
| Income | ||||
| $2500 to <$20,000 | 1.02 (0.96–1.09) | 0.53 | 1.08 (1.05–1.11) | <0.001 |
| $20,000 to <$30,000 | 1.04 (1.02–1.05) | <0.001 | 1.04 (1.01–1.06) | 0.002 |
| $30,000 to <$40,000 | 1.00 | 1.00 | ||
| $40,000 to <$50,000 | 0.99 (0.98–1.01) | 0.30 | 0.96 (0.93–0.99) | 0.01 |
| $50,000 to <$60,000 | 0.97 (0.96–0.99) | <0.001 | 0.95 (0.91–1.00) | 0.03 |
| $60,000 to <$70,000 | 0.95 (0.93–0.98) | <0.001 | 0.91 (0.86–0.96) | 0.001 |
| ≥$70,000 | 0.94 (0.92–0.97) | <0.001 | 0.95 (0.89–1.00) | 0.05 |
| Gini Indexa | ||||
| First quartile (lowest) | 1.00 | 1.00 | ||
| Second quartile | 1.00 (0.98–1.02) | 1.00 | 0.98 (0.93–1.04) | 0.51 |
| Third quartile | 1.01 (0.99–1.03) | 0.20 | 0.96 (0.91–1.01) | 0.10 |
| Fourth quartile (highest) | 1.06 (1.04–1.09) | <0.001 | 0.99 (0.94–1.04) | 0.63 |
| Residential segregationa | ||||
| First quartile (lowest) | 1.00 | 1.00 | ||
| Second quartile | 1.00 (0.98–1.03) | 0.81 | 1.06 (1.02–1.11) | 0.006 |
| Third quartile | 1.01 (0.99–1.03) | 0.35 | 1.07 (1.03–1.12) | 0.002 |
| Fourth quartile (highest) | 1.01 (0.99–1.04) | 0.27 | 1.13 (1.09–1.18) | <0.001 |
Cox proportional hazards model adjusted for income, Gini Index, segregation, sex, age and year of dialysis initiation, BMI, smoking, diabetes, polycystic kidney disease, AIDS nephropathy, insurance, prior employment status, and comorbid conditions (chronic obstructive pulmonary disease, congestive heart failure, peripheral vascular disease, cerebrovascular disease, atherosclerotic heart disease, and cancer).
Quartile definitions for Gini Index and residential segregation were as follows: for Gini Index, 0.33–0.41, 0.41–0.43, 0.43–0.46, and 0.46–0.60; for residential segregation, 0–39.50, 39.50–48.95, 48.95–58.60, and 58.60–94.00.
In contrast, among black patients, there was no association between income inequality and mortality, but there was an independent increased mortality risk for those living in highly segregated areas. The HRs comparing the second through fourth quartiles, respectively, of the Dissimilarity Index, relative to the first quartile progressively increased from 1.06 (95% CI, 1.02–1.11) to 1.07 (95% CI, 1.03–1.12) to 1.13 (95% CI, 1.09–1.18).
Several analyses were conducted to test the robustness of the results to different specifications. With use of the following, the findings were essentially similar to those reported above: an alternative categorization for the Dissimilarity Index (low, moderate, and high segregation with cutoffs at 30 and 60) rather than quartile-based categorization, poverty quartile categorization rather than income groups, and a subpopulation in which only patients who resided in Metropolitan Statistical Areas were included (data not shown). To address possible informative censoring due to kidney transplantation or switch to peritoneal dialysis, analyses were repeated without censoring. Results of these sensitivity analyses were similar to the presented findings.
Discussion
In the United States, black patients with ESRD who are undergoing hemodialysis have greater survival compared with whites,10,16,24 a situation that has been unexplained by demographic, treatment, or biochemical factors, as contrasted with shorter survival in black persons in the general population and the Medicare system.14 This unusual finding is extremely robust. We found that lower income, income disparity, and segregation were all related to increased mortality. Controlling for these variables, however, only increased the black survival advantage relative to whites.
Previous investigators have addressed this unusual race effect using SES and psychosocial measures but have not resolved this counterintuitive finding.10,16,19,24 In the United States, black patients with ESRD undergoing hemodialysis have improved quality of life compared with whites, suggested as a potential mechanism underlying survival disparities.22–24 Rodriguez et al.10 and Eisenstein et al.19 assessed survival and income in hemodialysis patients in the United States and reported contradictory findings. Neither study used race-specific income data. We used race-specific median household Census income based on ZIP code, as did others,14 and showed that lower income was a mortality risk factor in both black and white patients, although controlling for income and income inequality did not modify black patients’ survival advantages.
Another social construct measure is income disparity. It is well documented that income disparity is increasing in the United States.5 We found that income disparity was only marginally related to mortality in hemodialysis patients. Only white patients had higher mortality, in the areas with highest income disparity.
Our third SES measure was residential segregation. In black hemodialysis patients, we noted a strong graded relationship of residential segregation that eliminated associations of income inequality and mortality. Black patients living in highly segregated areas had a 13% increased mortality risk. In a study that was limited to metropolitan areas and used the proportion of black residents in a location as the measure of segregation, Rodriguez et al.10 also found a relationship between residential segregation and outcome, but only in white patients.
Disparities in survival exist between different dialysis units in the United States, attributed largely to individual differences, such as case mix.16 Such differences may be related, partially, to the SES of patients treated in individual units or the location of the unit within a state. Alternatively, differences in health outcomes may relate to differences between the physicians treating different groups of patients. Racial discordance in patient-physician relationships26,27 affects participatory decision-making styles, trust, level of patient satisfaction, and other intermediary outcomes. The perception of urban, black hemodialysis patients regarding physician attitudes is linked with regimen adherence,28 which in turn predicts survival.21,22,29 Alternatively, physician practice, training, and quality may vary between locales. Differences in social support,21,22,24 availability of prescription drugs,30 or distribution of income between states or nations5 may play roles in underpinning differential mortality outcomes. Differences in social support and availability of medications are in themselves likely related to SES.31
Residential segregation has been linked to poor health outcomes in blacks in the general population.7,8,11,32 Segregation, however, is not necessarily equivalent to poverty. Black patients with ESRD who live in high-segregation areas were more likely to reside in areas with both high Gini Index and high income levels. The negative effects of segregation on health outcomes for black patients, which have been linked to perceptions of discrimination and stress,7,8 may override the negative effects of low income and inequitable income distribution. Stress may be experienced differentially as SES increases in black and white patients with ESRD.24,25 The ESRD program may confer enhanced benefits to poorer black patients with CKD who survive to the stage of requiring dialysis and become entitled to Medicare coverage. Such benefits include access to medical care, medication, and social work counseling, which were perhaps more available to white patients before ESRD onset. Specifically, black patients who have lower SES compared with those with higher SES in this study were more likely to be covered by Medicaid, and therefore may have had more access to physicians before starting ESRD therapy. In addition, social factors, which convey a survival advantage, such as perceptions of well-being and social support,21,22,24 may be differentially experienced by black and white patients with equivalent illness severity.21,22,24 White segregation, in this study, is likely to be located in higher income areas. The effects of segregation for blacks, while declining over time,33 might selectively include greater levels of stress; unsafe physical environments; maladaptive diets; lack of access to inexpensive, nutritional foods; and residence in areas that are characterized by violence or predisposing to inactivity or that magnify perceptions of discrimination.7–9,34 This finding is important because it applies to more than one third of patients with ESRD, a group 3.5 times more likely than whites to start hemodialysis.
Ren et al. found that experiences of racial discrimination were increased in black patients with higher SES, measured by education.25 Those who reported greater perception of discrimination reported poorer perceptions of general and mental health status,25 markers that predict mortality among patients undergoing hemodialysis.22–24 Perceptions of discrimination were also more common among black respondents with higher levels of education.35
The current study has two major limitations. First, the USRDS is an observational data registry, so causality cannot necessarily be inferred. The USRDS lacks information on the psychological, social, spiritual, and ecologic characteristics of patients, as well as many factors related to treatment, several of which may underlie racial disparities in ESRD patient outcomes. However, because the USRDS is an unbiased census of almost all patients with ESRD, with accurate and complete mortality ascertainment, group mortality differences are reliable. Second, income measures, income inequality, and segregation are ecologic variables and may not accurately reflect individual patient characteristics. In addition, the lack of granularity in the geographic data, with analyses limited to ZIP code or county-level data, rather than census tracts, does not permit more localized analyses. Dialysis Compare data from the Centers for Medicare & Medicaid Services (CMS) were also not used in our analyses.
This study demonstrates that socioeconomic and residential factors are associated with differential survival among black and white patients with ESRD in complex ways. Although black patients with ESRD with lower incomes have longer survival than whites, blacks have worsened mortality as residential segregation increases. Biopsychosocial advantages in black patients with ESRD may explain some of the findings, whereas experience of discrimination may explain some findings in black patients who live in highly segregated locations. Income may have an important effect on survival among both black and white hemodialysis patients; inequitable income distribution is associated with mortality of white hemodialysis patients. Income inequality and segregation may mediate worsened survival as a result of differential quality of dialysis providers or as a consequence of stress or decreased access to health care related to decreased spending on medical or social programs. Several different types of demographic, physiologic, perceptual, and sociologic data analyses, including longitudinal studies, will be necessary to establish causal linkages regarding social determinants of health. However, a few outstanding patient-level factors are ripe for investigation in elucidating the disparate associations of race, income, and the inequitable distribution of income and survival in patients with ESRD who are undergoing hemodialysis. We need to have more granular information on the psychological, social, and environmental status of our patients in order to understand disparities and facilitate development of strategies to change the effects of social determinants of health. Future research should assess ecologic analyses using sociodemographic variables assessing outcomes based on Dialysis Compare data, as well as analyses of possible disparities in the associations of insurance and employment status, as SES measures, with important outcomes in the ESRD program.
Income inequality and segregation, however, are social conditions that cannot be solely overcome by medical interventions. Interventions to ameliorate disparities associated with segregation will necessarily be different in urban and rural areas in which segregation is manifested and experienced in different manners. Efforts to combat the deleterious effects of segregation, however, may improve outcomes for black hemodialysis patients.
Concise Methods
Study Design, Data Sources, and Sample Selection
Using USRDS, a national ESRD registry,20 we performed a retrospective cohort study of hemodialysis patients, identifying patient-level characteristics, including demographic, clinical, treatment, and mortality data, and residential county and ZIP code at ESRD initiation. Because USRDS does not collect income information, each patient was assigned a race-specific median household income by his or her race and residential ZIP code, which served as a proxy for individual income, using 2000 U.S. Census data. Patients were assigned to income categories (<$20,000, $20,000–$29,999, $30,000–$39,999, $40,000–$49,999, $50,000–$59,999, $60,000–$69,999, and >$70,000) based on residence. To assess associations of mortality with poverty, defined as residing in an area with high or low proportion of individuals below the poverty line, we categorized areas by ZIP code into quartile distributions.
Two county-level variables, the Gini Index (measuring magnitude of income distributional inequality) and the Dissimilarity Index (measuring racial residential segregation) were assessed using 2000 U.S. Census data. The Gini Index represents the degree of equitability of household income distribution, ranging between 0 (a perfectly equal county in which all household income is equally shared) and 1 (a perfectly unequal county where all income is earned by one household).5,36,37 The Dissimilarity Index, the most commonly used measure of racial residential segregation,7,38 measures the distribution of non-Hispanic whites and blacks across county Census block groups, ranging from 0 (a perfectly equal county where blacks and whites have equal proportional representation in all block groups) to 100 (a perfectly unequal county where all blacks live in exclusively black block groups while all whites live in all-white block groups).39 Data were obtained from the Racial Residential Segregation Measurement Project in Population Studies Center, University of Michigan.39 We categorized counties into Gini Index and segregation quartile distributions and assigned each patient to quartiles based on county residence. An alternative three-group categorization for the Dissimilarity Index (≤30, 31–60, and >60) was also used.
The study cohort included non-Hispanic black and white patients with ESRD older than 20 years of age who initiated in-center hemodialysis between January 1, 2000, and December 30, 2008 (n=623,949). We excluded 14,048 patients (2%) because residential county code could not be linked to county-level data. An additional 20,865 (3%) patients were excluded because income data were unavailable. On the basis of Census metropolitan area definitions from 2003,40 we identified residents of Metropolitan Statistical Areas for sensitivity analyses.
Study Variables
Patient characteristics were taken from the CMS Medical Evidence Form (CMS-2728), including age, year of dialysis initiation, race, sex, BMI (kg/m2), current smoking status, insurance, and 6-month prior employment status, as well as primary cause of renal failure and comorbid conditions.
Statistical Analyses
Patient characteristics at dialysis initiation were categorized by Gini Index and Dissimilarity (segregation) Index quartiles. Means and SD for age and BMI, median and interquartile range for income, and percentage distributions for categorical variables were calculated. We used ANOVA for age and BMI, Kruskal-Wallis for income, and chi-square tests for categorical variables to compare distribution differences among Gini Index and Dissimilarity Index group quartiles.
Patients were followed for death from dialysis initiation date and were censored at the earliest date of kidney transplantation, switch to peritoneal dialysis, or August 31, 2009. All-cause mortality rates were calculated. Cox proportional hazards regression analyses assessed whether associations of the primary predictor with all-cause mortality were independent of other known factors and quantified mortality HR. Models first evaluated race alone and were subsequently adjusted for income, Gini Index, and segregation. All patient-level demographic characteristics and medical conditions were included in multivariate-adjusted models.
Effect modification was tested with race–by–Gini Index and race-by-segregation interaction terms, separately, in the model. Because the race-by-segregation interaction was significant, separate full models by race were analyzed. We also analyzed patient follow-up to death without treating transplantation or switch to peritoneal dialysis as censored observations. Proportional hazards models were fit using sandwich estimates for variance calculation to account for potentially unaccounted factors clustering by county. Proportional hazards assumptions were examined by graphing log (-log[survival function]) curves. No violation was observed.
Statistical significance was defined as P<0.05 using two-tailed tests. All analyses were conducted using SAS software, version 9.2 (SAS Institute, Inc., Cary, NC).
Disclosures
None.
Acknowledgments
The views expressed do not necessarily represent the views of the Department of Health and Human Services; the National Institutes of Health; the National Institute of Diabetes and Digestive and Kidney Diseases; or the U.S. government.
Footnotes
Published online ahead of print. Publication date available at www.jasn.org.
See related editorial, “Poverty and Mortality in Hemodialysis Patients,” on pages 165–167.
References
- 1.Adler NE, Boyce WT, Chesney MA, Folkman S, Syme SL: Socioeconomic inequalities in health. No easy solution. JAMA 269: 3140–3145, 1993 [PubMed] [Google Scholar]
- 2.Marmot MG, Shipley MJ, Rose G: Inequalities in death—specific explanations of a general pattern? Lancet 1: 1003–1006, 1984 [DOI] [PubMed] [Google Scholar]
- 3.Pappas G, Queen S, Hadden W, Fisher G: The increasing disparity in mortality between socioeconomic groups in the United States, 1960 and 1986. N Engl J Med 329: 103–109, 1993 [DOI] [PubMed] [Google Scholar]
- 4.McCally M, Haines A, Fein O, Addington W, Lawrence RS, Cassel CK: Poverty and ill health: Physicians can, and should, make a difference. Ann Intern Med 129: 726–733, 1998 [DOI] [PubMed] [Google Scholar]
- 5.Truman BI, Smith KC, Roy K, Chen Z, Moonesinghe R, Zhu J, Crawford CG, Zaza S, Centers for Disease Control and Prevention (CDC) : Rationale for regular reporting on health disparities and inequalities—United States. MMWR Surveill Summ 60[Suppl]: 3–10, 2011 [PubMed] [Google Scholar]
- 6.Krieger N, Williams DR, Moss NE: Measuring social class in US public health research: Concepts, methodologies, and guidelines. Annu Rev Public Health 18: 341–378, 1997 [DOI] [PubMed] [Google Scholar]
- 7.Nuru-Jeter AM, LaVeist TA: Racial segregation, income inequality, and mortality in US metropolitan areas. J Urban Health 88: 270–282, 2011 [DOI] [PMC free article] [PubMed] [Google Scholar]
- 8.Williams DR, Sternthal M: Understanding racial-ethnic disparities in health: Sociological contributions. J Health Soc Behav 51[Suppl]: S15–S27, 2010 [DOI] [PMC free article] [PubMed] [Google Scholar]
- 9.Ludwig J, Sanbonmatsu L, Gennetian L, Adam E, Duncan GJ, Katz LF, Kessler RC, Kling JR, Lindau ST, Whitaker RC, McDade TW: Neighborhoods, obesity, and diabetes—a randomized social experiment. N Engl J Med 365: 1509–1519, 2011 [DOI] [PMC free article] [PubMed] [Google Scholar]
- 10.Rodriguez RA, Sen S, Mehta K, Moody-Ayers S, Bacchetti P, O’Hare AM: Geography matters: Relationships among urban residential segregation, dialysis facilities, and patient outcomes. Ann Intern Med 146: 493–501, 2007 [DOI] [PubMed] [Google Scholar]
- 11.Gaskin DJ, Price A, Brandon DT, Laveist TA: Segregation and disparities in health services use. Med Care Res Rev 66: 578–589, 2009 [DOI] [PMC free article] [PubMed] [Google Scholar]
- 12.Kaplan GA, Pamuk ER, Lynch JW, Cohen RD, Balfour JL: Inequality in income and mortality in the United States: analysis of mortality and potential pathways. BMJ 312: 999–1003, 1996 [DOI] [PMC free article] [PubMed] [Google Scholar]
- 13.Kennedy BP, Kawachi I, Prothrow-Stith D: Income distribution and mortality: Cross sectional ecological study of the Robin Hood index in the United States. BMJ 312: 1004–1007, 1996 [DOI] [PMC free article] [PubMed] [Google Scholar]
- 14.Gornick ME, Eggers PW, Reilly TW, Mentnech RM, Fitterman LK, Kucken LE, Vladeck BC: Effects of race and income on mortality and use of services among Medicare beneficiaries. N Engl J Med 335: 791–799, 1996 [DOI] [PubMed] [Google Scholar]
- 15.Levine RS, Foster JE, Fullilove RE, Fullilove MT, Briggs NC, Hull PC, Husaini BA, Hennekens CH: Black-white inequalities in mortality and life expectancy, 1933-1999: Implications for healthy people 2010. Public Health Rep 116: 474–483, 2001 [DOI] [PMC free article] [PubMed] [Google Scholar]
- 16.Robinson BM, Joffe MM, Pisoni RL, Port FK, Feldman HI: Revisiting survival differences by race and ethnicity among hemodialysis patients: The Dialysis Outcomes and Practice Patterns Study. J Am Soc Nephrol 17: 2910–2918, 2006 [DOI] [PubMed] [Google Scholar]
- 17.Perneger TV, Whelton PK, Klag MJ: Race and end-stage renal disease. Socioeconomic status and access to health care as mediating factors. Arch Intern Med 155: 1201–1208, 1995 [PubMed] [Google Scholar]
- 18.Young EW, Mauger EA, Jiang KH, Port FK, Wolfe RA: Socioeconomic status and end-stage renal disease in the United States. Kidney Int 45: 907–911, 1994 [DOI] [PubMed] [Google Scholar]
- 19.Eisenstein EL, Sun JL, Anstrom KJ, Stafford JA, Szczech LA, Muhlbaier LH, Mark DB: Do income level and race influence survival in patients receiving hemodialysis? Am J Med 122: 170–180, 2009 [DOI] [PubMed] [Google Scholar]
- 20.U.S. Renal Data System. Available at: http://www.usrds.org Accessed December 20, 2012
- 21.Kimmel PL, Peterson RA, Weihs KL, Simmens SJ, Alleyne S, Cruz I, Veis JH: Psychosocial factors, behavioral compliance and survival in urban hemodialysis patients. Kidney Int 54: 245–254, 1998 [DOI] [PubMed] [Google Scholar]
- 22.Cukor D, Cohen SD, Peterson RA, Kimmel PL: Psychosocial aspects of chronic disease: ESRD as a paradigmatic illness. J Am Soc Nephrol 18: 3042–3055, 2007 [DOI] [PubMed] [Google Scholar]
- 23.Mapes DL, Bragg-Gresham JL, Bommer J, Fukuhara S, McKevitt P, Wikström B, Lopes AA: Health-related quality of life in the Dialysis Outcomes and Practice Patterns Study (DOPPS). Am J Kidney Dis 44[Suppl 2]: 54–60, 2004 [DOI] [PubMed] [Google Scholar]
- 24.Cukor D, Kimmel PL: Education and end of life in chronic kidney disease: Disparities in black and white. Clin J Am Soc Nephrol 5: 163–166, 2010 [DOI] [PubMed] [Google Scholar]
- 25.Ren XS, Amick BC, Williams DR: Racial/ethnic disparities in health: The interplay between discrimination and socioeconomic status. Ethn Dis 9: 151–165, 1999 [PubMed] [Google Scholar]
- 26.Boulware LE, Cooper LA, Ratner LE, LaVeist TA, Powe NR: Race and trust in the health care system. Public Health Rep 118: 358–365, 2003 [DOI] [PMC free article] [PubMed] [Google Scholar]
- 27.Cooper-Patrick L, Gallo JJ, Gonzales JJ, Vu HT, Powe NR, Nelson C, Ford DE: Race, gender, and partnership in the patient-physician relationship. JAMA 282: 583–589, 1999 [DOI] [PubMed] [Google Scholar]
- 28.Kovac JA, Patel SS, Peterson RA, Kimmel PL: Patient satisfaction with care and behavioral compliance in end-stage renal disease patients treated with hemodialysis. Am J Kidney Dis 39: 1236–1244, 2002 [DOI] [PubMed] [Google Scholar]
- 29.Bleyer AJ, Hylander B, Sudo H, Nomoto Y, de la Torre E, Chen RA, Burkart JM: An international study of patient compliance with hemodialysis. JAMA 281: 1211–1213, 1999 [DOI] [PubMed] [Google Scholar]
- 30.Salem M: Hypertension in the hemodialysis population? High time for answers. Am J Kidney Dis 33: 592–594, 1999 [DOI] [PubMed] [Google Scholar]
- 31.Wilkinson RG: Income distribution and life expectancy. BMJ 304: 165–168, 1992 [DOI] [PMC free article] [PubMed] [Google Scholar]
- 32.LaVeist TA: Racial segregation and longevity among African Americans: an individual-level analysis. Health Serv Res 38: 1719–1733, 2003 [DOI] [PMC free article] [PubMed] [Google Scholar]
- 33.Iceland J, Sharp G, Timberlake JM: Sun belt rising: regional population change and the decline in black residential segregation, 1970-2009 [published online ahead of print September 11, 2012]. Demography doi:10.1007/s13524-012-0136-6 [DOI] [PMC free article] [PubMed] [Google Scholar]
- 34.Moore LV, Diez Roux AV: Associations of neighborhood characteristics with the location and type of food stores. Am J Public Health 96: 325–331, 2006 [DOI] [PMC free article] [PubMed] [Google Scholar]
- 35.McAdoo HP: Transgenerational patterns of upward mobility in African-American families. In: Black Families, edited by McAdoo HP, 2nd Ed., Newbury Park, CA, Sage Publications, Inc, 1988 [Google Scholar]
- 36.Burkey ML: Gini Coefficients for the 2000 Census. Available at: http://www.ncat.edu/~burkeym/Gini.htm Accessed October 17, 2011
- 37.De Maio FG: Income inequality measures. J Epidemiol Community Health 61: 849–852, 2007 [DOI] [PMC free article] [PubMed] [Google Scholar]
- 38.Kramer MR, Hogue CR: Is segregation bad for your health? Epidemiol Rev 31: 178–194, 2009 [DOI] [PMC free article] [PubMed] [Google Scholar]
- 39.Racial Residential Segregation Measurement Project: Available at: http://enceladus.icpsr.umich.edu/race/racestart.asp Accessed June 27, 2012
- 40.Rural-Urban Continuum Codes: Available at: http://www.ers.usda.gov/data-products/rural-urban-continuum-codes.aspx Accessed October 5, 2012