

Abstract
The signals that drive fibrogenesis after an initiating insult to the kidney are incompletely understood. Here, we report that renal nerve stimulation after ureteral obstruction is the primary profibrotic signal and that renal denervation prevents both fibrogenesis and the inflammatory cascade. Local infusion of neural factors, norepinephrine, and calcitonin gene-related peptide (CGRP) in denervated kidneys mimicked the fibrotic response observed in innervated obstructed kidneys. Norepinephrine and CGRP act through the α2-adrenergic receptor and CGRP receptor, respectively, because blocking these receptors prevented fibrosis, the inflammatory response, and tubular cell death. In tubular epithelial cells, both norepinephrine and CGRP induced apoptosis and the release of profibrotic factors capable of stimulating the differentiation of fibroblasts to myofibroblasts. In conclusion, these data suggest that nerve-derived signaling molecules may drive renal fibrosis and that their suppression may be a therapeutic approach to fibrosis prevention.
Fibrosis is responsible for chronic tissue injury in various organs. The histopathology of tubulointerstitial fibrosis in CKD is characterized by loss of tubular cells, influx of leukocytes, and deposition of extracellular matrix consequent to myofibroblast accumulation.1,2 During renal fibrosis, the tubular cell loss occurs mainly via apoptotic cell death.3 The injured tubular cells release cytokines that generate inflammatory and fibrotic responses.3 Although fibrogenesis is the final common pathway that leads to ESRD, there is little information available regarding the primary signals that drive fibrogenesis. Several profibrogenic factors, including TGF-β and connective tissue growth factor (CTGF), are well established inducers of fibrosis via stimulation of myofibroblast differentiation and extracellular matrix production in multiple organs.4–6 These factors are upregulated in both tubular and tubulointerstitial cells after kidney injury, resulting in kidney fibrogenesis;7,8 however, the primary signaling stimuli that induce the generation of profibrogenic factors in the injured tissue have not been identified.
Sympathetic efferent and primary sensory nerves are key players in the regulation of peripheral inflammation and the immune response.9 During tissue injury, neuropeptides are released by tissue peripheral nerve terminals and have local functions, such as neurogenic inflammation.10 Although renal sympathetic and sensory nerves are important effectors of renal dysfunction in CKD,11,12 their role in the development of renal injury and tubulointerstitial fibrosis remains poorly defined. The kidney is innervated by efferent sympathetic nerves as well as peptidergic sensory afferent nerves, in which several neuroactive substances have been identified.13 Given the pronounced effect of the renal nerves on CKD, we sought to determine whether afferent and efferent nerve-derived neuropeptides/neurotransmitters and their signaling pathways are responsible for the fibrotic and inflammatory responses in CKD.
Results
Renal Denervation Prevents Fibrogenesis and Inflammation
We confirmed that renal denervation eliminated tyrosine hydroxylase (TH)–positive sympathetic nerve fibers and calcitonin gene-related peptide (CGRP)–positive sensory nerve fibers in adventitia of intrarenal arteries (Figure 1A). Furthermore, renal denervation markedly decreased TH expression, norepinephrine, and CGRP levels in mouse whole kidneys (Figure 1, B–D). To determine the effect of renal denervation on renal fibrosis, we performed unilateral ureteral obstruction (UUO) after renal denervation. Intact UUO kidneys showed a time-dependent increase of collagen deposition as measured by Sirius red–positive area and hydroxyproline level, whereas renal denervation markedly reduced collagen deposition during UUO (Figure 1, E–G). Immunohistochemistry demonstrated that tubulointerstitial expression of α-smooth muscle actin (α-SMA) was diminished by renal denervation compared with that in intact UUO kidneys (Figure 1, H and I). The denervated kidneys also reduced expressions of profibrotic proteins, including α-SMA, fibronectin, TGF-β, and phosphorylated Smad3 (p-Smad3) during UUO (Figure 1J and Supplemental Figure 1A). Infiltration of polymorphonuclear neutrophil (PMN)–positive neutrophils and F4/80-positive macrophages was increased after UUO in intact kidneys, whereas renal denervation inhibited the infiltration of neutrophils and macrophages (Figure 1, K–M). In addition, denervated kidneys showed decreased expression of proinflammatory factors, including intercellular adhesion molecule-1 (ICAM-1), TNF-α, IL-1β, IL-6, monocyte chemotactic protein-1 (MCP-1), KC, interferon γ–inducible protein of 10 kDa (IP-10), and toll-like receptor 4 (TLR4) during UUO, compared with that in intact kidneys (Figure 1N and Supplemental Figure 1B). However, renal denervation after UUO was not renoprotective against fibrosis and inflammation (Supplemental Figure 1, C and D). These data suggest that renal nerve activation is required to instigate fibrogenesis, but it may not play a significant role during the progression of the injury.
Figure 1.

Renal denervation (DNx) prevents tubulointerstitial fibrogenesis and inflammation during UUO. Renal denervation in left kidneys of male 129S1/SvImJ mice aged 8–10 weeks was carried out; 2 days after the onset, the left ureters were obstructed for 3 or 10 days. (A) Immunohistochemistry of TH and CGRP in renal denervation or intact kidneys (n=4 in each group). (B) TH expression in renal denervation or intact kidneys using Western blot analysis (n=4 in each group). (C and D) Norepinephrine (NE) and CGRP protein level in renal denervation or intact kidneys using ELISA. (E–G) Collagen deposition using Sirius red staining (E and F) and hydroxyproline measurement (G) after UUO or sham operation in renal denervation or intact kidneys (n=4 in each sham-group, n=6 in each UUO-group). (F) The Sirius red–positive area was measured in five randomly chosen high-power (×200) fields per kidney using NIH ImageJ software. (H and I) Immunohistochemistry of α-SMA in UUO or sham kidneys after renal denervation or intact kidneys (n=4 in each sham group, n=6 in each UUO group). The visible blue color indicates nuclei stained by DAPI. (I) The α-SMA–positive area was measured in five randomly chosen high-power (×200) fields per kidney using NIH ImageJ software. (J) α-SMA, fibronectin, TGF-β, and p-Smad3 expression using Western blot analysis in UUO or sham kidneys after renal denervation or intact kidneys (n=4 in each sham group, n=6 in each UUO group). Anti–β-actin antibody served as a loading control. (K–M) Immunohistochemistry of PMN and F4/80 in UUO or sham kidneys after renal denervation or intact kidneys. (L) The number of PMN-positive neutrophil was counted in five randomly chosen high-power (×200) fields per kidney (n=4 in each sham group, n=6 in each UUO group). (M) The F4/80-positive area was measured in five randomly chosen high-power (×200) fields per kidney using NIH ImageJ software (n=4 in each group). (N) ICAM-1, TNF-α, IL-1β, IL-6, MCP-1, KC, IP-10, and TLR4 expression using Western blot analysis in UUO or sham kidneys after renal denervation or intact kidneys (n=4 in each sham group, n=6 in each UUO group). Anti–β-actin antibody served as a loading control. Scale bars, 50 μm. *P<0.05, **P<0.01, ***P<0.001 versus intact kidneys. Error bars represent SDs.
Norepinephrine and CGRP Contribute to Fibrosis and Inflammation
To identify neurotransmitters that contribute to renal fibrosis, we treated denervated kidneys with exogenous norepinephrine, neuropeptide Y (NY), CGRP, or substance P. Ten days after UUO, the denervated kidneys treated with either norepinephrine or CGRP showed a dose-dependent induction of collagen deposition; however, the collagen deposition was unaltered by NY and substance P (Figure 2A and Supplemental Figure 2A). The α-SMA–positive area, α-SMA expression, and p-Smad3 level were also increased by norepinephrine or CGRP treatment of denervated UUO kidneys (Figure 2, B and C, and Supplemental Figure 3B). Treatment of renal denervation kidney with norepinephrine or CGRP, but not NY or substance P, led to neutrophil and macrophage infiltration after UUO (Figure 2D). The expression of ICAM-1 and TNF-α was also increased by norepinephrine or CGRP in denervated UUO kidneys (Figure 2E and Supplemental Figure 2C). In contralateral uninjected kidneys, however, neurotransmitters had no effect on fibrosis (Supplemental Figure 2D).
Figure 2.

Norepinephrine and CGRP contribute to kidney fibrosis and inflammation during UUO. Renal denervation (DNx) in left kidneys of male 129S1/SvImJ mice aged 8–10 weeks was carried out; 2 days after the onset, norepinephrine (NE), NY, CGRP, or substance P (SP) (0, 1.2, 6, or 30 ng/kg per day) was continuously infused into kidneys via a mini-osmotic pump, and the left ureters were obstructed for 10 days. (A) Norepinephrine- and CGRP-induced collagen deposition using Sirius red staining in denervated UUO kidneys. The Sirius red–positive area was measured in five randomly chosen high-power (×200) fields per kidney using NIH ImageJ software. (B) Immunohistochemistry of α-SMA in denervated UUO kidneys after treatment. The visible blue color indicates nuclei stained by DAPI. The α-SMA–positive area was measured in five randomly chosen high-power (×200) fields per kidney using NIH ImageJ software. (C) α-SMA and p-Smad3 expression in norepinephrine- or CGRP-treated UUO kidneys using Western blot analysis. Anti–β-actin antibody served as a loading control. (D) Immunohistochemistry of PMN and F4/80 in norepinephrine- or CGRP-treated UUO kidneys. The number of PMN-positive neutrophils and the area of F4/80-positive macrophages were evaluated in five randomly chosen high-power (×200) fields per kidney. (E) ICAM-1 and TNF-α expression using Western blot analysis. Anti–β-actin antibody served as a loading control. n=6 in each group. Scale bar, 50 μm. *P<0.05, **P<0.01, ***P<0.001 versus 0 ng/kg per day. Error bars represent SDs.
Norepinephrine and CGRP Induce Caspase-Dependent Tubular Cell Death
In innervated kidneys, the norepinephrine level was not changed by UUO, but the CGRP level was significantly increased 1–24 hours after UUO (Figure 3A). Renal denervation persistently suppressed renal levels of norepinephrine and CGRP during UUO (Figure 3A). Twenty-four hours after UUO, immunohistochemical localization revealed CGRP present at the apical and basolateral membranes of epithelial cells in dilated or tubules positive on terminal deoxynucleotidyl transferase–mediated digoxigenin-deoxyuridine nick-end labeling (TUNEL), as well as on nerve fibers in the adventitia of intrarenal arteries (Figure 3B). To assess whether neuropeptides/neurotransmitters are involved in the tubular cell death, we assessed histologic damage and apoptosis. Renal denervation lessened the histologic damage score based on periodic acid-Schiff (PAS) staining and the number of apoptotic cells assessed by TUNEL staining during UUO, compared with intact kidneys (Supplemental Figure 3, A and B). Additionally, renal denervation abolished the UUO-induced increase in expression of full-length poly(ADP-ribose) polymerase 1 (PARP1), an indicator of necrosis,14 as well as the expression of cleaved PARP1 and cleaved caspase-3, markers of apoptosis (Supplemental Figure 3C). In denervated kidneys, the treatment with norepinephrine or CGRP, but not NY or substance P, evoked significant histologic damage and TUNEL-positive apoptotic cell death at 10 days after UUO (Figure 3C). In UUO kidneys without renal denervation, treatment with norepinephrine or CGRP aggravated tubular dilation and TUNEL-positive apoptosis (Supplemental Figure 3D). Consistent with the data of histologic damage and TUNEL assay, exogenous norepinephrine or CGRP increased the expression of PARP1, cleaved PARP1, and cleaved caspase-3 in denervated UUO kidneys (Figure 3D). Infusion of norepinephrine or CGRP, however, had no effect on systolic BP, indicating that the UUO injury in renal denervation kidneys treated with norepinephrine or CGRP is not a consequence of hemodynamic alterations (Supplemental Figure 3E).
Figure 3.

Norepinephrine (NE) and CGRP contribute to tubular cell death in UUO kidneys. (A and B) Renal denervation (DNx) or intact in left kidneys of male 129S1/SvImJ mice aged 8–10 weeks was carried out; 2 days after the onset, the left ureters were obstructed for 0, 1, 3, 6, 12, 24, 72, or 240 hours. (A) The kidney norepinephrine and CGRP protein levels after UUO using ELISA (n=6 in each group). **P<0.01 versus 0 hours, ##P<0.01 versus intact kidneys. (B) Immunohistochemistry of CGRP and TUNEL assay of apoptotic cells in UUO kidneys after renal denervation or intact kidneys (n=6 in each group). The visible blue color indicates nuclei stained by DAPI. (C and D) Renal denervation in left kidneys of male 129S1/SvImJ mice aged 8–10 weeks was carried out; 2 days after the onset, norepinephrine, NY, CGRP, substance P (SP) (30 ng/kg per day), or vehicle (0.9% saline) was continuously infused into kidneys via a mini-osmotic pump, and the left ureters were obstructed for 10 d (n=6 in each group). (C) Kidneys were fixed for PAS staining to measure the histologic damage in tubules. TUNEL assay to detect apoptotic cells was done using In Situ Cell Death Detection kit. The visible blue color indicates nuclei stained by DAPI. The number of TUNEL-positive apoptotic cells in tubules was counted in five randomly chosen high-power (×200) fields per kidney. *P<0.05, **P<0.01 versus vehicle. (D) PARP1, cleaved PARP1, and cleaved caspase-3 expression using Western blot analysis. Anti–β-actin antibody served as a loading control. *P<0.05, **P<0.01 versus vehicle. (E–G) MCT cells were maintained in DMEM/high-glucose medium containing 10% FBS at 37°C with 5% CO2. The cells were grown until 70% confluence on culture plates and then changed to serum-free medium. After serum starvation for 6 hours, norepinephrine or CGRP was incubated to the culture at a final concentration of 1 nM in PBS (vehicle) (n=4 in each group). A pan-caspase inhibitor Q-VD-OPH was also added at the same time at a final concentration of 20 μM in DMSO (n=4 in each group). (E) TUNEL and PI staining in MCT cells treated with norepinephrine, CGRP, or vehicle. The visible blue color indicates nuclei stained by DAPI. The number of TUNEL-positive apoptotic or PI-positive necrotic cells was counted in five randomly chosen high-power (×200) fields per plate. *P<0.05, **P<0.01, ***P<0.001 versus vehicle. (F) PARP1, cleaved PARP1, and cleaved caspase-3 expression in MCT cells treated with norepinephrine, CGRP, or vehicle using Western blot analysis. Anti–β-actin antibody served as a loading control. **P<0.01, ***P<0.001 versus vehicle. (G) The number of TUNEL-positive apoptotic or PI-positive necrotic cells cotreated with Q-VD-OPh plus norepinephrine, CGRP, or vehicle was counted in five randomly chosen high-power (×200) fields per plate. **P<0.01, ***P<0.001 versus DMSO. Scale bar, 50 μm. Error bars represent SDs.
The in vivo data on the role of norepinephrine and CGRP in tubular cell death are complemented by our studies in mouse renal proximal tubular (MCT) cells.15 Treatment with norepinephrine or CGRP time-dependently induced both TUNEL-positive apoptotic cell death and propidium iodide (PI)–positive necrotic cell death; however, the increase in the number of TUNEL-positive cells occurred earlier than did the increase in the number of PI-positive cells (Figure 3E). Cleaved PARP1 and cleaved caspase-3 levels were also increased by norepinephrine or CGRP treatment, but PARP1 expression was not significantly altered (Figure 3F). Cotreatment with pan-caspase inhibitor significantly attenuated both TUNEL-positive apoptotic and PI-positive necrotic cell death induced by norepinephrine or CGRP (Figure 3G), indicating secondary necrosis induced by norepinephrine and CGRP.
Norepinephrine and CGRP Upregulate Profibrogenic Growth Factors in Tubular Cells
Next, we tested whether norepinephrine- or CGRP-treated tubular cells can produce profibrogenic factors. The treatment with norepinephrine or CGRP for 48 hours significantly induced the expression of TGF-β, CTGF, and fibronectin in tubular cells, but not p-Smad3 and α-SMA expression (Figure 4A). TGF-β1 and CTGF levels in the incubation media were elevated after 48-hour exposure to norepinephrine or CGRP, indicating release of these proteins from the cells (Figure 4B). To determine whether norepinephrine- or CGRP-induced release of profibrogenic factors from tubular cells induces differentiation of interstitial fibroblasts, we isolated conditioned medium from the tubular cell culture and treated rat kidney interstitial fibroblasts (NRK-49F) with the conditioned medium. Exposure to the conditioned medium from norepinephrine- or CGRP-treated tubular cells significantly induced α-SMA and p-Smad3 protein levels in interstitial fibroblasts (Figure 4C).
Figure 4.
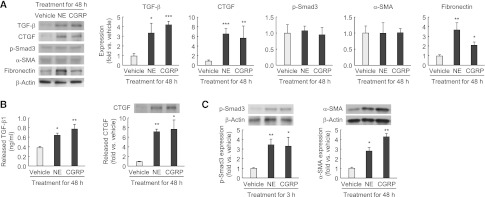
Norepinephrine (NE) and CGRP upregulate TGF-β and CTGF in tubule epithelial cells. (A and B) MCT cells were grown until 70% confluence on culture plates and then changed to serum-free medium. After serum starvation for 6 hours, norepinephrine or CGRP was incubated to the culture at a final concentration of 1 nM in PBS (vehicle) for 48 hours (n=4 in each group). (A) TGF-β, CTGF, p-Smad3, α-SMA, and fibronectin expression in MCT cells treated with norepinephrine, CGRP, or vehicle using Western blot analysis. Anti–β-actin antibody served as a loading control. (B) The released level of TGF-β1 and CTGF in the supernatant of MCT cells treated with norepinephrine, CGRP, or vehicle for 48 hours using ELISA and Western blot analysis, respectively. (C) After 6 hours of treatment with norepinephrine, CGRP, or vehicle in MCT cells, the culture plate was washed using PBS, changed to serum-free media, and continued for 48 hours. The conditioned medium was then collected and added to normal rat kidney interstitial fibroblast NRK-49F cells starved for 24 hours. Shown is expression of p-Smad3 and α-SMA protein in MCT cells incubated for 48 hours with the conditioned medium from norepinephrine-, CGRP- or vehicle-treated MCT cells using Western blot analysis (n=4 in each group). Anti–β-actin antibody served as a loading control. *P<0.05, **P<0.01, ***P<0.001 versus vehicle. Error bars represent SDs.
α2-Adrenergic Receptor Is Responsible for Norepinephrine-Mediated Fibrosis, Inflammation, and Tubular Cell Death
To determine the role of adrenergic receptor (AR) in norepinephrine-mediated tubulointerstitial fibrosis, we treated mice undergoing UUO with a panel of AR-subtype selective antagonists. Ten days after UUO, mice treated with α2-AR subtype antagonists displayed significantly reduced Sirius red–positive area, hydroxyproline content, α-SMA–positive area, and α-SMA and p-Smad3 expression in whole kidneys, whereas treatment with α1and β-AR antagonists yielded no protective effects (Figure 5, A–F, and Supplemental Figure 4A). The treatment with α2-AR antagonists also decreased the influx of PMN-positive neutrophils and the levels of ICAM-1, TNF-α, MCP-1, and KC protein expression in UUO kidneys (Figure 5, G–I, and Supplemental Figure 4A). In addition, the histologic damage score on PAS-stained sections and the number of apoptotic cells on TUNEL-stained sections were decreased in UUO kidneys treated with α2-AR antagonists (Figure 6, A–D). Consistent with the data of histologic damage and apoptosis, treatment with α2-AR antagonists diminished the expression of PARP1, cleaved PARP1, and cleaved caspase-3 proteins in UUO kidneys (Supplemental Figure 4B). Treatment with α2A- or α2C-AR antagonist was more protective than α2B-AR antagonist (Figures 5 and 6). Norepinephrine levels in kidneys from mice treated with α2-AR antagonists were not altered (Supplemental Figure 4C). Furthermore, α2-ARs were upregulated and expressed on tubular cells in UUO kidneys (Figure 6, E–G). In cultured renal tubular cells, exogenous norepinephrine-induced TUNEL-positive apoptotic and PI-positive necrotic cell death was also reduced after treatment with α2A-, α2B-, and α2C-AR antagonists (Supplemental Figure 5A). Furthermore, the tubular cells secreted less TGF-β1 and CTGF protein after treatment with α2A- or α2C-AR antagonists, but not α2B-AR antagonist (Supplemental Figure 5B).
Figure 5.

α2-AR antagonists reduce tubulointerstitial fibrosis and inflammation after UUO. Male 129S1/SvImJ mice aged 8–10 weeks was continuously treated with doxazosin (α1-AR antagonist, 12 mg/kg per day), atipamezole (α2-AR antagonist, 2.4 mg/kg per day), metoprolol (β1-AR antagonist, 12 mg/kg per day), ICI118551 (β2-AR antagonist, 2.4 mg/kg per day), L748337 (β3-AR antagonist, 2.4 mg/kg per day), BRL44408 (α2A-AR antagonist, 12 mg/kg per day), imiloxan (α2B-AR antagonist, 12 mg/kg per day), spiroxatrine (α2C-AR antagonist, 12 mg/kg per day), or vehicle (10% DMSO in PBS) via an intraperitoneal implantation of a mini-osmotic pump 24 hours before UUO (n=5). (A–C) Kidney collagen deposition was evaluated by Sirius red staining (A and B) and hydroxyproline measurement (C) in UUO kidneys treated with AR antagonists. (B) The Sirius red–positive area was measured in five randomly chosen high-power (×200) fields per kidney using NIH ImageJ software. (D) α-SMA expression using immunohistochemistry in UUO kidneys treated with AR antagonists. The visible blue color indicates nuclei stained by DAPI. (E) The α-SMA–positive area was measured in five randomly chosen high-power (×200) fields per kidney using NIH ImageJ software. (F) α-SMA and p-Smad3 expression in UUO kidneys treated with AR antagonists using Western blot analysis. Anti–β-actin antibody served as a loading control. (G) Immunohistochemistry of PMN in UUO kidneys treated with AR antagonists. (H) The number of PMN-positive neutrophil was counted in five randomly chosen high-power (×200) fields per kidney. (I) ICAM-1, TNF-α, MCP-1, and KC expression in UUO kidneys treated with AR antagonists using Western blot analysis. Anti–β-actin antibody served as a loading control. Scale bar, 50 μm. *P<0.05, **P<0.01, ***P<0.001 versus vehicle; #P<0.05 versus imiloxan. Error bars represent SDs.
Figure 6.

α2-AR antagonists reduce tubular cell death and are upregulated after UUO. (A–D) Male 129S1/SvImJ mice aged 8–10 weeks were continuously treated with doxazosin (α1-AR antagonist, 12 mg/kg per day), atipamezole (α2-AR antagonist, 2.4 mg/kg per day), metoprolol (β1-AR antagonist, 12 mg/kg per day), ICI118551 (β2-AR antagonist, 2.4 mg/kg per day), L748337 (β3-AR antagonist, 2.4 mg/kg per day), BRL44408 (α2A-AR antagonist, 12 mg/kg per day), imiloxan (α2B-AR antagonist, 12 mg/kg per day), spiroxatrine (α2C-AR antagonist, 12 mg/kg per day), or vehicle (10% DMSO in PBS) via an intraperitoneal implantation of a mini-osmotic pump 24 hours before UUO (n=5). (A) Histologic damage indicated by PAS staining in UUO kidneys treated with AR antagonists. (B) The histologic damage was scored by counting the percentage of tubules. *P<0.05, **P<0.01 versus vehicle; #P<0.05 versus imiloxan. (C) TUNEL assay to detect apoptotic cells in UUO kidneys treated with AR antagonists using In Situ Cell Death Detection kit. The visible blue color indicates nuclei stained by DAPI. (D) The number of TUNEL-positive apoptotic cells in tubules was counted in five randomly chosen high-power (×200) fields per kidney. *P<0.05, **P<0.01 versus vehicle; #P<0.05 versus imiloxan. (E–G) Left ureters of male 129S1/SvImJ mice aged 8–10 weeks were obstructed for 0, 1, 3, or 10 days (n=4). (E and F) α2A-AR, α2B-AR, and α2C-AR expression using Western blot analysis. Anti–β-actin antibody served as a loading control. *P<0.05, **P<0.01 versus 0 days. (G) Immunohistochemistry of α2A-AR, α2B-AR, and α2C-AR in UUO or sham kidneys. Scale bar, 50 μm. Error bars represent SDs.
CGRP Receptor Is Responsible for CGRP-Mediated Fibrosis, Inflammation, and Tubular Cell Death
To determine whether CGRP-mediated tubulointerstitial fibrosis is dependent on its receptor, we used a specific CGRP receptor antagonist. CGRP receptor antagonist treatment markedly inhibited collagen deposition in mouse kidneys after 10 days of UUO, as shown by reduced Sirius red–positive area and hydroxyproline content (Figure 7, A and B). The α-SMA–positive area was significantly reduced in CGRP receptor antagonist–treated kidneys after UUO, compared with that in vehicle-treated UUO kidneys (Figure 7C). The α-SMA and p-Smad3 expression was also lessened by treatment with CGRP receptor antagonist (Figure 7D). UUO kidneys treated with the CGRP antagonist also showed reduction in proinflammatory responses, as demonstrated by decreased PMN-positive neutrophil influx into kidney, ICAM-1, and TNF-α expression (Figure 7, E and F). Additionally, the CGRP receptor antagonist treatment significantly diminished induced histologic damage assessed from PAS-stained sections and TUNEL-positive apoptotic cell death in UUO kidneys (Figure 7G). The effects of UUO on PARP1, cleaved PARP1, and cleaved caspase-3 protein levels were reduced by CGRP receptor antagonist treatment (Figure 7H). In tubular cell culture, the treatment with the CGRP receptor antagonist reduced the percentages of TUNEL-positive apoptotic and PI-positive necrotic cell death (Supplemental Figure 5C). Furthermore, the CGRP receptor antagonist reduced the release of TGF-β1 and CTGF protein from CGRP-treated tubular cells (Supplemental Figure 5D).
Figure 7.

CGRP inhibition reduces tubulointerstitial fibrosis, inflammation, and tubular cell death during UUO. Male 129S1/SvImJ mice aged 8–10 weeks were given a CGRP receptor antagonist (CGRP8–37 or C8–37; 120 μg/kg per day) or 0.9% saline (vehicle) via an intraperitoneal implantation of the mini-osmotic pump from 24 hours before UUO or sham operation (n=5). (A and B) Collagen deposition was evaluated by Sirius red staining (A) and hydroxyproline measurement (B) in UUO kidneys treated with CGRP receptor antagonist or vehicle. (C) α-SMA expression in UUO kidneys treated with CGRP receptor antagonist or vehicle using immunohistochemistry. The visible blue color indicates nuclei stained by DAPI. (D) α-SMA and p-Smad3 expression using Western blot analysis. Anti–β-actin antibody served as a loading control. (E) Immunohistochemistry of PMN in UUO kidneys treated with CGRP receptor antagonist or vehicle. (F) ICAM-1 and TNF-α expression in UUO kidneys treated with CGRP receptor antagonist or vehicle using Western blot analysis. Anti–β-actin antibody served as a loading control. (G) Histologic damage in UUO kidneys treated with CGRP receptor antagonist or vehicle indicated by PAS staining. TUNEL assay in UUO kidneys treated with CGRP receptor antagonist or vehicle using In Situ Cell Death Detection kit. The visible blue color indicates nuclei stained by DAPI. (H) PARP1, cleaved PARP1, and cleaved caspase-3 expression in UUO kidneys treated with CGRP receptor antagonist or vehicle using Western blot analysis. Anti–β-actin antibody served as a loading control. Scale bar, 50 μm. *P<0.05, **P<0.01, ***P<0.001 versus vehicle. Error bars represent SDs.
Discussion
Interstitial fibrosis is the hallmark of CKD regardless of its cause.1 During the past two decades, causative roles for inflammation, fibroblast activation, tubular and microvascular injury, and apoptosis have been established in the development of tubulointerstitial fibrogenesis.16 Several molecules are implicated in the progression of renal fibrosis, including various cytokines, chemokines, angiogenic factors, and growth factors and the renin-angiotensin system.1,17 These molecular responses and signaling events indicate the importance of a cytokine milieu and an inflammatory cascade, including infiltration of leukocytes during fibrogenesis. Despite these great strides, there remains a gap in the our understanding of the processes that induce these myriad signaling events after an initial insult to the kidney.18 Therefore, identification of the primary signal or the core signaling pathway that instigate renal fibrogenesis after an initial stimulus is essential for better understanding of the syndrome and in developing effective therapeutic strategies for preventing, reversing, or limiting progression of fibrogenesis.19
In cultured renal tubular cells, presence of CGRP or norepinephrine induced the generation and release of TGF-β1 and CTGF. Furthermore, CGRP and norepinephrine induced the production of extracellular matrix, including fibronectin, but did not induce epithelial-mesenchymal transition because no expression of α-SMA or p-Smad3 was observed. One of the main mediators of fibronectin production is through TGF-β signaling;20 however, p-Smad3 was not induced by CGRP or norepinephrine in cultured renal proximal tubular cells, suggesting that autocrine signaling through TGF-β was not activated in renal tubular cells. Fibronectin can probably be produced by alternate pathways, such as activation of c-Jun N-terminal kinase signaling pathway.21 On the other hand, culturing of fibroblasts in the presence of the supernatants from CGRP- or norepinephrine-treated tubular cells induced myofibroblast differentiation via p-Smad3, suggesting that TGF-β induced by norepinephrine or CGRP in tubular epithelial cells triggers fibrosis by driving phosphorylation of Smad3 in adjacent fibroblasts.
Our data revealed that renal CGRP levels were increased soon after UUO, with maximal levels observed during the first day. CGRP protein was evident at apical or basolateral membranes of epithelial cells in dilated or TUNEL-positive tubules, as well as in sensory nerve fibers. Inhibition of CGRP receptor prevented injury, whereas long-term administration of CGRP in denervated UUO kidneys induced tubular cell apoptosis, inflammatory cascade, as well as fibrogenesis. In vitro, treatment of tubular cells with CGRP also induced apoptosis, suggesting that the mechanism by which CGRP induces apoptosis may be due to its direct effect in tubular cells and not due to indirect effects, such as fibrosis or inflammation. CGRP enhances apoptosis in thymocytes22 and inhibits apoptosis in retina cells,23 suggesting that CGRP-mediated apoptosis depends on cell types.
Sensory activity has been shown to be associated with inflammation.24 The autonomic nervous system has been implicated in acute and chronic inflammation of various organs.25,26 Because CGRP has potent vasodilator activity, it has long been considered to be involved in aggravation of inflammation by increasing the blood flow, the number of circulating cells, and chemotactic factors. This possibility is supported by in vitro data demonstrating that exposure of endothelial cells to CGRP increases the expression of adhesion molecules for binding to neutrophils.27 Consistent with this finding, our data demonstrate that CGRP induces ICAM-1 expression after UUO. Although the kidney encounters various immune-mediated diseases, such as GN, the role of neuroimmune interactions has not been well studied. Our data showed that inhibition of CGRP receptor prevented the expression of inflammatory molecules as well as infiltration of leukocytes into the renal parenchyma, suggesting that neuroimmune interactions can occur in UUO kidneys.
Afferent nerve activation due to an initial insult could activate renal efferent sympathoexcitation. Our data implicating norepinephrine signaling through upregulated α2-AR subtypes to induce fibrogenesis in UUO kidneys are intriguing because α2-AR subtypes were initially identified as feedback inhibitors of neurotransmitter release in adrenergic and other neurons.28 In the mouse heart-failure model, deletion of sympathoinhibitory α2-ARs results in increased norepinephrine levels, which elicit typical cardiovascular consequences, including aggressive remodeling of the left ventricle, cardiac hypertrophy, and fibrosis.29,30 Furthermore, α2A- and α2C-ARs seem to play essential roles in the prevention of heart failure progression. In contrast, our data indicate that activation of the α2-AR subtypes, especially α2A- and α2C-ARs, are detrimental in the progression of renal injury, inflammation, and fibrogenesis. Inhibition of α2-ARs with their antagonists had no effect on norepinephrine levels but decreased chemokine expression in the UUO kidney, suggesting a possible mechanism by which norepinephrine may promote leukocyte recruitment and inflammation. Further, activation of the α2-AR subtypes on tubular cells in the UUO kidney may trigger signaling events other than sympathoinhibition, such as activation of TGF-β and CTGF signaling pathways to instigate fibrogenesis. The reason for the inhibitory effects of multiple α2-AR subtypes on UUO injury measures is not clear. It has been shown that the α2C-AR can alter α2A-AR signaling by heterodimerization, with these complexes acting as a functional signaling unit in cells in which both subtypes are expressed. Further studies are needed to determine whether such heterodimerization, and the resulting signaling events, may explain the similar renoprotective effects of inhibiting α2A- or α2C-AR subtypes during UUO.
Elevated plasma norepinephrine is observed in patients with CKD and ESRD.31 In the present study, UUO did not significantly increase renal norepinephrine levels; however, inhibition of ARs prevented UUO-induced injury, whereas long-term administration of norepinephrine prompted injury in denervated UUO kidneys. Norepinephrine has previously been shown to induce apoptosis in neonatal cardiomyocytes through a reactive oxygen species/TNF-α/caspase signaling pathway.32 In our study, exogenous norepinephrine induced TNF-α and caspase activation via the α2-AR-mediated process. On the other hand, exogenous norepinephrine has been reported to induce proximal tubule necrotic cell death in dogs.33 Our in vivo data indicate that norepinephrine infusion increased PARP1 expression in the denervated kidney, supporting a possible explanation for the necrotic cell death observed after UUO. The signaling pathway by which norepinephrine induces apoptosis and necrosis was not delineated in this study and requires further investigation.
In conclusion, this study provides incontrovertible evidence that renal nerve activation is a primary mechanism instigating fibrogenesis in the UUO kidney. Our data implicate both renal afferent nerve–derived CGRP and efferent nerve–derived norepinephrine in triggering tubular damage, the inflammatory cascade, and fibrogenesis. Inhibiting the actions CGRP or norepinephrine, alone or in combination, might represent a novel effective therapeutic strategy to prevent or limit progression of renal fibrogenesis at its onset in CKD.
Concise Methods
Mice and Surgical Preparation
Male 129S1/SvImJ mice aged 8–10 weeks were purchased from Jackson Laboratories. All mouse experiments were performed in accordance with the animal protocols approved by the Institutional Animal Care and Use Committee of the University of Nebraska Medical Center. UUO was conducted as previously reported.14,34 Briefly, the mice were anesthetized with an intraperitoneal injection of a cocktail containing ketamine (200 mg/kg body weight) and xylazine (16 mg/kg body weight). After the left kidney was exposed through the left flank incision, the left ureter was ligated completely near the kidney pelvis using a 5-0 silk tie. Sham-operated mice underwent the same surgical procedure without the ureter ligation. Renal denervation was carried out 2 days before UUO or sham operation, as described previously.35 Briefly, the left kidney artery and vein were exposed through the abdominal incision and isolated from the surrounding connective tissue under anesthesia with ketamine and xylazine. For stripping the nerves, the kidney vessels were painted for 2 minutes with 95% ethanol and for 2 minutes with PBS. Intact mice underwent the same surgical procedure without stripping of the kidney nerves. For local treatment of neurotransmitters, norepinephrine (Sigma, St. Louis; 1.2, 6, or 30 ng/kg body weight per day), NY (R&D Systems, Minneapolis, MN; 1.2, 6, or 30 ng/kg body weight per day), CGRP (R&D Systems; 1.2, 6, or 30 ng/kg body weight per day), or substance P (R&D Systems; 1.2, 6, or 30 ng/kg body weight per day) was continuously infused into the cortical region of the denervated kidney via an intrathecal catheter attached to a mini-osmotic pump (Alzet, Palo Alto, CA) that was inserted at the same time as UUO. The catheter was anchored to the obstructed ureter, and the osmotic pump was placed toward the subcutaneous site. For treatment with respective antagonists of AR subtypes, doxazosin (R&D Systems, 12 mg/kg body weight per day) against α1-AR, atipamezole (R&D Systems, 2.4 mg/kg body weight per day) against α2-AR, metoprolol (R&D Systems, 12 mg/kg body weight per day) against β1-AR, ICI118551 (R&D Systems, 2.4 mg/kg body weight per day) against β2-AR, L748337 (R&D Systems, 2.4 mg/kg body weight per day) against β3-AR, BRL44408 (R&D Systems, 12 mg/kg body weight per day) against α2A-AR, imiloxan (R&D Systems, 12 mg/kg body weight per day) against α2B-AR, spiroxatrine (R&D Systems, 12 mg/kg body weight per day) against α2C-AR, or vehicle (10% DMSO in PBS) was intraperitoneally administered via the mini-osmotic pump (Alzet) beginning 24 hours before UUO. For inhibition of CGRP, mice were given CGRP8–37 (R&D Systems, 120 μg/kg body weight per day) or 0.9% saline via intraperitoneal implantation of the mini-osmotic pump (Alzet) beginning 24 hours before UUO or sham operation.
Collagen Deposition
Collagen deposition was assessed by both Sirius red staining and hydroxyproline assay as previously described.14 The area of positive Sirius red staining was measured in five randomly chosen high-power (×200) fields per kidney using National Institutes of Health (NIH) ImageJ software (http://rsb.info.nih.gov/ij/).
Kidney Norepinephrine and CGRP Levels
For measurement of kidney norepinephrine contents, the kidneys were homogenized using 1 mM EDTA and 4 mM sodium metabisulfite in 0.1 N HCl. After centrifugation of the homogenates, norepinephrine concentration in the supernatants was determined by ELISA (ALPCO Diagnostics, Windham, NH), as suggested by the manufacturer. For measurement of kidney CGRP contents, the kidneys were homogenized in 2 N acetic acid. The homogenates were then incubated at 90°C for 10 minutes and centrifuged. After extraction of the supernatants using solid phase extraction cartridges (Waters, Milford, MA), CGRP concentration in the samples was determined by ELISA (Cayman, Ann Arbor, MI) as suggested by the manufacturer.
Cell Culture and Treatment
MCT cells were maintained in RPMI-1640 medium (Gibco, Grand Island, NY) supplemented with 10% FBS (Invitrogen, Carlsbad, CA) at 37°C with 5% CO2. The cells were grown until 70% confluence on culture plates and then changed to serum-free medium. After serum starvation for 6 hours, norepinephrine or CGRP was incubated for 48 hours to the culture at a final concentration of 1 nM in PBS (vehicle). This concentration and time were chosen after TUNEL and PI staining in dose- and time-dependent experiments (0.1, 1, 10, or 100 nM norepinephrine or CGRP for 0, 1, 3, 6, 12, 24, or 48 hours). Pan-caspase inhibitor Q-VD-OPh (Sigma, final concentration of 20 μM in DMSO), α2A-AR antagonist BRL44408 (R&D System, final concentration of 10 μM in DMSO), α2B-AR antagonist imiloxan (R&D System, final concentration of 1 μM in DMSO), α2C-AR spiroxatrine (R&D System, final concentration of 100 nM in DMSO), or CGRP receptor antagonist CGRP8–37 (R&D System, final concentration of 100 nM in PBS) was also added at the same time of norepinephrine or CGRP treatment. This concentration was chosen after TUNEL and PI staining in dose-dependent experiments (10 or 100 nM and 1, 10, 20, or 50 μM). NRK-49F cells (American Type Culture Collection, Manassas, VA) were maintained in DMEM/F-12 medium supplemented with 10% FBS (Invitrogen) at 37°C with 5% CO2. After 6 hours of treatment with norepinephrine or CGRP in MCT cells at a final concentration of 1 nM in PBS (vehicle), the culture plate was washed using PBS, changed to serum-free media, and continued for 48 hours. The conditioned medium was then collected and added to NRK-49F cells starved for 24 hours. In the conditioned medium, norepinephrine and CGRP levels were not detected by ELISA (ALPCO Diagnostics and Cayman, respectively). The dose-dependent treatment (0.1, 1, 10, or 100 nM) with norepinephrine or CGRP alone did not change α-SMA expression in NRF-49F cells starved for 24 hours (data not shown). The released level of TGF-β1 and CTGF in the supernatant of MCT cells treated with norepinephrine, CGRP, or vehicle for 48 hours was examined by ELISA (BioLegend, San Diego, CA) and Western blot analysis, respectively.
Immunohistochemistry, Histology, TUNEL Assay
Immunohistochemical staining of the kidneys was performed on paraffin sections or cryosections as previously described.36–38 Briefly, 4% paraformaldehyde-fixed kidney sections were rehydrated and labeled with antibodies against TH (Abcam, Cambridge, MA), CGRP (Santa Cruz Biotechnology, Santa Cruz, CA), α-SMA (Sigma), F4/80 (Abcam), α2A-AR (Cell Applications, San Diego, CA), α2B-AR (Santa Cruz Biotechnology), α2C-AR (Santa Cruz Biotechnology), or PMN (Accurate, Westbury, NY). The sections were then incubated to fluorescein or peroxidase-conjugated secondary antibodies (Vector Laboratories, Burlingame, CA). The α-SMA–positive area was measured in five randomly chosen high-power (×200 magnification) fields per kidney using NIH Image J software. The number of PMN-positive cells was counted in five randomly chosen high-power (×200 magnification) fields per kidney. PAS-stained sections were used for histologic damage score as described previously.39 Histologic damage of tubular injury was scored by percentage of tubules that displayed tubular necrosis, cast formation, and tubular dilation as follows: 0 = normal, 1 = <10%, 2=10%–25%, 3=26%–50%, 4=51%–75%, and 5 = >75%. Ten randomly chosen high-power (×200 magnification) fields per kidney were used for the counting. TUNEL assay in the kidneys and cells was carried out using In Situ Cell Death Detection kit, Fluorescein (Roche, Mannheim, Germany), following the manufacturer’s protocol, as previously described.38 Norepinephrine- or CGRP-treated MCT cells were stained with 1 μg/ml PI for 10 minutes, and the percentage of PI-positive cells was counted by fluorescence microscopy.
Western Blot
We performed electrophoresis of protein extracts using tris-tricine or tris-glycine buffer systems, and subsequent blotting as described.39–41 Membranes were incubated with antibodies against TH (Abcam), α-SMA (Sigma), fibronectin (Cedarlane), TGF-β (Santa Cruz Biotechnology), p-Smad3 (Cell Signaling), ICAM-1 (Santa Cruz Biotechnology), TNF-α (Abcam), IL-1β (Abcam), IL-6 (Abcam), MCP-1 (Abcam), KC (Abcam), IP-10 (Abcam), α2A-AR (Cell Applications, San Diego, CA), α2B-AR (Santa Cruz Biotechnology), α2C-AR (Santa Cruz Biotechnology), or TLR4 (Imgenex, San Diego, CA). Peroxidase-conjugated secondary antibodies (Vector Laboratories) were applied, and a chemiluminescence reagent (PerkinElmer, Boston, MA) was used to detect proteins. Anti–β-actin antibody (Sigma) was used for loading controls on stripped membranes. The bands were quantified using Lab Works analysis software (Ultra-Violet Products, Cambridge, United Kingdom).
BP Measurement
Systolic BP of mice was measured by a noninvasive tail cuff method (CODA; Kent Scientific, Torrington, CT). Mice were placed on a heated platform (30°C) in an isolated chamber, and systolic BP levels were obtained. Mice were trained for 5 days before renal denervation followed by daily recording for experimental days as previously described.42,43
Statistical Analyses
ANOVA was used to compare data among groups. Differences between two groups were assessed by two-tailed unpaired or paired Student t test using SigmaPlot for Windows Version 12.0 (Systat Software, San Jose, CA). P values < 0.05 were considered to represent statistically significant differences.
Supplementary Material
Acknowledgments
The authors thank Dr. Irving H. Zucker (University of Nebraska Medical Center [UNMC]) for valuable discussions, Dr. Kaushik P. Patel (UNMC) for technical advice on kidney denervation surgery, and Dr. Pamela K. Carmines (UNMC) for editing the manuscript. The authors also thank Kelly E. Long (UNMC) for mouse care and Youngsu Cho (UNMC) for technical assistance with Western blot and cell culture.
B.J.P. is supported by a UNMC Deans fund, American Heart Association-Grant in Aid, Nebraska Research Initiative fund, and National Institutes of Health grants DK-083291 and DK-090332.
Footnotes
Published online ahead of print. Publication date available at www.jasn.org.
This article contains supplemental material online at http://jasn.asnjournals.org/lookup/suppl/doi:10.1681/ASN.2012070678/-/DCSupplemental.
References
- 1.Zeisberg M, Neilson EG: Mechanisms of tubulointerstitial fibrosis. J Am Soc Nephrol 21: 1819–1834, 2010 [DOI] [PubMed] [Google Scholar]
- 2.Bohle A, Christ H, Grund KE, Mackensen S: The role of the interstitium of the renal cortex in renal disease. Contrib Nephrol 16: 109–114, 1979 [DOI] [PubMed] [Google Scholar]
- 3.Docherty NG, O’Sullivan OE, Healy DA, Fitzpatrick JM, Watson RW: Evidence that inhibition of tubular cell apoptosis protects against renal damage and development of fibrosis following ureteric obstruction. Am J Physiol Renal Physiol 290: F4–F13, 2006 [DOI] [PubMed] [Google Scholar]
- 4.Yang C, Zeisberg M, Mosterman B, Sudhakar A, Yerramalla U, Holthaus K, Xu L, Eng F, Afdhal N, Kalluri R: Liver fibrosis: Insights into migration of hepatic stellate cells in response to extracellular matrix and growth factors. Gastroenterology 124: 147–159, 2003 [DOI] [PubMed] [Google Scholar]
- 5.Yang L, Besschetnova TY, Brooks CR, Shah JV, Bonventre JV: Epithelial cell cycle arrest in G2/M mediates kidney fibrosis after injury. Nat Med 16: 535–543, 1p, 143, 2010 [DOI] [PMC free article] [PubMed] [Google Scholar]
- 6.Friedman SL: Molecular regulation of hepatic fibrosis, an integrated cellular response to tissue injury. J Biol Chem 275: 2247–2250, 2000 [DOI] [PubMed] [Google Scholar]
- 7.Kaneto H, Morrissey J, Klahr S: Increased expression of TGF-beta 1 mRNA in the obstructed kidney of rats with unilateral ureteral ligation. Kidney Int 44: 313–321, 1993 [DOI] [PubMed] [Google Scholar]
- 8.Ito Y, Aten J, Bende RJ, Oemar BS, Rabelink TJ, Weening JJ, Goldschmeding R: Expression of connective tissue growth factor in human renal fibrosis. Kidney Int 53: 853–861, 1998 [DOI] [PubMed] [Google Scholar]
- 9.Mignini F, Streccioni V, Amenta F: Autonomic innervation of immune organs and neuroimmune modulation. Auton Autacoid Pharmacol 23: 1–25, 2003 [DOI] [PubMed] [Google Scholar]
- 10.Holzer P: Local effector functions of capsaicin-sensitive sensory nerve endings: Involvement of tachykinins, calcitonin gene-related peptide and other neuropeptides. Neuroscience 24: 739–768, 1988 [DOI] [PubMed] [Google Scholar]
- 11.Ma MC, Huang HS, Chen CF: Impaired renal sensory responses after unilateral ureteral obstruction in the rat. J Am Soc Nephrol 13: 1008–1016, 2002 [DOI] [PubMed] [Google Scholar]
- 12.Veelken R, Vogel EM, Hilgers K, Amann K, Hartner A, Sass G, Neuhuber W, Tiegs G: Autonomic renal denervation ameliorates experimental glomerulonephritis. J Am Soc Nephrol 19: 1371–1378, 2008 [DOI] [PMC free article] [PubMed] [Google Scholar]
- 13.Ferguson M, Ryan GB, Bell C: Localization of sympathetic and sensory neurons innervating the rat kidney. J Auton Nerv Syst 16: 279–288, 1986 [DOI] [PubMed] [Google Scholar]
- 14.Kim J, Padanilam BJ: Loss of poly(ADP-ribose) polymerase 1 attenuates renal fibrosis and inflammation during unilateral ureteral obstruction. Am J Physiol Renal Physiol 301: F450–F459, 2011 [DOI] [PubMed] [Google Scholar]
- 15.Haverty TP, Kelly CJ, Hines WH, Amenta PS, Watanabe M, Harper RA, Kefalides NA, Neilson EG: Characterization of a renal tubular epithelial cell line which secretes the autologous target antigen of autoimmune experimental interstitial nephritis. J Cell Biol 107: 1359–1368, 1988 [DOI] [PMC free article] [PubMed] [Google Scholar]
- 16.Boor P, Ostendorf T, Floege J: Renal fibrosis: Novel insights into mechanisms and therapeutic targets. Nat Rev Nephrol 6: 643–656, 2010 [DOI] [PubMed]
- 17.Liu Y: Cellular and molecular mechanisms of renal fibrosis. Nat Rev Nephrol 7: 684–696, 2011 [DOI] [PMC free article] [PubMed] [Google Scholar]
- 18.Wynn TA: Cellular and molecular mechanisms of fibrosis. J Pathol 214: 199–210, 2008 [DOI] [PMC free article] [PubMed] [Google Scholar]
- 19.Mehal WZ, Iredale J, Friedman SL: Scraping fibrosis: Expressway to the core of fibrosis. Nat Med 17: 552–553, 2011 [DOI] [PMC free article] [PubMed] [Google Scholar]
- 20.Dean DC, Newby RF, Bourgeois S: Regulation of fibronectin biosynthesis by dexamethasone, transforming growth factor beta, and cAMP in human cell lines. J Cell Biol 106: 2159–2170, 1988 [DOI] [PMC free article] [PubMed] [Google Scholar]
- 21.Hocevar BA, Brown TL, Howe PH: TGF-beta induces fibronectin synthesis through a c-Jun N-terminal kinase-dependent, Smad4-independent pathway. EMBO J 18: 1345–1356, 1999 [DOI] [PMC free article] [PubMed] [Google Scholar]
- 22.Sakuta H, Inaba K, Muramatsu S: Calcitonin gene-related peptide enhances apoptosis of thymocytes. J Neuroimmunol 67: 103–109, 1996 [DOI] [PubMed] [Google Scholar]
- 23.Yang JH, Zhang YQ, Guo Z: Endogenous CGRP protects retinal cells against stress induced apoptosis in rats. Neurosci Lett 501: 83–85, 2011 [DOI] [PubMed] [Google Scholar]
- 24.Brain SD: Sensory neuropeptides: Their role in inflammation and wound healing. Immunopharmacology 37: 133–152, 1997 [DOI] [PubMed] [Google Scholar]
- 25.Straub RH, Harle P: Sympathetic neurotransmitters in joint inflammation. Rheum Dis Clin North Am 31:43–59, 2005. [DOI] [PubMed]
- 26.Tiegs G, Bang R, Neuhuber WL: Requirement of peptidergic sensory innervation for disease activity in murine models of immune hepatitis and protection by beta-adrenergic stimulation. J Neuroimmunol 96: 131–143, 1999 [DOI] [PubMed] [Google Scholar]
- 27.Hartung HP, Toyka KV: Substance P, the immune system and inflammation. Int Rev Immunol 4: 229–249, 1989 [DOI] [PubMed] [Google Scholar]
- 28.Starke K: Presynaptic autoreceptors in the third decade: Focus on alpha2-adrenoceptors. J Neurochem 78: 685–693, 2001 [DOI] [PubMed] [Google Scholar]
- 29.Gilsbach R, Schneider J, Lother A, Schickinger S, Leemhuis J, Hein L: Sympathetic alpha(2)-adrenoceptors prevent cardiac hypertrophy and fibrosis in mice at baseline but not after chronic pressure overload. Cardiovasc Res 86: 432–442, 2010 [DOI] [PubMed] [Google Scholar]
- 30.Brede M, Wiesmann F, Jahns R, Hadamek K, Arnolt C, Neubauer S, Lohse MJ, Hein L: Feedback inhibition of catecholamine release by two different alpha2-adrenoceptor subtypes prevents progression of heart failure. Circulation 106: 2491–2496, 2002 [DOI] [PubMed] [Google Scholar]
- 31.Zoccali C, Mallamaci F, Tripepi G, Parlongo S, Cutrupi S, Benedetto FA, Cataliotti A, Malatino LS, CREED investigators : Norepinephrine and concentric hypertrophy in patients with end-stage renal disease. Hypertension 40: 41–46, 2002 [DOI] [PubMed] [Google Scholar]
- 32.Fu YC, Chi CS, Yin SC, Hwang B, Chiu YT, Hsu SL: Norepinephrine induces apoptosis in neonatal rat cardiomyocytes through a reactive oxygen species-TNF alpha-caspase signaling pathway. Cardiovasc Res 62: 558–567, 2004 [DOI] [PubMed] [Google Scholar]
- 33.Bulger RE, Burke TJ, Cronin RE, Schrier RW, Dobyan DC: Morphology of norepinephrine-induced acute renal failure in the dog. Anat Rec 214: 341–347, 1986 [DOI] [PubMed] [Google Scholar]
- 34.Kim J, Kim DS, Park MJ, Cho HJ, Zervos AS, Bonventre JV, Park KM: Omi/HtrA2 protease is associated with tubular cell apoptosis and fibrosis induced by unilateral ureteral obstruction. Am J Physiol Renal Physiol 298: F1332–F1340, 2010 [DOI] [PMC free article] [PubMed] [Google Scholar]
- 35.Zheng H, Liu X, Rao US, Patel KP: Increased renal ENaC subunits and sodium retention in rats with chronic heart failure. Am J Physiol Renal Physiol 300: F641–F649, 2011 [DOI] [PMC free article] [PubMed] [Google Scholar]
- 36.Kim J, Jang HS, Park KM: Reactive oxygen species generated by renal ischemia and reperfusion trigger protection against subsequent renal ischemia and reperfusion injury in mice. Am J Physiol Renal Physiol 298: F158–F166, 2010 [DOI] [PubMed] [Google Scholar]
- 37.Singaravelu K, Padanilam BJ: p53 target Siva regulates apoptosis in ischemic kidneys. Am J Physiol Renal Physiol 300: F1130–F1141, 2011 [DOI] [PMC free article] [PubMed] [Google Scholar]
- 38.Kim J, Seok YM, Jung KJ, Park KM: Reactive oxygen species/oxidative stress contributes to progression of kidney fibrosis following transient ischemic injury in mice. Am J Physiol Renal Physiol 297: F461–F470, 2009 [DOI] [PubMed] [Google Scholar]
- 39.Kim J, Long KE, Tang K, Padanilam BJ: Poly(ADP-ribose) polymerase 1 activation is required for cisplatin nephrotoxicity. Kidney Int 82: 193–203, 2012 [DOI] [PubMed] [Google Scholar]
- 40.Kim J, Kil IS, Seok YM, Yang ES, Kim DK, Lim DG, Park JW, Bonventre JV, Park KM: Orchiectomy attenuates post-ischemic oxidative stress and ischemia/reperfusion injury in mice. A role for manganese superoxide dismutase. J Biol Chem 281: 20349–20356, 2006 [DOI] [PubMed] [Google Scholar]
- 41.Devalaraja-Narashimha K, Padanilam BJ: PARP-1 inhibits glycolysis in ischemic kidneys. J Am Soc Nephrol 20: 95–103, 2009 [DOI] [PMC free article] [PubMed] [Google Scholar]
- 42.Sequeira-Lopez ML, Weatherford ET, Borges GR, Monteagudo MC, Pentz ES, Harfe BD, Carretero O, Sigmund CD, Gomez RA: The microRNA-processing enzyme dicer maintains juxtaglomerular cells. J Am Soc Nephrol 21: 460–467, 2010 [DOI] [PMC free article] [PubMed] [Google Scholar]
- 43.Feng M, Whitesall S, Zhang Y, Beibel M, D’Alecy L, DiPetrillo K: Validation of volume-pressure recording tail-cuff blood pressure measurements. Am J Hypertens 21: 1288–1291, 2008 [DOI] [PubMed] [Google Scholar]
Associated Data
This section collects any data citations, data availability statements, or supplementary materials included in this article.