

Abstract
As one of the principal cytoplasmic second messengers, the calcium ion (Ca2+) is central to a variety of intracellular signal transduction pathways. Accordingly, there is a sustained interest in methods for spatially- and temporally resolved imaging of the concentration of Ca2+ in live cells using noninvasive methods such as genetically encoded biosensors based on Forster resonance energy transfer (FRET) between fluorescent proteins (FPs). In recent years, protein-engineering efforts have provided the research community with FRET-based Ca2+ biosensors that are dramatically improved in terms of enhanced emission ratio change and optimized Ca2+ affinity for various applications. We now report the development and systematic optimization of a pair of spectrally distinct FRET-based biosensors that enable the simultaneous imaging of Ca2+ in two compartments of a single cell without substantial spectral crosstalk between emission channels. Furthermore, we demonstrate that these new biosensors can be used in conjunction with previously reported caspase-3 substrates based on the same set of FRET pairs.
Engineered variants of fluorescent proteins (FPs), originally cloned from marine organisms of the phylum Cnidaria, have provided researchers with a valuable set of tools for the minimally invasive imaging of the spatiotemporal dynamics of biomolecules in live cells and tissues.1,2 To use a FP to image the dynamics of a protein, a researcher first creates a genetic fusion of the FP gene and the gene encoding the protein of interest. The fusion gene is then introduced into cells and, using the endogenous transcriptional and translational machinery, the cells produce fluorescently labeled proteins in situ. In such applications the FP can be considered a passive participant that provides a steadfast fluorescence signal that is proportional to concentration but insensitive to other parameters.
Engineering of FP variants that are active reporters of cellular biochemistry (i.e., intracellular biosensors) has required the development of strategies that enable the fluorescence intensity or color of a FP-containing construct to be modulated in response to a change in its environment.3,4 One strategy that has proven particularly useful is the use of Forster resonance energy transfer (FRET)5 from a more blue-shifted donor FP to a more red-shifted acceptor FP. A change in FRET efficiency, due to a change in distance or relative orientation between the two FPs,6 causes a ratiometric change in emission that is imaged in a typical FP FRET experiment. The prototypical FRET-based calcium ion (Ca2+) biosensors are collectively known as cameleons and are created by genetically fusing the Ca2+-binding protein calmodulin (CaM) and the CaM-binding region of chicken myosin light chain kinase (M13) (i.e., the sensing domain) between the two FPs of a FRET pair.7 Binding of Ca2+ to CaM leads to the intramolecular binding of CaM and M13 and a change in the orientation and/or distance between the FPs.
Although there is a growing demand for FP-based methods for monitoring multiple biological parameters in a single cell,8 the broad spectral profiles of FP FRET pairs have, in most cases, meant that only a single biosensor could be ratiometrically imaged in one experiment. To achieve multiparameter imaging, researchers have tended to take hybrid approaches such as the use of cyan FP (CFP)-yellow FP (YFP) FRET-based biosensors with spectrally distinct hues of synthetic dye probes.8 Yet other solutions use multiple intensiometric probes9 or spectral unmixing of the emission from multiple ratiometric probes.10 Arguably, these alternative methods sacrifice some of the key advantages of ratiometric imaging. Specifically, it is inherently quantitative, it is technically simple, it is inexpensive and uses common equipment, and it can be applied to a multitude of biological questions.
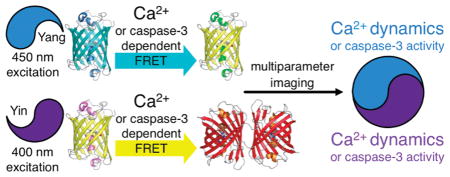
As part of our ongoing efforts to reconcile multiparameter imaging with FP-based imaging, we previously developed a pair of spectrally distinct FP FRET pairs, mAmetrine-tdTomato (Figure 1A) and mTFP1-mCitrine (Figure 1B), that both provide strong sensitized emission and, with appropriate filter choice, can be uniquely excited in each other’s presence.11 For the sake of brevity, we refer to the mAmetrine-tdTomato pair as “Yin” and the mTFP1-mCitrine pair as “Yang”. To explore the utility of these spectrally distinct FRET pairs, we constructed biosensors of caspase-3 proteolytic activity (DEVDYin and DEVDYang) and used them to determine the delay between the onset of caspase-3 activity in the cytoplasm and the nucleus during apoptosis.11 Other workers have explored the combination of CFP-YFP and a second pair based on an orange FP (OFP) and a red FP (RFP), as spectrally distinct FRET pairs.12–14 Such pairs have enabled multiparameter imaging, though their utility tends to be limited by the relatively poor sensitized emission of the RFP acceptors.
Figure 1.

Excitation and emission spectra of the FPs that compose the spectrally distinct FRET pairs used in this work. On each chart is represented the excitation (dashed lines) and emission (solid lines) spectra of both the donor (gray) and acceptor (black) FPs. For each panel, the bandpasses for a typical donor excitation filter (exD), donor emission filter (emD), and acceptor emission filter (emA) are represented. (A) The Yin FRET pair based on a mAmetrine donor and a tdTomato acceptor. (B) The Yang FRET pair based on a mTFP1 donor and a mCitrine acceptor.
We now report the construction, optimization, and application of cameleon-type Ca2+ biosensors based on an improved version of the Yin FRET pair combined with the original Yang FRET pair. Using these optimized biosensors, we have demonstrated that it is feasible to image Ca2+ dynamics in two sub-cellular compartments or Ca2+ and caspase-3 activity in the same subcellular compartment.
EXPERIMENTAL METHODS
General Methods
Synthetic DNA oligonucleotides were purchased from Integrated DNA Technologies (Coralville, IA). PCR products and products of restriction digestion were purified by gel electrophoresis and extracted using either the GeneJET gel extraction kit (Fermentas, ON) or the QIAquick gel extraction kit (QIAGEN, Valencia, CA). Plasmid DNA was purified using either the GeneJET Plasmid Miniprep Kit (Fermentas, ON) or the QIAprep Spin Miniprep kit (QIAGEN, Valencia, CA). Restriction endonucleases were purchased from either Invitrogen or New England Biolabs. Dye terminator cycle sequencing using the BigDye (Applied Biosystems) was used to confirm the complete cDNA sequences for all fusion constructs. Sequencing reactions were analyzed at the University of Alberta Molecular Biology Service Unit (MBSU). All filters for fluorescence screening and imaging were purchased from Chroma Technology (Rockingham, VT), Omega Filters (Brattleboro, VT), or Semrock (Rochester, NY).
Engineering and Directed Evolution of mAmetrine
Overlap-extension PCR was used to create the initial gene encoding cpmAmetrine-173 with a randomized residue (i.e., codon NNK, where N = A, G, C, T and K = G or T) at both termini. This initial library was screened as described below. In later rounds of directed evolution, error-prone PCR with Taq polymerase in the presence of MnCl2 (200 μM) was used out to create libraries of mAmetrine with random mutations.15 Purified PCR products were digested with Xho1 and EcoR1 and ligated into similarly digested pBAD/His B expression plasmid (Invitrogen). Electro-competent Escherichia coli strain DH10B (Invitrogen) was transformed and plated on LB/agar plates supplemented with ampicillin (0.1 mg/mL) and L-arabinose (0.02%). Plates were incubated at 37 °C for 14 h prior to screening.
To screen for bright cpmAmetrine-173 variants, colonies grown on a 10 cm Petri dish were illuminated with light from a 175 W xenon-arc lamp (Sutter) that had been passed through a bandpass filter wheel. Colony fluorescence was imaged with a Retiga 1300i 12-bit CCD camera (QImaging) equipped with a second filter wheel. For each dish, three images were acquired: excitation 375–415 nm, emission 440–480 nm; excitation 490–510 nm, emission 520–550 nm; and excitation 375–415 nm, emission 520–550 nm. Colonies with the highest ratio of fluorescence intensity in the latter image, relative to fluorescence intensity in the other two images, were picked.
To screen libraries of mAmetrine variants for improved photostability, an image (excitation 375–415 nm, emission 520–550 nm) of the plate was first acquired. The Petri dish was then placed in a custom-made photobleaching chamber and illuminated for 30 min by six 9 × 11 arrays of 405 nm light emitting diodes (OptoDiode Corporation, Newbury Park, CA). The dish was then imaged again using the same filter set. Image Pro plus (Media Cybernetics, Bethesda, MD) was used for image processing, and a custom macro provided a list of the mean intensities for each colony in both images. Colonies with the highest intensity ratio of yellow fluorescence after photo-bleaching to yellow fluorescence before photobleaching were picked and used as templates for the following round of library creation.
Construction of CaYang and CaYin Variants
We previously reported a version of yellow cameleon 3.3 (YC3.3)16 in which CFP has been replaced with mTFP1.17 This mTFP1-YC3.3 (i.e., CaYang0.1) coding sequence is between the Xho1 (5′ end) and EcoR1 (3′ end) sites of pBAD/His B and contains a Sph1 site after mTFP1 (1–220; numbered as in ref 17) and a Sac1 before Citrine (a YFP). Routine plasmid digestion and ligation with appropriately digested PCR product was used to replace Citrine with mCitrine18 or cpVenus-173.19 Variants with the YC3.3 CaM/M13 portion replaced with the analogous portion from either YC4.3 or D1 were similarly constructed.20
To generate CaYin0.1, a series of sequential digestions and ligations of the CaYang0.1 in pBAD/His B were performed. Specifically, mTFP1 was swapped with mAmetrine,11 the YC3.3-derived CaM/M13 portion was swapped with the analogous portion of YC2.1,7 and Citrine was swapped with tdTomato.21 The domain organization of all CaYang and CaYin variants is provided in Figure 2. All variants were expressed in E. coli and purified as described below.
Figure 2.
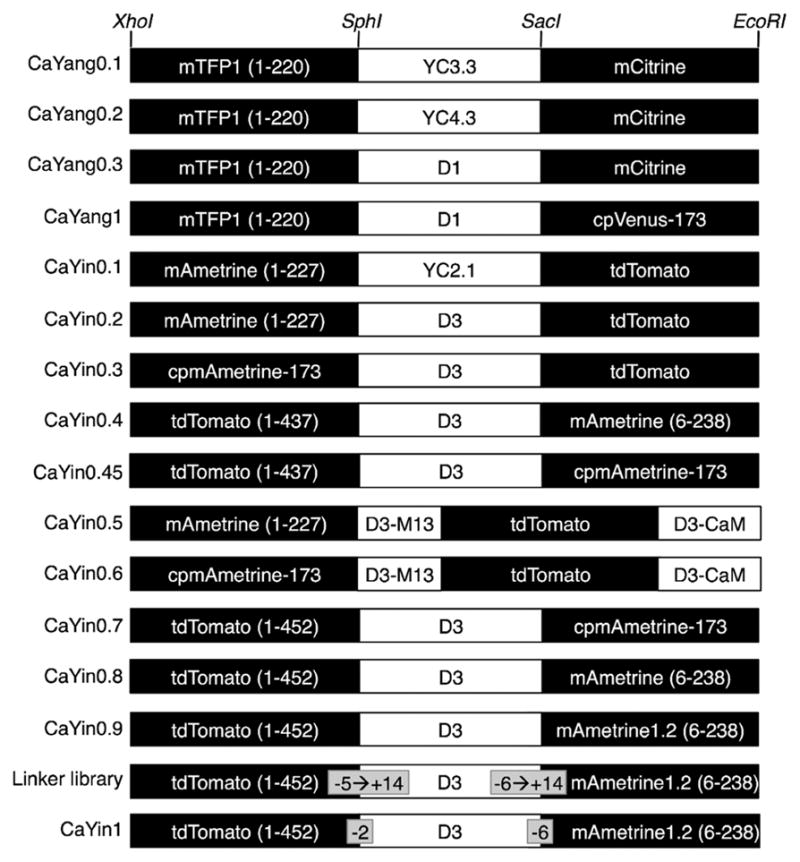
Domain arrangements tested during the optimization of CaYang and CaYin. All variants are designated using an alphabetic character. The intermediate portion of the gene, labeled as YC2.1, YC3.3, YC4.3, D1, or D3, refers to the CaM-M13 region of the corresponding cameleon construct.7,16,20,24
Optimization of Ca2+ Biosensors by Linker Modification
To optimize the FRET efficiency change of CaYin0.9 (Figure 2), the length of the linkers between tdTomato and the D3 domain and between the D3 domain and mAmetrine1.2 were varied. The amino acid sequences of all linkers tested is provided in Table S-1 in the Supporting Information. Linkers were modified using a PCR procedure in which the cDNA encoding the D3 domain of CaYin0.9 was amplified with appropriately modified forward and reverse primers that contained a Sph1 site and a Sac1 site, respectively. PCR products were double digested and ligated (T4 ligase, Invitrogen) into a similarly digested pBAD/His B CaYin0.9 plasmid.
Protein Purification and Characterization
E. coli strain ElectroMAX DH10B (Invitrogen) was transformed by electro-poration with a pBAD/His B containing the gene of interest. A single colony was used to inoculate a 4 mL culture that was grown overnight (37 °C, 225 rpm) before being diluted into 0.5 L of LB medium supplemented with ampicillin. This culture was grown (37 °C, 225 rpm) to an optical density of 0.6, induced with 0.02% L-arabinose, and cultured for 24 h at 28 °C (FRET constructs) or 37 °C (mAmetrine variants). Cells were harvested by centrifugation and lysed by cell disruptor (Constant Systems). All proteins were purified by Ni-NTA chromatography (Amersham) and then dialyzed into phosphate buffer saline (pH 7.4). FRET constructs were further purified by size exclusion column chromatography (Amersham Superdex 75 prep).
The alkaline-denaturation method was used to determine the extinction coefficients of mAmetrine variants.22 The quantum yield of cpmAmetrine-173 and mAmetrine1.2 were determined using mAmetrine as a reference standard. Fluorescence and absorbance spectra were recorded on a QuantaMaster spectrofluorometer (Photon Technology International) and a DU-800 UV–visible spectrophotometer (Beckman), respectively.
The fluorescence response of Ca2+ biosensors was determined by mixing the FRET construct (300 nM) with an equal volume of 500 mM CaCl2 or 200 μM ethylene glycol-bis-(2-aminoethyl)-N,N,N′,N′-tetraacetic acid (EGTA) in Tris-buffered saline (pH 7.4). To determine the Kd for Ca2+, the fluorescence response of Ca2+ biosensors was determined in buffers having free Ca2+ ranging from 17 nM to 1 mM. Buffers were prepared by mixing of a 10 mM K2EGTA and a 10 mM CaEGTA solution containing 100 mM KCl and 30 mM MOPS buffer, pH 7.2 in deionized water. Buffers with free Ca2+ above 100 μM were made by dilution of a 1 mM Ca2+ buffer stock.
Construction of Mammalian Expression Plasmids
A modified pcDNA3 (Invitrogen) plasmid, with a Xho1 site and an EcoR1 site in the same reading frame as the equivalent sites of the pBAD/His B plasmid, was used for mammalian cell expression. The mAmetrine, mAmetrine1.2, CaYin1, and CaYang1 constructs in pBAD/His B were treated with Xho1 and EcoR1 and ligated with similarly treated pcDNA3. For targeting to the nucleus, three copies of the nuclear localization sequence (NLS) DPKKKRKV were fused to the C-terminus. For targeting to the cytoplasm, a nuclear export sequence (NES) LALKLAGL-DIGS was fused to the C-terminus.
General Methods for Live Cell Imaging
All DNA for mammalian cell transfection was purified by the Plasmid Midi-prep kit (Qiagen). Human cervical cancer cells (HeLa) were cultured in Dulbecco’s modified Eagle medium (DMEM) (Invitrogen) supplemented with 10% fetal bovine serum (FBS) (Sigma) at 37 °C. Cells in 35 mm imaging dishes were incubated with 1 mL of DMEM (FBS free) for 30 min and then transfected with 1 μg of plasmid DNA that had been mixed with 2 μL of Turbofect Protein Transfection Reagent (Fermentas) in 0.1 mL of DMEM (FBS free). The culture media was changed back to DMEM with 10% FBS after 2.5 h incubation at 37 °C. Imaging was conducted 24–36 h post-transfection with cells at room temperature in HEPES (25 mM) buffered Hanks’ Balanced Salt Solution (HHBSS) containing no phenol red or Ca2+. Imaging was carried on an inverted Nikon Eclipse Ti microscope equipped with a 150 W Lumen 200 metal halide lamp (Prior Scientific) with a 25% neutral density filter, a 40× objective (NA = 0.95, air), and a 16-bit 512SC QuantEM CCD (Photometrics). Images were acquired every 5–10 s with exposure times of 100–300 ms. The NIS-Elements AR 3.0 software package (Nikon) was used for computer control and image analysis. Filters are provided in Table S-2 in the Supporting Information.
Photobleaching
A field of view containing 5–15 HeLa cells (previously transfected with NLS-tagged mAmetrine or mAmetrine1.2) was located on a cover slide using minimal excitation light intensity. These cells were then illuminated using the maximum intensity of the light source, with images acquired every 5 s for the first 1 min, every 20 s for another 2 min, and every 40 s until the cells had bleached to less than the half of the initial intensity. Nuclei with approximately equal sizes and initial intensities were used for data analysis.
Ca2+ Imaging and Induction of Apoptosis
HeLa cells were treated as described above and then imaged for 2 min prior to addition of histamine (30 μM), an agonist that triggers oscillations of intracellular Ca2+ concentration. The cells were then imaged for 15–20 min before the buffer was exchanged twice with HHBSS and finally replaced with HHBSS containing 5 mM Ca2+ and 5 μM ionomycin (a Ca2+ ionophore). The cell were imaged 15 min before the buffer was once again exchanged and replaced with HHBSS containing 10 mM EGTA and 5 μM ionomycin. Imaging was then continued for another 15 min. To induce apoptosis, the nonspecific kinase inhibitor staurosporine was added into culture medium to the final concentration of 2 μM between 24 to 48 h post-transfection. Cells were maintained in HHBSS and subjected to imaging with 1 min interval for 4–6 h.
RESULTS AND DISCUSSION
Optimization of CaYang
We have designated our previously reported Ca2+ biosensor, originally constructed by replacing the CFP portion of YC3.3 with mTFP1,17 as CaYang0.1. The 35% ratio change exhibited by CaYang0.1 is diminished relative to YC3.3.16,17 In an effort to improve the performance of the CaYang0.1 construct, we replaced the YC3.3 sensing domain (containing CaM E104Q) with the analogous domain of YC4.3 (containing CaM E31Q)7 to produce CaYang0.2 or with D1 (engineered to have 4 charge-reversed salt-bridges) to produce CaYang0.3 (Figure 2).20 The CaYang0.3 variant showed an improved dynamic range of 57% (Table S-3 in the Supporting Information). In an attempt to further improve the FRET response, the acceptor, a YFP known as Citrine,16 was replaced with a circularly permuted YFP known as cp173Venus.19 The rationale for this replacement is that it was expected to alter the donor–acceptor dipole–dipole orientation and, accordingly, the FRET efficiency. Fortunately, this modification did result in a improvement in ratio change (Table S-3 in the Supporting Information and Figure 3A), and so the resulting construct was designated CaYang1. In vitro characterization of CaYang1 revealed that the biosensor had a biphasic response to Ca2+ (Figure 3D), similar to that reported for the parent D1 cameleon based on CFP and YFP.20 Fitting the data to a two-site binding model gave Kd values of 1.04 ± 0.03 and 66.8 ± 4.6 μM.
Figure 3.

Characterization of optimized Ca2+ biosensors. (A–C) The Ca2+-dependent emission ratio change for CaYang1 (A), CaYin0.9 (B), and CaYin1 (C). The solid and dashed lines represent the fluorescence of proteins in the presence of 500 mM Ca2+ and 200 μM EGTA, respectively. (D) Fluorescence emission ratio versus concentration of Ca2+ for CaYang1. The Kd values are 1.04 ± 0.03 and 66.8 ± 4.6 μM for the high and low affinity portions of the biphasic binding curve, respectively. (E) Emission ratio versus concentration of Ca2+ for CaYin1. The Kd is 0.87 ± 0.07 μM.
Engineering mAmetrine for Improved Performance in CaYin
As a first step toward the eventual goal of developing an optimized CaYin construct, we first attempted to enhance the relatively poor photostability11 of mAmetrine through directed evolution. Libraries of mAmetrine variants were created by either genetically randomizing a specific amino acid residue to all 20 possible amino acids or by random mutation of the whole gene. These libraries were then screened in a colony format using a three-step protocol in which the colonies were imaged, then bleached, and then imaged again. Colonies with the highest ratio of intensity after bleaching relative to before bleaching were picked for further characterization. An attempt to improve the photostability of mAmetrine by introducing the V224R mutation, which was previously reported to provide a 40-fold photo-stability enhancement in a blue FP,23 led to a nonfluorescent variant. Randomization of position V224, either alone or in combination with randomization of the adjacent Q69 and A72 positions, provided no variants with improved photostability. We therefore turned to library creation by random mutagenesis of the mAmetrine gene. Following successive rounds of generating and screening random libraries, we eventually identified mAme-trine1.2. The spectral profile (Figure 4A) and properties (Table 1) of mAmetrine1.2 are very similar to mAmetrine, with the primary differences being a decreased fluorescence pKa for mAmetrine1.2 (5.8 vs 6.0; Figure 4B) and a 3.3-fold increase in photobleaching halftime (Figure 4C). Interestingly all nine mutations (K26R, T43I, K52E, S99F, V147A, E172K, D190G, S192P, and N212Y) that differentiate mAmetrine1.2 from mAmetrine have side chains directed toward the outside of the β-barrel and six of these are located in loop regions between β-strands (Figure 4D). The mechanism by which these mutations confer improved photostability is currently unclear.
Figure 4.

Characterization of improved mAmetrine variants. (A) Absorbance (black dashed line), excitation (black solid line), and emission (gray solid line) spectra of mAmetrine1.2. The spectral profiles of mAmetrine, mAmetrine1.2, and cpmAmetrine-173 are effectively identical. (B) Fluorescence intensity versus pH for mAmetrine1.2 (black line) and cpmAmetrine-173 (gray line). The apparent pKas for mAmetrine, mAmetrine1.2, and cpmAmetrine-173 are 6.0, 5.8, and 6.0, respectively. (C) Photobleaching curves of mAmetrine (47 cells) and mAmetrine1.2 (33 cells) under widefield illumination conditions. Each gray line represents the photobleaching behavior of an individual cell and the average is represented in black. The photobleaching halftimes are 1135 and 3709 s, respectively. (D,E) Two representations of a model of mAmetrine based on the X-ray crystal structure of Aequorea green FP (PDB ID, 1EMA).29 (D) Residues that have been substituted in mAmetrine1.2, relative to mAmetrine1, are shown in gray stick format. (E) Substitutions in cpmAmetrine-173, represented as in part D. The circular permutation site is represented with a sphere.
Table 1.
Fluorescence Properties of New mAmetrine Variants
| name | λex (nm) | λem (nm) | ε (10− M−1 cm−1) | Φ | brightnessa |
|---|---|---|---|---|---|
| mAmetrine | 406 | 526 | 35 | 0.58 | 20 |
| mAmetrine1.2 | 408 | 525 | 31 | 0.59 | 18 |
| cpmAmetrine-173 | 402 | 522 | 34 | 0.60 | 20 |
Product of ε and Φ.
It is well established that swapping a FP in a FRET pair with a circularly permuted version of the same FP can provide substantial improvements in the dynamic range of a FRET-based biosensor.19,24 Indeed, we used such a modification to improve CaYang as described above. As part of our effort to improve the CaYin biosensor, we set out to create a circularly permuted analogue of mAmetrine with new termini at position 173 (cpmAmetrine-173) and a five-residue peptide linker (GGSGG) connecting the original termini. As the new termini of would be located at the opposite end of the β-barrel from the original N- and C- termini, cpmAmetrine-173 would provide a distinct dipole–dipole orientation in the context of the FRET pair.
As our initially constructed version of cpmAmetrine-173 suffered from poor folding efficiency and low brightness, we employed directed evolution to improve its properties. To create an initial library of variants, a randomized residue was appended to each of the new termini to produce 400 (i.e., 202) possible protein variants. Following library screening in E. coli colonies, DNA sequencing of the brightest variant revealed that it had a lysine at the N-terminus and a proline at the C-terminus. However, this variant only retained about 10% of the brightness of mAmetrine when expressed in E. coli grown overnight at 37 °C. To further improve the fluorescent brightness, we performed five sequential rounds of library creation by error-prone PCR and screening. The brightest variant from the fifth round was designated as cpmAmetrine-173. Characterization of purified cpmAmetrine-173 revealed that the intrinsic brightness (i.e., the product of quantum yield and extinction coefficient) is essentially identical to that of mAmetrine (Table 1), though E. coli colonies expressing the protein are only about 80% as bright as colonies expressing mAmetrine. This discrepancy may reflect a reduced efficiency of protein folding, since the intrinsic brightness is measured using only properly folded and soluble protein. In addition to being circularly permuted and having an appended 5′ lysine and 3′ proline, cpmAmetrine-173 has seven mutations (E32G, I123V, K131R, E142G, N144S, A181V, and Q204R) relative to mAmetrine (Figure 4E).
Optimization of CaYin by Domain Rearrangements
To construct a Ca2+-specific biosensor that would be spectrally distinct from CaYang, we constructed cameleon type constructs using the Yin FRET pair. As with the CaYang biosensor, we initially attempted a variety of domain combinations, with particular emphasis placed on exploring different arrangements of tdTomato, the binding domain of D3,24 and the various versions of mAmetrine we now had in hand (Figure 2). The D3 binding domain has been reported to have a Kd that is well matched to the detection of Ca2+ in the cytoplasm and has the added advantage of being engineered to not bind to endogenous CaM.24,25 Of the 10 variations tested, the construct with the largest ratio change (70%; Table S-3 in the Supporting Information) was CaYin0.9, a biosensor composed of tdTomato followed by the D3 Ca2+ binding motif and mAmetrine1.2.
Optimization of CaYin by Linker Length Modification
Although we had tested 10 distinct domain alterations in an effort to optimize the Ca2+-dependent ratio change of CaYin, we remained unsatisfied with the 70% ratio change of our best variant, CaYin0.9 (Table S-3 in the Supporting Information and Figure 3B). In an effort to further improve the ratio change, we turned to linker adjustment as an alternative method to optimize biosensor performance.6 Accordingly, we individually constructed, purified, and tested 17 additional variants of CaYin0.9 in which the linker between tdTomato and CaM and the linker between M13 and mAmetrine1.2 was varied in length (Table S-1 and Figure S-1 in the Supporting Information). As previously reported for an analogous optimization effort,26 there was no clear trend in the observed responses to Ca2+ as a function of linker length. Indeed, adjustments as small as changing the length of the tdTomato to CaM linker from two to four residues, at a fixed M13 to mAmetrine1.2 linker of two residues, inverted the direction of the ratio change. We also explored the effect of truncating up to five residues from the N-terminus of CaM and up to six residues from the C-terminus of M13. The variant with the largest ratio change (105%; Figure 3C) had two residues deleted from the N-terminus of CaM and six residues deleted from the C-terminus of M13. Further in vitro characterization of this variant, designated as CaYin1, revealed a Kd for Ca2+ of 0.87 ± 0.07 μM (Figure 3E).
Multiparameter Imaging with Ca2+ and Caspase Biosensors
To test the utility of CaYin1 and CaYang1 for multiparameter imaging, we coexpressed both biosensors in HeLa cells and performed ratiometric fluorescence imaging with appropriate filter combinations (Table S-2 in the Supporting Information and Figure 5A–D). Similarly to our previously reported imaging experiments with DEVDYin and DEVDYang,11 CaYin1 was targeted to the cytoplasm using a nuclear-exclusion sequence (NES) and CaYang1 was targeted to the nucleus using a nuclear localization sequence (NLS). Upon stimulation of Ca2+ release by treatment with histamine, intermittent increases in the acceptor to donor ratio were observed in both the cytoplasm and nucleus, consistent with our expectations based on in vitro results. These results demonstrate that both CaYin1 and CaYang1 are suitable for use in multiparameter live cell Ca2+ imaging experiments.
Figure 5.
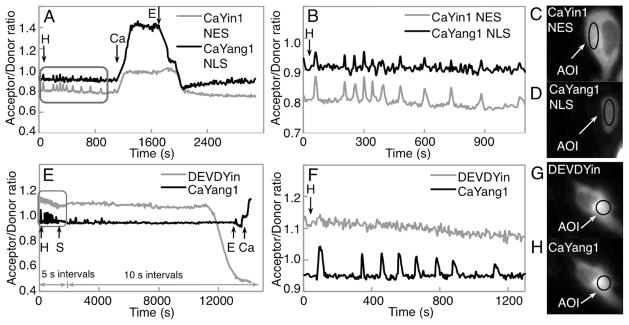
Dual FRET imaging of Ca2+ concentration and caspase-3 activity. (A) Imaging of Ca2+ concentration in two compartments of a single cell. Arrows indicate time points at which the composition of culture medium was altered. Single letter codes represent the addition or exchange of medium to give the following final concentrations: H, 30 μM histamine; Ca, 5 mM Ca2+ and 5 μM ionomycin; E, 10 mM EGTA and 5 μM ionomycin. (B) Zoom in on the boxed area from part A. (C and D) Representative images in the mAmetrine (C) and mTFP1 (D) emission channels of the cell that was imaged in part A. AOI = area of interest from which the time-dependent average intensity was calculated. (E) Imaging of Ca2+ concentration and caspase-3 activity in the same compartment of a single cell. Single letter codes H, E, and C represent the same solutions as in part a, while S represents 2 μM staurosporine (final concentration). (F) Zoom in on the boxed area from part E. (G and H) Representative images in the mAmetrine (G) and mTFP1 (H) emission channels of the cell imaged in part E.
To assess whether biosensors based on the Yin and Yang FRET pairs could be used in the same cellular compartment, we coexpressed both DEVDYin and CaYang1 in HeLa cells and performed ratiometric imaging as with the CaYin1 and CaYang1 combination (Figure 5E–H). This experiment directly assessed the spectral orthogonality of the two sensors, since Ca2+ spikes following histamine treatment were expected to be visualized as increases in the Yang emission ratio but not in the Yin emission ratio. Likewise, the loss of FRET following cleavage of DEVDYin by caspase-3 was expected to be visualized as a decrease in the Yin emission ratio but not in the Yang emission ratio. Satisfyingly, we observed that Ca2+-dependent ratio changes in the Yang emission ratio resulted in no concomitant change in the Yin emission ratio (Figure 5F), and the dramatic decrease in the Yin emission ratio that followed caspase-3 dependent cleavage resulted in no substantial change in the Yang emission ratio (Figure 5E). Correcting the emission intensities for inter-FRET pair spectral crosstalk11 produced time course traces that were qualitatively similar to the uncorrected traces (Table S-4 and Figure S-2 in the Supporting Information).
CONCLUSIONS
We have described the development and optimization of a pair of FP-based Ca2+ biosensors that are spectrally distinct and can be imaged in the same cell. We have also demonstrated that one of these Ca2+ biosensors, paired with one of the previously reported caspase-3 biosensors based on the same FRET pairs, enables ratiometric imaging of both Ca2+ and caspase-3 activity in the cytoplasm of a single cell. With the recent development of the intensiometric red-fluorescent FP-based Ca2+ indicator R-GECO1,9 analogous multiparameter imaging could now be accomplished with the combined use of R-GECO1 and a CFP-YFP FRET-based Ca2+ indicator25 or caspase-3 indicator.27 Relative to this alternative approach, the use of the Yin and Yang FRET pairs provides two advantages. The first advantage is that both biosensors can be imaged ratiometrically, thus providing greater ease of quantitation. The second advantage is that, in principle, any pair of biosensors from the vast number of existing CFP-YFP FRET-based biosensors could be converted to the Yin and Yang FRET pairs. In contrast, there are very few examples of intensiometric biosensors that could be converted to an R-GECO1-like design, severely limiting the versatility of such an approach.
As highlighted by the present work, the primary disadvantage of the Yin and Yang FRET pairs (or any other novel FRET pair) is the substantial challenge associated with converting an optimized CFP-YFP FRET based biosensor to an alternate FRET pair. As others have shown, the FRET response of a particular biosensor is critically dependent on the physical properties of the FPs.28 Accordingly, switching to a different FRET pair, particularly one in which the FPs are derived from different species, may require the onerous task of biosensor optimization to be repeated. In the case of Yin and Yang, the necessary reoptimization effort is doubled. For these reasons, we suggest that the development and optimization of an effective OFP-RFP FRET pair is an important future direction, as it could be used in conjunction with previously optimized CFP-YFP biosensors.
Supplementary Material
Acknowledgments
We thank the University of Alberta MBSU for technical assistance. This work was funded by grants from CIHR and NSERC. R.E.C. holds a Tier II Canada Research Chair in Bioanalytical Chemistry.
Footnotes
ASSOCIATED CONTENT
Supporting Information. Figure showing the ratio change at CaYin for different linker combinations; figure showing effect of applying a correction factor for spectral crosstalk; table of linker sequences; table of filters used for dual FRET imaging; table of ratio changes for different domain arrangements; and table with values for spectral crosstalk between all emission channels. This material is available free of charge via the Internet at http://pubs.acs.org.
References
- 1.Shaner NC, Steinbach PA, Tsien RY. Nat Methods. 2005;2:905–909. doi: 10.1038/nmeth819. [DOI] [PubMed] [Google Scholar]
- 2.Day RN, Davidson MW. Chem Soc Rev. 2009;38:2887–2921. doi: 10.1039/b901966a. [DOI] [PMC free article] [PubMed] [Google Scholar]
- 3.VanEngelenburg SB, Palmer AE. Curr Opin Chem Biol. 2008;12:60–65. doi: 10.1016/j.cbpa.2008.01.020. [DOI] [PubMed] [Google Scholar]
- 4.Ibraheem A, Campbell RE. Curr Opin Chem Biol. 2010;14:30–36. doi: 10.1016/j.cbpa.2009.09.033. [DOI] [PubMed] [Google Scholar]
- 5.Forster T. Ann Phys (Weinheim, Ger) 1948;437:55–75. [Google Scholar]
- 6.Campbell RE. Anal Chem. 2009;81:5972–5979. doi: 10.1021/ac802613w. [DOI] [PubMed] [Google Scholar]
- 7.Miyawaki A, et al. Nature. 1997;388:882–887. doi: 10.1038/42264. [DOI] [PubMed] [Google Scholar]
- 8.Carlson HJ, Campbell RE. Curr Opin Biotechnol. 2009;20:19–27. doi: 10.1016/j.copbio.2009.01.003. [DOI] [PubMed] [Google Scholar]
- 9.Zhao Y, et al. Science. 2011;333:1888–1891. doi: 10.1126/science.1208592. [DOI] [PMC free article] [PubMed] [Google Scholar]
- 10.Tomosugi W, et al. Nat Methods. 2009;6:351–353. doi: 10.1038/nmeth.1317. [DOI] [PubMed] [Google Scholar]
- 11.Ai H, et al. Nat Methods. 2008;5:401–403. doi: 10.1038/nmeth.1207. [DOI] [PubMed] [Google Scholar]
- 12.Piljic A, Schultz C. ACS Chem Biol. 2008;3:156–160. doi: 10.1021/cb700247q. [DOI] [PubMed] [Google Scholar]
- 13.Grant DM, et al. Biophys J. 2008;95:L69–L71. doi: 10.1529/biophysj.108.139204. [DOI] [PMC free article] [PubMed] [Google Scholar]
- 14.Ouyang M, et al. Cancer Res. 2010;70:2204–2212. doi: 10.1158/0008-5472.CAN-09-3698. [DOI] [PMC free article] [PubMed] [Google Scholar]
- 15.Fromant M, Blanquet S, Plateau P. Anal Biochem. 1995;224:347–353. doi: 10.1006/abio.1995.1050. [DOI] [PubMed] [Google Scholar]
- 16.Griesbeck O, et al. J Biol Chem. 2001;276:29188–29194. doi: 10.1074/jbc.M102815200. [DOI] [PubMed] [Google Scholar]
- 17.Ai H, et al. Biochem J. 2006;400:531–540. doi: 10.1042/BJ20060874. [DOI] [PMC free article] [PubMed] [Google Scholar]
- 18.Zacharias DA, et al. Science. 2002;296:913–916. doi: 10.1126/science.1068539. [DOI] [PubMed] [Google Scholar]
- 19.Nagai T, et al. Proc Natl Acad Sci USA. 2004;101:10554–10559. doi: 10.1073/pnas.0400417101. [DOI] [PMC free article] [PubMed] [Google Scholar]
- 20.Palmer AE, et al. Proc Natl Acad Sci USA. 2004;101:17404–17409. doi: 10.1073/pnas.0408030101. [DOI] [PMC free article] [PubMed] [Google Scholar]
- 21.Shaner NC, et al. Nat Biotechnol. 2004;22:1567–1572. doi: 10.1038/nbt1037. [DOI] [PubMed] [Google Scholar]
- 22.Ward WW. Bioluminescence and Chemiluminescence: Basic Chemistry and Analytical Applications. In: De Luca M, McElroy DW, editors. Properties of the Coelenterate green-fluorescent proteins. Academic Press; New York: 1981. pp. 235–242. [Google Scholar]
- 23.Mena MA, et al. Nat Biotechnol. 2006;24:1569–1571. doi: 10.1038/nbt1264. [DOI] [PubMed] [Google Scholar]
- 24.Palmer AE, et al. Chem Biol. 2006;13:521–530. doi: 10.1016/j.chembiol.2006.03.007. [DOI] [PubMed] [Google Scholar]
- 25.Palmer AE, Tsien RY. Nat Protoc. 2006;1:1057–1065. doi: 10.1038/nprot.2006.172. [DOI] [PubMed] [Google Scholar]
- 26.Hires SA, Zhu Y, Tsien RY. Proc Natl Acad Sci USA. 2008;105:4411–4416. doi: 10.1073/pnas.0712008105. [DOI] [PMC free article] [PubMed] [Google Scholar]
- 27.Luo KQ, et al. Biochem Biophys Res Commun. 2001;283:1054–1060. doi: 10.1006/bbrc.2001.4896. [DOI] [PubMed] [Google Scholar]
- 28.Kotera I, et al. ACS Chem Biol. 2010;5:215–222. doi: 10.1021/cb900263z. [DOI] [PubMed] [Google Scholar]
- 29.Ormo M, et al. Science. 1996;273:1392–1395. doi: 10.1126/science.273.5280.1392. [DOI] [PubMed] [Google Scholar]
Associated Data
This section collects any data citations, data availability statements, or supplementary materials included in this article.