Abstract
Engineered fluorescent protein (FP) chimeras that modulate their fluorescence in response to changes in calcium ion (Ca2+) concentration are powerful tools for visualizing intracellular signaling activity. However, despite a decade of availability, the palette of single FP-based Ca2+ indicators has remained limited to a single green hue. We have expanded this palette by developing blue, improved green, and red intensiometric indicators, as well as an emission ratiometric indicator with an 11,000% ratio change. This series enables improved single-color Ca2+ imaging in neurons and transgenic Caenorhabditis elegans. In HeLa cells, Ca2+ was imaged in three subcellular compartments, and, in conjunction with a cyan FP–yellow FP–based indicator, Ca2+ and adenosine 5′-triphosphate were simultaneously imaged. This palette of indicators paints the way to a colorful new era of Ca2+ imaging.
Fluorescent indicators for the quantification of intracellular Ca2+ have been indispensable tools of cell biology for three decades (1), yet the need for new indicators has continued to grow as advances in molecular biology and microscopy instrumentation reveal the limitations of each previous generation. Accordingly, there has been a push toward Ca2+ indicators that are longer wavelength, ratiometric, and higher signal-to-noise, and—since the advent of green fluorescent protein (GFP)—genetically encodable. A ratiometric indicator excites or emits at distinct wavelengths in the Ca2+-free and Ca2+-bound states and provides the advantages of being quantitative and less susceptible to imaging artifacts. Two important classes of genetically encoded Ca2+ indicators are the Förster resonance energy transfer (FRET)–based cameleon type (2), and the single GFP type, such as GCaMP (3) and flash-pericam (4), that are dim in the absence of Ca2+ and bright when bound to Ca2+. GCaMPs are composed of a circularly permuted (cp) GFP fused to the calmodulin (CaM)–binding region of chicken myosin light chain kinase (M13) at its N terminus and a vertebrate CaM at its C terminus. Binding of Ca2+ causes the M13 and CaM domains to interact and the interface between CaM and the fluorescent protein (FP) to reorganize, which leads to an increase in fluorescence due to water-mediated interactions between the chromophore and R377 (5) of CaM (6, 7).
Although directed protein evolution has provided many improved FPs, it has not proven particularly effective for the production of improved GCaMPs. Directed evolution of FPs is typically guided by digital fluorescence imaging of large libraries of gene variants expressed in Escherichia coli colonies. In this manner, rare clones that harbor a mutation that confers a desirable trait, such as improved brightness or altered hue, can be identified in libraries of >105 variants. Lacking an analogous screen for GCaMP Ca2+ response, researchers have identified improved variants by manual testing (7, 8) and a medium-throughput cell-based assay (9).
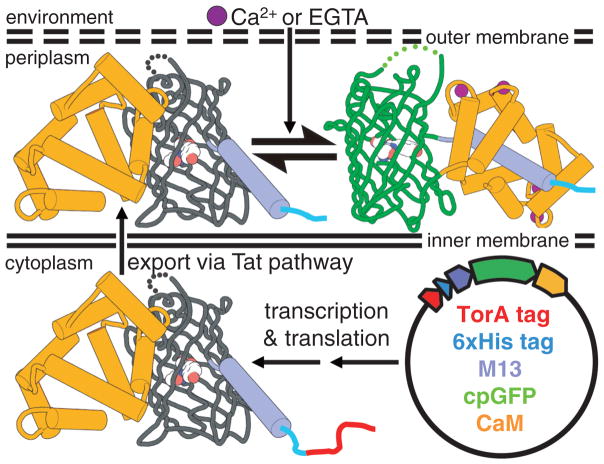
To accelerate the development of improved and hue-shifted GCaMP-type indicators, we developed a colony-based screen for Ca2+-dependent fluorescent changes (Fig. 1) [supporting online material (SOM) text]. The premise of this screening system is that Ca2+ indicators targeted to the E. coli periplasm can be shifted toward the Ca2+-free or Ca2+-bound states by experimental manipulation of the environmental Ca2+ concentration. Accordingly, screening of large libraries of genetic variants of GCaMP-type indicators can be achieved by digital fluorescence imaging, at both high- and low-Ca2+ conditions, of plates containing hundreds of E. coli colonies each. We used this screening system to undertake a process of directed evolution that explored the sequence space accessible from the most optimized single FP Ca2+ indicator, GCaMP3 (9). Initially, we created a large library by error-prone polymerase chain reaction (PCR) and screened ~2 × 10⁵ colonies to identify the offspring with the largest Ca2+-dependent changes in green fluorescence (10). After this and subsequent iterative rounds of library creation and screening (fig. S1), we arrived at a set of three improved variants (figs. S2 and S3 and table S1). We designated these green fluorescent genetically encoded Ca2+ indicators for optical imaging as G-GECO1 (Fig. 2, A to C), G-GECO1.1, and G-GECO1.2. Parallel efforts to evolve flash-pericam (4) did not produce variants with properties that rivaled the G-GECOs. The G-GECOs share a Ca2+-dependent increase in fluorescence (2300 to 2600%) that is approximately double that of GCaMP3 (table S2), which demonstrates the effectiveness of the molecular evolution strategy. The primary differences between the three variants are the apparent dissociation constants (Kd) for Ca2+ (750 nM, 620 nM, and 1150 nM, respectively; 540 nM for GCaMP3) and the fact that G-GECO1 exhibits the least fluorescence when excited at ~400 nm and may be preferred when used in conjunction with violet-excitable probes.
Fig. 1.
Schematic of the system for image-based screening of E. coli colonies. The GCaMP variant, as represented by GCaMP2 (PDB ID 3EVU and 3EVR) (6), has a TorA periplasmic export tag (17).
Fig. 2.

Spectral profiles of GECOs. (A) Fluorescence excitation (Ex) and emission spectra (Em) normalized to the Ca2+-free state. (B) Normalized excitation spectra of Ca2+-free (dashed line) and Ca2+-bound (solid line) B-GECO1 (blue), G-GECO1 (green), and R-GECO1 (red). (C) Emission spectra represented as in (B). (D) Absorbance (Abs) and emission spectra for Ca2+-free (dashed line) and Ca2+-bound (solid line) GEM-GECO1.
Our success in developing the G-GECOs led us to explore the evolution of GECOs with altered fluorescent hues. We attempted to construct a blue fluorescent GECO (B-GECO) by introducing the GFP Y66H substitution (in which His replaces Tyr66) to produce the histidine-derived chromophore of blue FP (BFP), into G-GECO1.1. To create an initial library of variants, we randomized three amino acids (V63, R377, and K380) with side chains in close proximity to the chromophore (6). Screening of this >18,000-member library led to the identification of a first-generation B-GECO with 400% signal change. Additional rounds of evolution ultimately produced B-GECO1 (table S1 and figs. S2, S4A, and S5A), which has a 700% signal change (Fig. 2, B and C) and a Kd of 480 nM (table S2) and is relatively pH-insensitive compared with G-GECO1 (22% versus 92% quenched at pH 6) (fig. S6).
Red-shifted fluorescent indicators are preferable to blue-shifted ones because of the lower phototoxicity and greater tissue penetration associated with longer wavelength light. To construct a potential red fluorescent GECO (R-GECO), we first replaced the cpGFP of G-GECO1.1 with an analogous cp version (Nterm-146 to 231-GGTGGS-1 to 145-Cterm) of the mApple red FP (11). The first-generation library was created by error-prone PCR and randomization of the first and last residues of cpmApple (63 and 302 by GECO numbering) (fig. S2). From this library, we identified R-GECO0.1, which exhibited a modest response to Ca2+ (60% increase). Additional rounds of directed evolution afforded major improvements and resulted in the production of R-GECO1 (table S1 and figs. S2, S4B, and S5B), which exceeds GCaMP3 in terms of its Ca2+ response. R-GECO1 has a 1600% intensity change (Fig. 2, B and C), a Kd of 480 nM, and absorption and emission maxima that are ~80 nm red-shifted relative to the G-GECO series (table S2).
Late in the directed evolution process, we used a PCR-based method (12) to recombine the mutations of advanced intermediates and final products of the B-GECO, G-GECO, and flash-pericam series. This recombination produced our most improved B- and G-GECOs, but also yielded some unexpected variants. For example, some of the brightest blue fluorescent variants had a tyrosine-derived chromophore and exhibited a Ca2+-dependent change in the ratio of blue (~450 nm) to green (~510 nm) fluorescence when excited at ~400 nm (Fig. 2D). We speculate that, in the Ca2+-free state, the chromophore of this blue-green emission ratiometric GECO (GEM-GECO) undergoes excited-state proton transfer (ESPT) and emits from the lower-energy (green fluorescent) anionic form. In the Ca2+-bound state, ESPT is blocked, and the chromophore emits from the higher-energy (blue fluorescent) neutral form. Additional library creation and screening led to GEM-GECO1 (table S1 and figs. S2 and S4C), which exhibits an 11,000% ratio change and a Kd of 340 nM (table S2).
Yet another unexpected discovery in the recombination library was a green excitation ratiometric GECO (GEX-GECO), which exhibits a large Ca2+-dependent change in the ratio between 400-nm and 488-nm excitation (fig. S5C). This indicator is analogous to the previously reported ratiometric-pericam that undergoes a ~1000% ratio change (4). Further directed evolution produced GEX-GECO1 (table S1 and figs. S2 and S4D), which exhibits a 2600% change in excitation ratio, a Kd of 318 nM, and the most rapid approach to equilibrium (kobs) of any of the GECOs (table S3 and fig. S7).
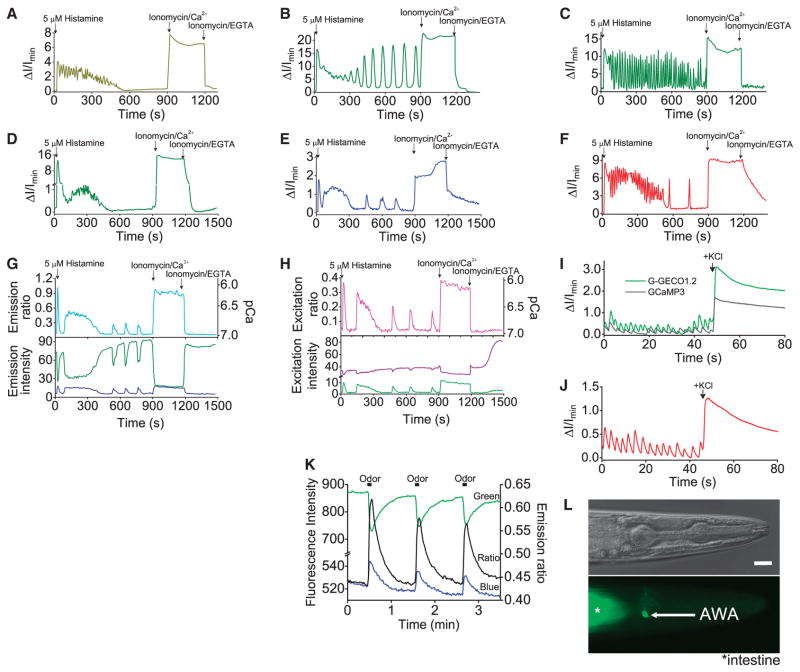
To explore the utility of our best GECOs, we performed a series of imaging experiments to investigate their performance relative to previously reported indicators and to determine whether they could be used for multicolor Ca2+ imaging in single cells. Initially, we expressed individual GECOs in HeLa cells and imaged their intensity (or ratio) during treatment with histamine and in situ dynamic range calibration (table S4 and Fig. 3, A to H). The performance of the GECOs in cells closely paralleled their performance in vitro. We next explored the use of the G- and R-GECO1 in dissociated rat hippocampal neurons (Fig. 3, I and J). Consistent with our HeLa experiments, G-GECO1 proved superior to, and R-GECO1 comparable to, GCaMP3 for imaging of spontaneous Ca2+ oscillations. To achieve imaging of neuronal activity in a whole animal, we turned to GEM-GECO1 because of its large ratiometric change. Exposure of a transgenic Caenorhabditis elegans, with GEM-GECO1 expressed in the AWA sensory neuron, to a perfused solution of diacetyl produced a 44% ratio change (Fig. 3, K and L), a substantial improvement over the 18% ratio change obtained with YC3.60 under similar conditions (13). This improvement was obtained with a cyan FP–yellow FP (CFP-YFP) filter set that provided diminished autofluorescence signal but is not ideally matched to the GEM-GECO1 spectrum.
Fig. 3.
Single-color imaging with GECOs. (A to H) Intensity versus time traces for transfected HeLa cells. (A) GCaMP3, (B) G-GECO1, (C) G-GECO1.1, (D) G-GECO1.2, (E) B-GECO1, (F) R-GECO1, (G) GEM-GECO1, and (H) GEX-GECO1. Ionomycin/Ca2+, ionomycin/EGTA, and the initial histamine-induced spike are generally consistent for a given variant (table S4), but the histamine-induced oscillations are highly variable between cells. Accordingly, lower-amplitude oscillations [e.g., (A) and (D)] do not necessarily indicate poorer indicator performance. (I) Imaging of spontaneous Ca2+ oscillations in neurons. (J) R-GECO1 imaged under conditions similar to those in (I). (K) Ratiometric imaging of C. elegans with GEM-GECO1 expressed in the AWA neuron. (L) Bright-field and fluorescence images of the worm imaged in (K). Scale bar, 10 μm. Filter specifications are in table S5.
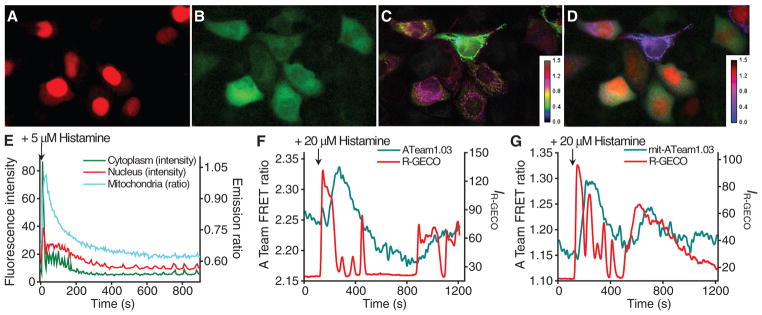
The palette of GECOs transforms Ca2+ imaging from a monochromatic to a multichromatic endeavor. With appropriate targeting and selection of GECO hues, it should be possible to visualize correlated changes in Ca2+ in different organelles of a single cell. To explore this possibility, we imaged HeLa cells cotransfected with plasmids encoding targeted versions of R-GECO1, G-GECO1, and either B-GECO1 or GEM-GECO1 (Fig. 4, A to E). As mitochondrial autofluorescence interferes with the emission of B-GECO1, but not with the ratiometric emission of GEM-GECO1, we prefer the latter three-color combination. To determine whether R-GECO1 could be used to image Ca2+ dynamics in conjunction with a CFP-YFP FRET-based indicator, we co-expressed R-GECO1 and ATeam1.03, a FRET-based adenosine 5′-triphosphate (ATP) indicator (14), in HeLa cells. As recently observed with a synthetic Ca2+ indicator (15), histamine treatment resulted in transient increases in cytoplasmic (Fig. 4F) and mitochondrial (Fig. 4G) ATP concentrations, albeit with a lag relative to cytoplasmic Ca2+.
Fig. 4.

Multicolor imaging with GECOs. (A to C) HeLa cells transfected with nucleus-localized R-GECO1, cytoplasmic G-GECO1, and mitochondria-localized GEM-GECO1. (A) Red fluorescence. (B) Green fluorescence with cyan (~470 nm) excitation. (C) Pseudocolored ratio of blue to green fluorescence with UV (~380-nm) excitation (C). (D) Merge of images (A) to (C), with GEM-GECO1 ratio in magenta. Images are from movie S1. (E) Intensity or ratio versus time traces for each channel represented in (A) to (C). Filter specifications are in table S5. (F) Imaging of cytoplasmic Ca2+ and ATP. (G) Imaging of cytoplasmic Ca2+ and mitochondrial ATP.
In summary, we have engineered a palette of GECOs and have demonstrated that they open the door to Ca2+ imaging experiments that were previously impractical. Specifically, these indicators enable imaging of multiple Ca2+ indicators in single cells; imaging of neuronal activity in C. elegans with improved sensitivity; and, in the case of R-GECO1, multiparameter imaging with CFP-YFP FRET-based biosensors. In addition, GEM-GECO1 and R-GECO1 should facilitate imaging of neuronal activity after optogenetic channel activation, because they are excited at wavelengths spectrally distinct from the action spectra of certain channels (16).
Supplementary Material
Acknowledgments
We thank L. L. Looger for GCaMP3 cDNA (Addgene plasmid 22692) and H. Imamura for AT1.03 and mitAT1.03 plasmids. Technical advice or support was provided by J. H. Weiner, Q. Tran, K. Saito, T. Matsuda, N. Sato, N. Yonezawa, the Nikon Imaging Center at Hokkaido University, and the University of Alberta Molecular Biology Service Unit. Sequences have been deposited in GenBank (accession nos. JN258409 to JN258415). Plasmid requests will be handled through Addgene and covered under the Uniform Biological Material Transfer Agreement. This work was supported by Alberta Innovates (Y.Z.); Japan society for the Promotion of Science (JSPS), Canadian Institutes of Health Research, and Natural Sciences and Engineering Research Council of Canada (R.E.C.); Ministry of Education, Culture, Sports, Science, and Technology of Japan Grants in Aid for Scientific Research (KAKENHI) 20115003 and 221S0003 (T.I.); and PRESTO from the Japan Science and Technology Agency and FIRST from JSPS (T.N.). R.E.C. holds a Tier II Canada Research Chair in Bioanalytical Chemistry.
Footnotes
References and Notes
- 1.Tsien RY. In: Calcium as a Cellular Regulator. Carafoli E, Klee CB, editors. Oxford Univ. Press; Oxford: 1999. pp. 28–54. [Google Scholar]
- 2.Miyawaki A, et al. Nature. 1997;388:882. doi: 10.1038/42264. [DOI] [PubMed] [Google Scholar]
- 3.Nakai J, Ohkura M, Imoto K. Nat Biotechnol. 2001;19:137. doi: 10.1038/84397. [DOI] [PubMed] [Google Scholar]
- 4.Nagai T, Sawano A, Park ES, Miyawaki A. Proc Natl Acad Sci USA. 2001;98:3197. doi: 10.1073/pnas.051636098. [DOI] [PMC free article] [PubMed] [Google Scholar]
- 5.Single-letter abbreviations for amino acid residues are: Ala A, Cys C, Asp D, Glu E, Phe F, Gly G, His H, Ile I, Lys K, Leu L, Met M, Asn N, Pro P, Gln Q, Arg R, Ser S, Thr T, Val V, Trp W, Tyr Y.
- 6.Wang Q, Shui B, Kotlikoff MI, Sondermann H. Structure. 2008;16:1817. doi: 10.1016/j.str.2008.10.008. [DOI] [PMC free article] [PubMed] [Google Scholar]
- 7.Akerboom J, et al. J Biol Chem. 2009;284:6455. doi: 10.1074/jbc.M807657200. [DOI] [PMC free article] [PubMed] [Google Scholar]
- 8.Tallini YN, et al. Proc Natl Acad Sci USA. 2006;103:4753. doi: 10.1073/pnas.0509378103. [DOI] [PMC free article] [PubMed] [Google Scholar]
- 9.Tian L, et al. Nat Methods. 2009;6:875. doi: 10.1038/nmeth.1398. [DOI] [PMC free article] [PubMed] [Google Scholar]
- 10.Materials and methods are available as supporting material on Science Online.
- 11.Shaner NC, et al. Nat Methods. 2008;5:545. doi: 10.1038/nmeth.1209. [DOI] [PMC free article] [PubMed] [Google Scholar]
- 12.Zhao H, Zha W. Nat Protoc. 2006;1:1865. doi: 10.1038/nprot.2006.309. [DOI] [PubMed] [Google Scholar]
- 13.Shinkai Y, et al. J Neurosci. 2011;31:3007. doi: 10.1523/JNEUROSCI.4691-10.2011. [DOI] [PMC free article] [PubMed] [Google Scholar]
- 14.Imamura H, et al. Proc Natl Acad Sci USA. 2009;106:15651. doi: 10.1073/pnas.0904764106. [DOI] [PMC free article] [PubMed] [Google Scholar]
- 15.Nakano M, Imamura H, Nagai T, Noji H. ACS Chem Biol. 2011;6:709. doi: 10.1021/cb100313n. [DOI] [PubMed] [Google Scholar]
- 16.Zhang F, et al. Nat Protoc. 2010;5:439. doi: 10.1038/nprot.2009.226. [DOI] [PMC free article] [PubMed] [Google Scholar]
- 17.Barrett CM, Ray N, Thomas JD, Robinson C, Bolhuis A. Biochem Biophys Res Commun. 2003;304:279. doi: 10.1016/s0006-291x(03)00583-7. [DOI] [PubMed] [Google Scholar]
Associated Data
This section collects any data citations, data availability statements, or supplementary materials included in this article.


