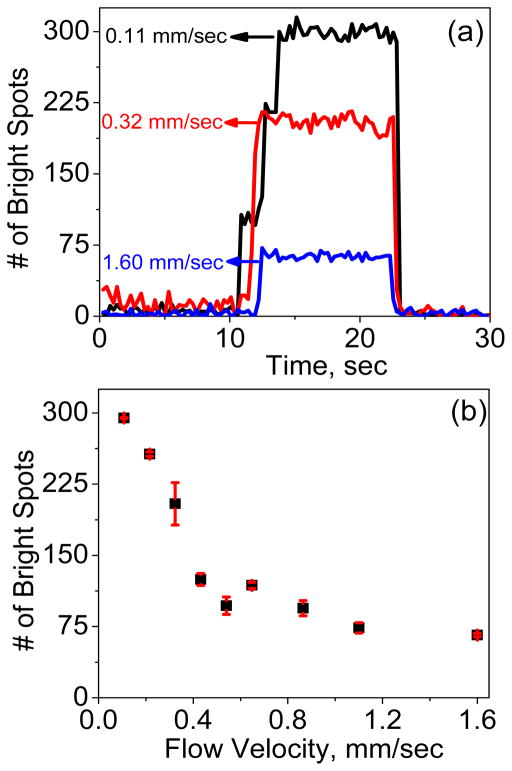
Figure 4.
Quantifying E. coli cells captured at different flow velocities. (a) The change in number of captured E. coli cells (correlated to the number of bright spots counted) with respect to time at three flow velocities (0.11, 0.32 and 1.6 mm/sec). DEP capture experiments are performed by applying an AC voltage of 10 Vpp at a frequency of 100 kHz. (b) The change in number of bright spots as a function of flow velocity as E. coli cells are flowing through the channel.

