

Abstract
The last decade has seen dramatic technological advances in the field of optical coherence tomography (OCT) imaging. These advances have driven commercialization and clinical adoption in ophthalmology, cardiology, and gastrointestinal cancer screening. Recently an array of OCT-based imaging tools developed for preclinical intravital cancer imaging applications have yielded exciting new capabilities to probe and monitor cancer progression and response in vivo. Here, we review these results, forecast the future of OCT for preclinical cancer imaging and discuss its exciting potential to translate to the clinic as a tool for monitoring cancer therapy.
Introduction
Optical coherence tomography (OCT) provides non-invasive and label-free imaging of living tissues and organisms1–4. While it is a relatively new technology, OCT is based on principles of optical interferometry that have been developed for several hundred years (Box 1). The way in which the image is generated in OCT (through the use of interferometric sectioning (Box 1)) is unique compared with other in vivo imaging modalities, and gives OCT distinctive capabilities. First, contrast in OCT is derived from the light scattering properties of cells, stroma, and other tissue structures. As such, OCT is a label-free optical imaging modality. Second, OCT imaging utilizes longer wavelength in the near infrared region. Because scatter decreases with increasing wavelength, OCT can image at high resolutions deeper into tissues than possible using shorter wavelength optical microscopy. Third, the mechanical components that carry out OCT can be miniaturized. Although fluorescence microscopes have also been miniaturized, OCT can be operated with low numerical aperture lenses, which facilitate the integration of OCT optics into small probes, catheters, and endoscopes for imaging at internal sites.
Box 1. Principles of OCT.
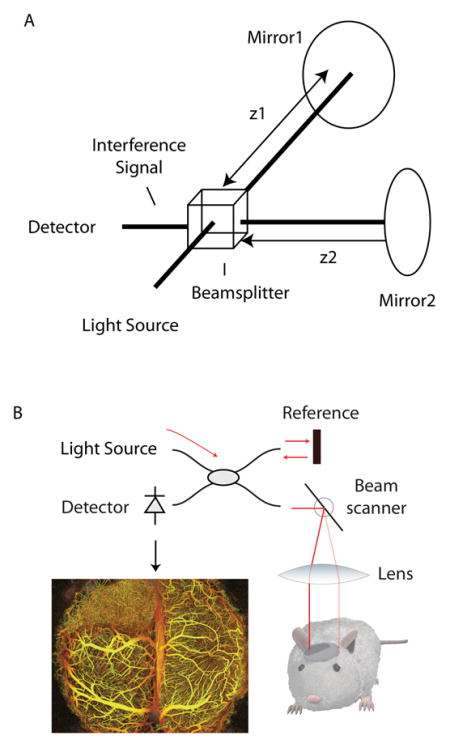
In its simplest form, an optical interferometer is an instrument capable of measuring the differential distance travelled by two paths of light (See the figure, part a). It operates by splitting a light source into two beams, each of which is made to travel one of the two paths that are to be compared. When these beams are recombined, their resulting interference signal depends on the distance (at the sub-micron scale) travelled by each beam. In OCT, this concept is extended using one of the two beams of the interferometer to illuminate living tissue (See the figure, part b). As the beam propagates into the tissue, scattering by cells and other structures redirects some light backward. This scattered light is collected and made to interfere with the second (mirror-reflected) beam. Using the resulting interference signal, the depth of all the tissue-scattered light can be measured to the limit of the resolution of the interferometer, which is typically 5–10 μm in OCT systems. Transverse resolution is limited by the focused beam size and varies from 5–30 μm depending on the system design. Repeating these measurements across three-dimensions allows an OCT instrument to map optical scattering across the tissue volume with near histological resolution. By analyzing these optical scattering measurements, properties including anatomy, blood vasculature (see the figure, part b), lymphatic vasculature, and tissue viability can be measured.
These factors have combined to motivate adoption of OCT into several diagnostic applications. Opthalmic OCT is now standard-of-care in the U.S. and Europe5, intravascular OCT has been commercialized world wide and is rapidly becoming a standard-of-care in interventional cardiology6, and endoscopic OCT is being commercialized as an adjunct to conventional white-light endoscopic examination2. OCT is also applied to preclinical imaging. Within the past several years, exciting achievements in intravital cancer imaging, i.e., imaging of cancers in living mouse models, underscore a growing role for OCT in preclinical imaging. In this Innovation article, we highlight how recent advances in OCT have provided new imaging capabilities in cancer biology, and how these capabilities contrast to those provided by existing technologies. We highlight successful preclinical applications of OCT from multiple laboratories for imaging different aspects of the biology of tumours and their microenvironments, and how OCT can be integrated with complementary imaging modalities to enhance the information obtained from imaging studies. Finally, we discuss the potential of using OCT to monitor the clinical treatment of cancer.
Optical Coherence Tomography Instrumentation
OCT is one of many techniques for imaging tissues and cells in a living organism (Table 1). An OCT system typically comprises a light source, an interferometer, and a microscope or imaging catheter that delivers light to and collects reflections from the tissue to be imaged (Box 1). Because of optical scattering in tissue, OCT signals cannot penetrate beyond 2 mm in most tissues. This necessitates selection of appropriate animal models. Often, as with fluorescence microscopies that have limited imaging depths, benchtop (non-endoscopic) imaging is performed using window models at the skin, mammary fat pad, or brain sites7–9. OCT can also be used for subcutaneous models by transdermal imaging, or can be applied to surgically exposed internal sites10. Benchtop imaging employs a microscope similar in design to those used in fluorescence microscopy wherein anesthetized animals are placed under the imaging objective and galvanometric beam scanners translate the imaging beam. As an alternative to benchtop OCT, endoscopic OCT allows imaging at internal sites within the animal11, 12; here the probe is placed in contact with or very near to the tissue to be imaged. This miniaturization typically does not induce significant degradation in imaging sensitivity or resolution. Beyond providing access to internal sites in small animals, these endoscopic embodiments are also the likely pathway for potential future clinical adoption of OCT tools with which to monitor cancer therapy.
Table 1.
Overview of intravital imaging approaches in preclinical cancer research
| Type of Wave | Tissue Penetration Depth | Resolution | Supports label-free | Supported labels | |
|---|---|---|---|---|---|
| Optical Coherence Tomography | near infrared light | 1–2 mm | 1–20 μm | Yes | nanoparticles magnetic particles near infrared dyes |
| Fluorescence Microscopy | visible/near infrared light | ~300–800 μm | 1–5 μm | Limited | visible and near infrared fluorophores |
| Ultrasound | sound | cm | 50 μm | Yes | Microbubbles |
| Computed Tomography | x-ray | no limit | 50 μm | Yes | Iodine |
| Positron Emission Tomography | gamma rays | no limit | 1–2 mm | No | Radionuclides (e.g., F-18) |
| Magnetic Resonance Imaging | RF | no limit | 10–100 μm | Yes | magnetic/paramagnetic |
| Bioluminescence | visible light | cm | 60 μm - cms | No | luciferins |
| Photoacoustic Imaging | visible/near infrared light and sound | cm | 5 μm – 1 mm | Yes | near infrared dyes nanoparticles |
Image Contrast Applications of OCT
OCT fundamentally measures how light propagates in tissue and scatters from tissue structures. Over the past decade, our ability to translate these measurements to physiological and anatomical parameters has expanded substantially. The methods relating OCT signals to anatomical measures relevant to cancer are summarized here and contrasted with similar measurements performed by alternative intravital approaches.
Microstructural imaging
Structural (anatomical) imaging is used to measure tumour volume, locate tumours anatomically, or define the tumour microenvironment. Intravital ultrasound13 and micro computed tomography (μCT)14 are commonly used for this purpose. Both have the advantage of large imaging fields and deep penetration but each is also hindered by relatively poor soft-tissue contrast that limits the interpretation of the anatomy.
Microstructural images can be generated from OCT measurements by using the log-scale magnitude of optical scattering. Because optical scattering is more varied across soft tissues than either acoustic scattering or x-ray absorption, microstructural OCT images generally provide greater contrast than ultrasound and contrast-free CT. This increases the ability to detect tumour margins, and more broadly elucidates the microenvironment at the tumour site. Because OCT penetration is limited to 2 mm, measuring the volume of larger tumours is more suited to ultrasound and CT methodologies. Microstructural OCT imaging can be performed rapidly: an 8 mm × 8 mm × 2 mm field at 10 μm resolution requires less than 5 seconds to acquire using current instrumentation14.
Viability imaging
Imaging viability within a tumour model helps to elucidate the spatially heterogeneous response to therapy. Methods for intravital imaging of viability however are limited. Micro positron emission tomography (μPET) scanners using 18-fluorodeoxyglucose (FDG) labelling can map viability in whole-body imaging studies but their limited resolution (typically greater than 1 mm) is not well matched to the size scale of tumours in small animal models15. Fluorescent deoxyglucose analogs16 have been shown to allow optical monitoring of glucose uptake activity in culture17 and in vivo18, 19, and may provide alternatives to PET-based methods. GFP expressing tumours can be used to monitor viability as the fluorescent protein carrier has an approximately 36 hour half-life20–22, but these techniques are restricted by imaging field and depth. Luciferase reporter bioluminescence (e.g., firefly, gaussia, renilla luciferase) can also be used to image cell viability at lower spatial resolutions23.
OCT can discriminate between viable and non-viable compartments of the tumour through correlated changes in optical scattering10. While the underlying changes in tissue structure that modulate optical scattering have not been identified, a correlation between high scattering and loss of viability has been confirmed by registered images and histology. However, caution must be taken when associating scattering changes to viability status as other processes could manifest similar scattering changes. OCT-based viability imaging has the advantage of being label-free, and can be easily performed concurrently with other OCT imaging modalities, e.g., microstructural imaging; both contrast methods operate on the same acquired dataset and are differentiated only by post-processing. The paucity of robust methods for imaging viability in preclinical settings makes this a compelling application for OCT.
Lymphangiography
Lymphatic vessels play a central role in solid tumour growth and metastasis24. The disruption of normal lymphatic function by solid tumours contributes to the high interstitial fluid pressure within the solid tumour and hinders convective drug transport25. On the other hand, peri-tumour lymphatic vessels provide a route for metastasis. There is therefore a need to image lymphatic vessels in solid tumour microenvironments and in response to cancer therapies. However, lymphatic imaging remains one of the most significant challenges in intravital microscopy because, unlike the blood vasculature, the lymphatic system cannot be easily labelled systemically. The most common technique currently available requires tracer injection into the site (e.g., tumour or surrounding host tissue)26. As lymphatic vessels collect and are filled with the injected tracers, they can be imaged by either wide-field cameras or fluorescent microscopy. This approach, however, only reveals a partial network and perturbs the lymphatic vessel physiology.
OCT can be used for label-free lymphangiography10, 27. Contrast for lymphatics is derived from the difference in optical scattering between lymph fluid, which is nearly transparent, and tissue, which is highly scattering. The lymphatic network appears in three-dimensional datasets as hypoechoic (low-scattering) regions; three-dimensional connectivity and characteristic valve and lymphangion morphology make identification of lymphatics relatively straightforward. Because some fraction of the lymphatic vasculature is collapsed at any given time in normal physiology, comprehensive mapping is not always possible. Higher resolution embodiments of OCT that are able to detect lymphatic vessels with smaller open luminal areas are technically feasible and would mitigate this limitation.
Angiography
Understanding tumour angiogenesis and the response of tumours to vascular targeting therapies has been a major theme in cancer research over the past decade28–30. Current approaches for intravital angiography include Doppler ultrasound, micro magnetic resonance imaging (μMRI), μCT, photoacoustic tomography31–34, and fluorescent microscopy. Of these, ultrasound, μMRI and μCT-based methods cannot resolve single vessels due to limited resolution. To date, fluorescence angiography has been adopted most broadly to study angiogenesis in tumour models at the resolution of individual vessels35. Fluorescent methods however require systemic labelling of the vasculature through intravenous injection which carries known limitations in longitudinal studies8.
Using microstructural OCT, some large vessels exceeding 100 μm in diameter can be visualized. To extend contrast to smaller vessels, alternative methods based on blood flow are commonly used in OCT. Unlike microstructural, viability, and lymphatic methods of contrast, angiographic imaging relies on the measurement of scattering dynamics. Flowing blood modulates optical scattering, and this modulation can be detected and used to differentiate between intravascular and extravascular compartments of the tumour. Unlike fluorescent approaches, OCT-based angiography is label-free. OCT and fluorescence angiography are further differentiated by their fields, imaging depths, and resolutions (see Table 1), with fluorescence microscopy providing smaller fields and higher resolution than OCT.
Unlike architectural, viability, and lymphatic OCT imaging, angiographic OCT monitors scattering changes over time and hence requires strict animal immobilization. In a typical setup, the site to be imaged must be mechanically immobilized through use of a window chamber models or other mechanical restraint. When immobilizing the site, however, care must be taken to prevent occlusion of the vasculature and loss of vascular contrast in response to mechanical pressure. Angiographic OCT methods also require longer imaging times to capture the scattering dynamics at each location. Depending on the algorithm used and blood flow sensitivity required, imaging of an 8 mm × 8mm × 2mm field at 10 μm resolution takes 1–20 minutes, compared to ~5 seconds for non-dynamic contrast modes of OCT10. Longer imaging times allow for more extensive sampling of the signal dynamics which lead to improved image contrast. Refinements in algorithms are likely to reduce this time in the near future.
Additional contrast modes in OCT
Several additional imaging contrast modes are available in OCT but are at earlier stages of development or have not yet been shown to have relevance in cancer studies, and are therefore not discussed in detail in this article. These include techniques for detecting exogenous labels which could enable OCT-based measurements of drug distribution within tumours36. Also possible is the use of OCT to identify specific tissue components, such as collagen and muscle fibres by measuring their influence on the polarization of the incident light field37. This polarization-sensitive OCT approach is relatively mature, and may find utility in probing tumour-stroma interactions. Finally, careful measurements of scattering dynamics may yield contrast for cellular processes such as apoptosis38 or allow for comprehensive quantification of blood flow velocity in a tumour vascular network.
OCT in Preclinical Cancer Research
Investigators have adopted these OCT methods to study cancer biology and evaluate drug response in preclinical settings. A survey of recent accomplishments is presented here with an emphasis on applications where OCT provided measurements that would be difficult or impossible to obtain using alternative modalities.
The utility of microstructural OCT has been demonstrated in several studies. In a first study, OCT was used to measure the volume of tumours implanted in dorsal skinfold chambers10. This study used a manual segmentation approach to delineate the tumour margins in three-dimensions (Figure 1a). From these margins, the tumour volume was calculated and used both to define consistent therapeutic start points across animals in an anti-angiogenic drug study, and to demonstrate growth delay in response to vascular endothelial growth factor receptor 2 (VEGFR2) blockade. By acquiring architectural and vascular OCT images simultaneously, the authors were further able to use these tumour margins to segment intratumoural and peritumoural vessels, allowing for differential analysis of vascular response at these sites. The expanded field, imaging depth and multimodal imaging provided by OCT make these analyses possible.
Figure 1.

Microstructural OCT imaging of tumours. (a) Using microstructural contrast, tumour tissue (an allotransplanted MCaIV mammary adenocarcinoma) can be differentiated from surrounding host subcutaneous and muscle tissues in a dorsal skinfold chamber model10. By defining the tumour margins, the three-dimensional tumour volume can be calculated. (b) Endoscopic microstructural OCT of azoxymethane-induced colorectal cancer in the mouse colon. High soft-tissue contrast and near histology resolution allows imaging of colonic epithelial microstructure12. The image shows the contrast at different tissue depths (shown in the vertical direction) versus distance along the colon (shown in the horizontal direction). Disease progression — from normal tissue to gastrointestinal intraepithelial neoplasia (GIN) to adenoma — can be monitored through hallmark modifications, such as the loss of tissue stratifications. (c) By quantifying scattering in OCT microstructural datasets, tumour viability can be monitored during cytotoxic interventions. Here, representative viability images of a LS174T human colorectal adenocarcinoma xenograft in a dorsal skinfold chamber model are presented two days following administration of diphtheria toxin (lower panel) or untreated (upper panel)10. Increases in scattering indicating significant loss of viability are evident in the diphtheria toxin administered animal. Transverse extent in a: 5 mm (x), 4.4 mm (y). Scale bars in c: 500 μm. Figure 1a and 1c are adapted from ref 10. Figure 1b is adapted from reference 12 with permission.
Microstructural OCT was also deployed endoscopically to image disease progression in induced models of colorectal cancer11. These authors were able to comprehensively map and longitudinally track disease progression in the mouse colon (Figure 1b). In this work, they also demonstrated that microstructural OCT-based contrast could be used to image nanoshells that were targeted to epidermal growth factor receptor (EGFR). This endoscopic OCT system was also combined with fluorescence imaging to correlate early disease (identified by microstructural OCT), with increased VEGFR2 expression (identified by fluorescence labelling). In these endoscopic applications, the resolution and soft tissue contrast afforded by OCT allowed detection of lesions earlier than they would be possible in μCT and μMRI.
The ability of OCT to monitor cell-targeted therapy was demonstrated by viability imaging in xenograft models given a diphtheria toxin, which served as a proxy for a tumour cell-targeted therapy. The toxicity of diphtheria toxin is highly species-specific, hence it is acutely toxic to the human tumour cells but not to the mice10. Changes in scattering within the tumour volume were quantified across time to track changes in tumour viability (Figure 1c). Again, simultaneous architectural and vascular imaging provided correlated measures of tumour volume and vascular response.
OCT-based lymphangiography has been used to map lymphatic vessels in the peri-tumour space in both dorsal skinfold chamber models and in ear models10. Quantification of peri-tumour lymphatic hyperplasia was shown to be correlated with the distance to the tumour margin in human sarcoma models, and longitudinal tracking of single peri-tumour lymphatic vessels was demonstrated10.
Some of the most compelling applications of OCT in preclinical cancer research have been in the area of angiography. The ability of OCT to repeatedly image over broad fields makes it ideal for studies of tumour angiogenesis and vascular response across a variety of sites10. In a recent study, a novel therapeutic strategy using a bioengineered von Hippel-Lindau (VHL) protein was used to induce degradation of hypoxia-inducible factor 1α (HIF1α) and HIF2α. OCT was employed to characterize angiogenesis in xenograft models treated by this VHL protein39. In combination with fluorescence microscopy, which was used to confirm adenovirus delivery of the VHL protein, the study demonstrated robust inhibition of angiogenesis and increased tumour necrosis following treatment. In a further example of hybrid studies combining OCT with other modalities, an instrument capable of dynamically imaging oxygen supply and demand in tumours was demonstrated40. Here, OCT was used to measure blood flow while spectroscopic techniques provided measures of blood oxygenation (using hemoglobin spectroscopy) and metabolic demand (using “redox ratio” fluorescence measurements).
The wide-field imaging of OCT reveals the morphological nature of tumour vascular networks with a unique clarity. This capability was used to highlight the significant role of the microenvironment on tumour vasculature (Figure 2)10. Frequent repeated angiography — which is not practical using fluorescence microscopy due to imaging time and accumulation of extravasated label — is possible using OCT. OCT techniques were used to perform time-lapse angiography and microstructural imaging of tumours in response to VEGFR2 blockade10 (Supplementary information S1 (movie)). OCT imaging was performed every two hours for a period of 48 hours to capture the rapid vascular changes induced by VEGFR2 blockade. Microstructural imaging confirmed that, despite these vascular changes, the vascular-targeted therapy did not affect the tumour growth during this time.
Figure 2.

Imaging of tumour angiogenesis using OCT. OCT-based angiography reveals strikingly different vascular networks in an MCaIV murine mammary carcinoma grown in different anatomical sites. Scale bars, 500 μm. In these images, three-dimensional vascular signals are projected into a single image and the colormap is used to encode the vessel depth. Reproduced from 10.
OCT in clinical treatment response monitoring
Many preclinical imaging approaches, while very effective, are not translatable because they rely on genetic modifications or would require regulatory approval of a new label. OCT has moved rapidly into diagnostic applications largely because it is label-free and thereby circumvents these translational challenges. With the growth in OCT-based imaging of cancer demonstrated in preclinical settings, there is a strong argument for efforts to translate OCT to clinical monitoring of cancer therapies. Early work has demonstrated in animal models that OCT-based angiography can provide sensitive feedback on the effect of photodynamic therapy in models of prostate cancer and oesophageal carcinoma41–44. Efforts to translate OCT techniques to clinical response monitoring are now underway.
Conclusions and Perspectives
OCT is an established diagnostic method and is being increasingly adopted in preclinical cancer research. OCT provides imaging capabilities that fill specific gaps left by existing intravital approaches, and may therefore become a commonplace technology in the biological laboratory. Of course, the anatomical contrast provided by OCT would be complemented by the molecular insight provided by labelled approaches. Multi-modality imaging should therefore be used in preclinical settings. The growth of both the research and commercial industry backing OCT will continue to yield advances in performance and broaden access to the instrumentation, further driving adoption.
A need for imaging biomarkers in cancer offers an exciting role for OCT in clinical therapy monitoring. Currently, vascular imaging biomarkers derived from clinical whole-body imaging modalities such as MRI are used to assess therapies45–49. With the development of appropriate probes, it may be possible to use OCT techniques to provide a higher resolution visualization of the vasculature within tumours. Early studies that confirm a correlation between OCT-derived images and therapeutic response are needed. Accessible cancers that require minimal probe development, such as skin and oral cancers, may present near-term opportunities for these studies.
Supplementary Material
An MCaIV tumour allograft implanted in the dorsal skinfold chamber. OCT imaging was performed every two hours for a period of 48 hours. The movie shows the rapid vascular changes that are induced by VEGFR2 blockade through treatment with DC101. Movie is reproduced from Ref 10.
Acknowledgments
National Institute of Health grants 5K25CA127465 (B. J. Vakoc), P41-RR032042 (B. J. Vakoc and B. E. Bouma), P01-CA080124 (R. K. Jain and D. Fukumura), R01-CA126642 (R. K. Jain), R01-CA096915 (D. Fukumura), S10-RR027070 (D. Fukumura), a Federal Share Income Grant (R. K. Jain and D. Fukumura), and Department of Defense Breast Cancer Research Innovator Award W81XWH-10-1-0016 (R. K. Jain).
Biographies
Benjamin J. Vakoc, PhD, is an Assistant Professor of Dermatology and Health Sciences and Technology, Harvard Medical School, and an assistant Physicist at the Massachusetts General Hospital. Dr. Vakoc completed graduate work in applied physics at Stanford University, and postdoctoral training at the Wellman Center for Photomedicine at the Massachusetts General Hospital. Dr. Vakoc current operates a research laboratory at the Wellman Center where he focuses efforts on the development and translation of optical imaging technologies to applications in biology and medicine.
Rakesh K. Jain, PhD, is the Andrew Werk Cook Professor of Tumor Biology in the Department of Radiation Oncology at Harvard Medical School, and the Director of the Edwin L. Steele Laboratory of Tumor Biology at Massachusetts General Hospital. He has published more than 550 papers in in vivo imaging, tumor biology, drug delivery, bioengineering and bench-to-bedside translation. His work on in vivo imaging has provided unprecedented insight into the biology and treatment of cancer. He is a member of all three US National Academies - the Institute of Medicine, the National Academy of Engineering and the National Academy of Sciences.
Dai Fukumura, MD, PhD, is an Associate Professor and the Deputy Director of the Edwin L. Steele Laboratory, Department of Radiation Oncology, Massachusetts General Hospital and Harvard Medical School. He is an internationally recognized expert in imaging, angiogenesis, vascular and tumor biology. Dr. Fukumura and his collaborators have developed various innovative intravital optical imaging techniques and have been studying role of tumor-host interactions in angiogenesis, tumor growth, metastasis and treatment response; role of nitric oxide in vessel formation, function and normalization; probing and exploiting tumor microenvironment using nanotechnology; role of obesity in angiogenesis and tumor progression; and tissue-engineered blood vessels.
Brett E. Bouma, PhD, is a Professor of Dermatology and Health Sciences and Technology, Harvard Medical School, and a Physicist at the Massachusetts General Hospital. Following the completion of his graduate work in physics, Dr. Bouma entered a post-doctoral fellowship in the EECS department at MIT where he continued his work with ultrafast lasers and began to explore applications in medicine and biology. Since starting a lab at MGH in 1998, he has focused his research on the development and clinical application of novel optical technologies for diagnosis and therapy. Professor Bouma is a Fellow of the Optical Society of America.
References
- 1.Huang D, et al. Optical coherence tomography. Science. 1991;254:1178–1181. doi: 10.1126/science.1957169. [DOI] [PMC free article] [PubMed] [Google Scholar]
- 2.Bouma BE, Yun SH, Vakoc BJ, Suter MJ, Tearney GJ. Fourier-domain optical coherence tomography: recent advances toward clinical utility. Current Opinion in Biotechnology. 2009;20:111–118. doi: 10.1016/j.copbio.2009.02.007. [DOI] [PMC free article] [PubMed] [Google Scholar]
- 3.Wojtkowski M. High-speed optical coherence tomography: basics and applications. Applied Optics. 2010;49:D30–D61. doi: 10.1364/AO.49.000D30. [DOI] [PubMed] [Google Scholar]
- 4.Zysk AM, Nguyen FT, Oldenburg AL, Marks DL, Boppart SA. Optical coherence tomography: a review of clinical development from bench to bedside. Journal of Biomedical Optics. 2007;12:051403–21. doi: 10.1117/1.2793736. [DOI] [PubMed] [Google Scholar]
- 5.Gabriele ML, et al. Optical Coherence Tomography: History, Current Status, and Laboratory Work. Investigative Ophthalmology & Visual Science. 2011;52:2425–2436. doi: 10.1167/iovs.10-6312. [DOI] [PMC free article] [PubMed] [Google Scholar]
- 6.Suter MJ, et al. Intravascular Optical Imaging Technology for Investigating the Coronary Artery. J Am Coll Cardiol Img. 2011;4:1022–1039. doi: 10.1016/j.jcmg.2011.03.020. [DOI] [PMC free article] [PubMed] [Google Scholar]
- 7.Leunig M, et al. Angiogenesis, microvascular architecture, microhemodynamics, and interstitial fluid pressure during Early Growth of Human Adenocarcinoma LS174T in SCID Mice. Cancer Research. 1992;52:6553–6560. [PubMed] [Google Scholar]
- 8.Brown E, Munn LL, Fukumura D, Jain RK. In Vivo Imaging of Tumors. Cold Spring Harbor Protocols. 2010;2010:5452. doi: 10.1101/pdb.prot5452. [DOI] [PMC free article] [PubMed] [Google Scholar]
- 9.Hak S, Reitan N, Haraldseth O, de Lange Davies C. Intravital microscopy in window chambers: a unique tool to study tumor angiogenesis and delivery of nanoparticles. Angiogenesis. 2010;13:113–130. doi: 10.1007/s10456-010-9176-y. [DOI] [PubMed] [Google Scholar]
- 10.Vakoc BJ, et al. Three-dimensional microscopy of the tumor microenvironment in vivo using optical frequency domain imaging. Nature Medicine. 2009;15:1219–1223. doi: 10.1038/nm.1971. [DOI] [PMC free article] [PubMed] [Google Scholar]
- 11.Winkler A, et al. In Vivo, Dual-Modality OCT/LIF Imaging Using a Novel VEGF Receptor-Targeted NIR Fluorescent Probe in the AOM-Treated Mouse Model. Molecular Imaging and Biology. 2010 Jan 10; doi: 10.1007/s11307-010-0450-6. [DOI] [PMC free article] [PubMed] [Google Scholar]
- 12.Winkler A, Rice P, Drezek R, Barton J. Quantitative tool for rapid disease mapping using optical coherence tomography images of azoxymethane-treated mouse colon. Journal of Biomedical Optics. 2010;15:041512. doi: 10.1117/1.3446674. [DOI] [PMC free article] [PubMed] [Google Scholar]
- 13.Jugold M, et al. Volumetric high-frequency Doppler ultrasound enables the assessment of early antiangiogenic therapy effects on tumor xenografts in nude mice. European Radiology. 2008;18:753–758. doi: 10.1007/s00330-007-0825-5. [DOI] [PubMed] [Google Scholar]
- 14.Badea CT, Drangova M, Holdsworth DW, Johnson GA. Physics in Medicine and Biology. 2008:R319. doi: 10.1088/0031-9155/53/19/R01. [DOI] [PMC free article] [PubMed] [Google Scholar]
- 15.Condeelis J, Weissleder R. In Vivo Imaging in Cancer. Cold Spring Harbor Perspectives in Biology. 2010;2 doi: 10.1101/cshperspect.a003848. [DOI] [PMC free article] [PubMed] [Google Scholar]
- 16.Yoshioka K, et al. A novel fluorescent derivative of glucose applicable to the assessment of glucose uptake activity of Escherichia coli. Biochim Biophys Acta. 1996;1289:5–9. doi: 10.1016/0304-4165(95)00153-0. [DOI] [PubMed] [Google Scholar]
- 17.O’Neil R, Wu L, Mullani N. Uptake of a Fluorescent Deoxyglucose Analog (2-NBDG) in Tumor Cells. Molecular Imaging and Biology. 2005;7:388–392. doi: 10.1007/s11307-005-0011-6. [DOI] [PubMed] [Google Scholar]
- 18.Sheth RA, Josephson L, Mahmood U. Evaluation and clinically relevant applications of a fluorescent imaging analog to fluorodeoxyglucose positron emission tomography. Journal of Biomedical Optics. 2009;14:064014–8. doi: 10.1117/1.3259364. [DOI] [PMC free article] [PubMed] [Google Scholar]
- 19.Nitin N, et al. Molecular imaging of glucose uptake in oral neoplasia following topical application of fluorescently labeled deoxy-glucose. International Journal of Cancer. 2008;124:2634–2642. doi: 10.1002/ijc.24222. [DOI] [PMC free article] [PubMed] [Google Scholar]
- 20.Corish P, Tyler-Smith C. Attenuation of green fluorescent protein half-life in mammalian cells. Protein Engineering. 1999;12:1035–1040. doi: 10.1093/protein/12.12.1035. [DOI] [PubMed] [Google Scholar]
- 21.Elliott G, McGrath J, Crockett-Torabi E. Green Fluorescent Protein: A Novel Viability Assay for Cryobiological Applications. Cryobiology. 2000;40:360–369. doi: 10.1006/cryo.2000.2258. [DOI] [PubMed] [Google Scholar]
- 22.Baumstark-Khan C, et al. Green Fluorescent Protein (GFP) as a Marker for Cell Viability After UV Irradiation. Journal of Fluorescence. 1999;9:37–43. [Google Scholar]
- 23.Chung E, et al. Secreted Gaussia Luciferase as a Biomarker for Monitoring Tumor Progression and Treatment Response of Systemic Metastases. PLoS ONE. 2009;4:e8316 EP. doi: 10.1371/journal.pone.0008316. [DOI] [PMC free article] [PubMed] [Google Scholar]
- 24.Hagendoorn J, et al. Onset of Abnormal Blood and Lymphatic Vessel Function and Interstitial Hypertension in Early Stages of Carcinogenesis. Cancer Research. 2006;66:3360–3364. doi: 10.1158/0008-5472.CAN-05-2655. [DOI] [PubMed] [Google Scholar]
- 25.Jain RK. Taming vessels to treat cancer. Scientific American. 2008;298:56–63. doi: 10.1038/scientificamerican0108-56. [DOI] [PubMed] [Google Scholar]
- 26.Isaka N, Padera T, Hagendoorn J, Fukumura D, Jain RK. Peritumor Lymphatics Induced by Vascular Endothelial Growth Factor-C Exhibit Abnormal Function. Cancer Research. 2004;64:4400–4404. doi: 10.1158/0008-5472.CAN-04-0752. [DOI] [PubMed] [Google Scholar]
- 27.Jung Y, Zhi Z, Wang R. Three-dimensional optical imaging of microvascular networks within intact lymph node in vivo. Journal of Biomedical Optics. 2010;15:050501–050503. doi: 10.1117/1.3496301. [DOI] [PMC free article] [PubMed] [Google Scholar]
- 28.Hanahan D, Weinberg Robert A. Cell. Cell Press; 2011. pp. 646–674. [DOI] [PubMed] [Google Scholar]
- 29.Carmeliet P, Jain RK. Molecular mechanisms and clinical applications of angiogenesis. Nature. 2011;473:298–307. doi: 10.1038/nature10144. [DOI] [PMC free article] [PubMed] [Google Scholar]
- 30.Potente M, Gerhardt H, Carmeliet P. Cell. Cell Press; 2011. pp. 873–887. [DOI] [PubMed] [Google Scholar]
- 31.Hu S, Wang LV. Photoacoustic imaging and characterization of the microvasculature. Journal of Biomedical Optics. 2010;15:011101–15. doi: 10.1117/1.3281673. [DOI] [PMC free article] [PubMed] [Google Scholar]
- 32.Wang LV. Multiscale photoacoustic microscopy and computed tomography. Nature Photonics. 2009;3:503–509. doi: 10.1038/nphoton.2009.157. [DOI] [PMC free article] [PubMed] [Google Scholar]
- 33.Su JL, et al. Advances in clinical and biomedical applications of photoacoustic imaging. Expert Opin Med Diagn. 2010;4:497–510. doi: 10.1517/17530059.2010.529127. [DOI] [PMC free article] [PubMed] [Google Scholar]
- 34.Li ML, et al. Simultaneous Molecular and Hypoxia Imaging of Brain Tumors In Vivo Using Spectroscopic Photoacoustic Tomography. Proceedings of the IEEE. 2008;96:481–489. [Google Scholar]
- 35.Brown E, et al. In vivo measurement of gene expression, angiogenesis and physiological function in tumors using multiphoton laser scanning microscopy. Nature Medicine. 2001;7:864–868. doi: 10.1038/89997. [DOI] [PubMed] [Google Scholar]
- 36.Boppart SA, Oldenburg AL, Xu C, Marks DL. Optical probes and techniques for molecular contrast enhancement in coherence imaging. Journal of Biomedical Optics. 2005;10:041208–14. doi: 10.1117/1.2008974. [DOI] [PubMed] [Google Scholar]
- 37.de Boer J, Milner T. Review of polarization sensitive optical coherence tomography and Stokes vector determination. Journal of Biomedical Optics. 2002;7:359–371. doi: 10.1117/1.1483879. [DOI] [PubMed] [Google Scholar]
- 38.Farhat G, Mariampillai A, Yang VXD, Czarnota GJ, Kolios MC. Detecting apoptosis using dynamic light scattering with optical coherence tomography. Journal of Biomedical Optics. 2012;16:070505–3. doi: 10.1117/1.3600770. [DOI] [PubMed] [Google Scholar]
- 39.Sufan R, et al. Oxygen-independent degradation of HIF-α via bioengineered VHL tumour suppressor complex. EMBO Molecular Medicine. 2009;1:66–78. doi: 10.1002/emmm.200900004. [DOI] [PMC free article] [PubMed] [Google Scholar]
- 40.Skala M, Fontanella A, Lan L, Izatt J, Dewhirst M. Longitudinal optical imaging of tumor metabolism and hemodynamics. Journal of Biomedical Optics. 2010;15:011112–011118. doi: 10.1117/1.3285584. [DOI] [PMC free article] [PubMed] [Google Scholar]
- 41.Standish B, et al. Interstitial Doppler Optical Coherence Tomography as a Local Tumor Necrosis Predictor in Photodynamic Therapy of Prostatic Carcinoma: An In vivo Study. Cancer Research. 2008;68:9987–9995. doi: 10.1158/0008-5472.CAN-08-1128. [DOI] [PubMed] [Google Scholar]
- 42.Standish BA, et al. Interstitial Doppler optical coherence tomography monitors microvascular changes during photodynamic therapy in a Dunning prostate model under varying treatment conditions. Journal of Biomedical Optics. 2007;12:034022–7. doi: 10.1117/1.2744068. [DOI] [PubMed] [Google Scholar]
- 43.Standish BA, et al. Gastrointestinal Endoscopy. Mosby Yearbook; 2007. pp. 326–333. [Google Scholar]
- 44.Li H, et al. Feasibility of interstitial Doppler optical coherence tomography for in vivo detection of microvascular changes during photodynamic therapy. Lasers Surg Med. 2006;38:754–761. doi: 10.1002/lsm.20387. [DOI] [PubMed] [Google Scholar]
- 45.Pircher A, et al. Biomarkers in Tumor Angiogenesis and Anti-Angiogenic Therapy. International Journal of Molecular Sciences. 2011;12:7077–7099. doi: 10.3390/ijms12107077. [DOI] [PMC free article] [PubMed] [Google Scholar]
- 46.Jain RK, et al. Biomarkers of response and resistance to antiangiogenic therapy. Nature Reviews Clinical Oncology. 2009;6:327–338. doi: 10.1038/nrclinonc.2009.63. [DOI] [PMC free article] [PubMed] [Google Scholar]
- 47.Batchelor TT, et al. Phase II Study of Cediranib, an Oral Pan Vascular Endothelial Growth Factor Receptor Tyrosine Kinase Inhibitor, in Patients With Recurrent Glioblastoma. Journal of Clinical Oncology. 2010;28:2817–2823. doi: 10.1200/JCO.2009.26.3988. [DOI] [PMC free article] [PubMed] [Google Scholar]
- 48.Sorensen AG, et al. A “Vascular Normalization Index” as Potential Mechanistic Biomarker to Predict Survival after a Single Dose of Cediranib in Recurrent Glioblastoma Patients. Cancer Research. 2009;69:5296–5300. doi: 10.1158/0008-5472.CAN-09-0814. [DOI] [PMC free article] [PubMed] [Google Scholar]
- 49.Sorensen AG, et al. Increased Survival of Glioblastoma Patients who Respond to Anti-angiogenic Therapy with Elevated Blood Perfusion. Cancer Research. 2012;72:402–7. doi: 10.1158/0008-5472.CAN-11-2464. [DOI] [PMC free article] [PubMed] [Google Scholar]
Associated Data
This section collects any data citations, data availability statements, or supplementary materials included in this article.
Supplementary Materials
An MCaIV tumour allograft implanted in the dorsal skinfold chamber. OCT imaging was performed every two hours for a period of 48 hours. The movie shows the rapid vascular changes that are induced by VEGFR2 blockade through treatment with DC101. Movie is reproduced from Ref 10.