

Abstract
Background: Chronic Fatigue Syndrome case designation criteria are scored as physicians’ subjective, nominal interpretations of patient fatigue, pain (headaches, myalgia, arthralgia, sore throat and lymph nodes), cognitive dysfunction, sleep and exertional exhaustion. Methods: Subjects self-reported symptoms using an anchored ordinal scale of 0 (no symptom), 1 (trivial complaints), 2 (mild), 3 (moderate), and 4 (severe). Fatigue of 3 or 4 distinguished “Fatigued” from “Not Fatigued” subjects. The sum of the 8(Sum8) ancillary criteria was tested as a proxy for fatigue. All subjects had history and physical examinations to exclude medical fatigue, and ensure categorization as healthy or CFS subjects. Results: Fatigued subjects were divided into CFS with ≥4 symptoms or Chronic Idiopathic Fatigue (CIF) with ≤3 symptoms. ROC of Sum8 for CFS and Not Fatigued subjects generated a threshold of 14 (specificity=0.934; sensitivity=0.928). CFS (n=256) and CIF (n=55) criteria were refined to include Sum8≥14 and ≤13, respectively. Not Fatigued subjects had highly skewed Sum8 responses. Healthy Controls (HC; n=269) were defined by fatigue≤2 and Sum8≤13. Those with Sum8≥14 were defined as CFS–Like With Insufficient Fatigue Syndrome (CFSLWIFS; n=20). Sum8 and Fatigue were highly correlated (R2=0.977; Cronbach’s alpha=0.924) indicating an intimate relationship between symptom constructs. Cluster analysis suggested 4 clades each in CFS and HC. Translational utility was inferred from the clustering of proteomics from cerebrospinal fluid. Conclusions: Plotting Fatigue severity versus Sum8 produced an internally consistent classifying system. This is a necessary step for translating symptom profiles into fatigue phenotypes and their pathophysiological mechanisms.
Keywords: Fatigue, pain, fibromyalgia, myalgic encephalomyelitis, proteomics
Introduction
Chronic Fatigue Syndrome (CFS) has been defined by having 6 months of significant fatigue and disability with no medical, psychiatric or other explanation plus at least 4 of the following 8 ancillary criteria: (i) problems with memory or concentration, (ii) sore throat, (iii) tender lymph node regions, (iv) myalgia, (v) arthralgia, (vi) headaches, (vii) sleep disturbances, and (viii) exertional exhaustion [1]. These epidemiologically derived variables have not been unified by any single underlying pathophysiological process. Ambiguity is increased by using subjective assessments of each criterion with nominal (present vs. absent) scaling and no gradation for symptom severity [2-4]. Physicians may have preexisting experiences, biases, and knowledge bases that lead to non-standardized symptom assessment and CFS case designation. Several studies have noted the heterogeneity of clinical presentations, and proposed that subtypes of CFS may be defined by specific patterns of these criteria and other variables [5-7]. It has been difficult to prospectively test whether these subtypes can be reproduced or replicated in multiple centers [8-11]. It is not clear how stable these crosssectional characterizations are in longitudinal analysis because the long term natural history of CFS has not been well described [12]. Differentiation from psychiatric (i.e. depression), medically-related, and Chronic Idiopathic Fatigue (CIF) [13-17], and the absence of prospectively verified functional tests, molecular or genetic biomarkers with high sensitivity and specificity for CFS [18-22] complicates the diagnostic process. Treatments cannot be standardized or assayed if the diagnosis is subjective and its severity unscaled, and if treatable components such as autonomic dysfunction, migraine, and other elements are not included in the diagnostic framework [5,23-25].
The CFS Symptom Severity Score was created as a starting point for dissecting these difficult problems [26-31]. Healthy and CFS subjects rated the severity of their fatigue and the 8 ancillary criteria for the previous 6 months. They scored 0 for no symptom, 1 for trivial, 2 for mild, 3 for moderate and 4 for severe. It was accepted that recall bias and interindividual differences in self-assessed symptom severity gradients may affect the responses. However, biases due to physician interpretation of complaint severity or skepticism about the syndrome were eliminated.
Analysis began by using fatigue scores of 3 or 4 to separate “Fatigued” from “Not Fatigued” subjects. The Fatigued group was divided into CFS and CIF. CFS subjects were required to have at least 4 ancillary criteria [1] scored as (2) mild, (3) moderate or (4) severe. By default, CIF was defined by having ≤ 3 ancillary complaints at these severity levels. Subjects with fatigue severity of 0, 1 or 2 (mild) were designated as Not Fatigued.
Analysis evolved by assessing if the sum of the 8 ancillary criteria (Sum8) could serve as a proxy for fatigue. It was presumed that these symptoms represented manifestations of dysfunctional CFS - related mechanisms. Receiver operator analysis of Sum8 from Not Fatigued and CFS groups established a threshold to assist in defining diagnostic categories. The Sum8 threshold separated the Not Fatigued group into subjects with low fatigue and ancillary complaints (“Healthy Control”, HC), and those with abundant CFS – like ancillary complaints. The latter group was defined as CFS - like with insufficient fatigue syndrome (CFSLWIFS) [2-4]. CFS and CIF were then reassessed and differentiated by the number (≥ 4) of significant criteria and Sum8 above or below the threshold, respectively. Cluster analysis using the 9 CFS criteria scores explored the possibility of coherent phenotypic subgroups within the CFS and HC groups. Subtypes with significantly distinct criteria may have specific pathophysiological mechanisms. This was suggested when cerebrospinal fluid proteomics results were found to be clustered according to the CFS clades.
Three consecutive cohorts of subjects were recruited. Candidates with chronic medical or psychiatric illnesses were excluded by history and physical examinations. The results from the cohorts 1 and 2 were comparable and so their analysis was combined. There were approximately equal numbers of HC and CFS subjects. Because this was not a population – based epidemiological study, CIF and CFSLWIFS subjects were underrepresented.
Questionnaire performance was assessed in a third cohort that included longitudinal follow-up of CFS subjects, the positive illness control group of Gulf War Illness subjects who share a similar symptom profile to CFS, and negative illness control group of Type II diabetes mellitus subjects who have life - disrupting quality of life but are excluded from CFS case designation.
Materials and methods
Subjects
All subjects gave signed informed consent for use of questionnaire results in illness evaluations. All protocols, advertisements and instruments were approved by the Georgetown University Institutional Review Board.
Cohort 1 of CFS and healthy control (HC) subjects were recruited to a series of CFS, fibromyalgia [41], Chronic Multisymptom Illness [40] and airway physiology clinical research investigations [26-31] using posters and newspaper advertisements, and from tertiary care medical clinics. Applicants had history and physical examinations to exclude chronic medical, psychiatric, and other causes of fatigue before clinical designation of CFS and HC status [14]. Subjects completed paper copies of the CFS Severity Score questionnaire [26-30], Medical Outcomes Survey Short Form 36 question (SF-36), [33,34] Multidimensional Fatigue Inventory (MFI), [32] and short-form McGill Pain Questionnaire, [35] to corroborate fatigue components, disability, altered quality of life and pain. The Irritant Rhinitis Questionnaire assessed perceptions of sensory sensitivity to 8 inhaled and ingested irritants [26-28]. Some Cohort 1 subjects did not complete all of these questionnaires. Results were hand entered into Excel, the input validated, and then evaluated in Excel and SPSS for differences between the fatigued and not fatigued subgroups.
After evaluation of Cohort 1 results, Cohort 2 was recruited by posters, advertisements, and on-line media. Cohort 2 had a more elaborate evaluation with additional questionnaires. Participants had the opportunity to complete these questionnaires on-line at their leisure using our Google-based eZhengtricity© system. [53,54] Each subject logged onto a secure website, [54] entered their personal log-in, password, and confidential study specific identification code in order to access and complete each questionnaire. Responses entered our secure database in real-time. The response rate was 100%. No personal identifying information was collected in this way.
History, physical examination, HIV, pregnancy, complete blood count, chemistries, transaminases, sedimentation rate, C-reactive protein, antinuclear antibody and rheumatoid factor were assessed as exclusionary tests. These data and personal identifying information were stored in paper charts in locked locations. CFS and HC diagnosis was always based on history and physical examinations.
Gulf War Illness, Type II diabetes, and nondiabetic control subjects took part in other Institutional Review Board approved studies.
CFS symptom severity score
The CFS Severity Score was a self-administered, recall-biased assessment of overall complaints for the previous 6 month period. Fatigue and the 8 minor criteria were scored as none (score = 0), trivial (score = 1), mild (score = 2), moderate (score = 3) and severe (score = 4). [26-31] Trivial was an important anchor [55,56] since it allowed subjects to indicate minor complaints that were infrequent and did not need interventions, but which may have been scored as mild severity on other instruments. Interviews revealed that subjects interpreted categories of mild, moderate and severe as more persistent, symptomatic complaints requiring investigation, lifestyle changes or treatments. “Significant” Fatigue sufficient to designate the presence of CFS or CIF was defined by moderate (score = 3) or severe (score = 4) complaints. For each of the 8 ancillary criteria, complaints of mild (score = 2) and greater severity were considered “significant” and sufficient for CFS attribution. The use of “mild” as a threshold for inclusion in the CFS case designation group was justified by separating the Fatigued (fatigue score = 3 or 4) from Not Fatigued (scores = 0, 1 or 2; HC) subsets (see Results). Subjects with significant fatigue (score = 3 or 4) but ≤ 3 ancillary criteria were considered CIF [1]. CIF formed a small group in this tertiary care population recruited specifically as CFS and healthy control subjects.
Sum of 8
The sum of the 8 ancillary variables (Sum8) was calculated for each individual. Receiver operator analysis of Sum8 from HC and CFS subjects defined a threshold that distinguished CFSLWIFS from HC, and CIF from CFS. Relationships between Fatigue and Sum8 were assessed by Spearman’s correlations from all study subjects.
Statistical approach
Severity Scores, age and gender were compared between CFS, CIF [13] and HC subsets using ANOVA with Tukey’s honest significant difference (HSD), [57,58] univariate Spearman’s correlations, and Fisher’s Exact Test as appropriate (IBM SPSS.v20, Armonk, NY). Outcomes were reported as the mean [95% confidence interval]. General linear regression models with backwards elimination were used to assess the age, gender, age x gender cross-product, and ancillary criteria scores that were most correlated with fatigue and Sum8 within the CFS and HC groups. Results from Cohort 1 and Cohort 2 were highly comparable. Age and gender were not significant variables. Therefore, data from all subjects were combined into a Cohort 1&2 group for further analysis. After application of our derived defining conditions, results for the HC, CFSLWIFS, CIF and CFS groups were assessed by one-way ANOVA followed by Tukey’s test to assess differences between these groups. Multivariate linear regression was redone for the combined group.
Subset clades within the HC and CFS groups were investigated by unsupervised hierachical clustering using Ward’s method with squared Euclidean distances. CFS symptoms that significantly discriminated between clusters were determined by one-way ANOVA and Tukey’s test. In general, the individual subgroups or clades that were significantly different from all of its comparators were of most interest. Analysis was performed with Microsoft Excel, SPSS, and MatLab.
STROBE Statement checklist terms were used to guide the preparation of this manuscript [59].
Results
Initial trends
Cohort 1 (n = 411) was younger and had a higher proportion of women than Cohort 2 (n = 189; p < 0.001 by Fisher’s Exact test) (Table 1). However, when fatigue severity was compared between the Not Fatigued and Fatigued groups within Cohort 1 and Cohort 2 by multivariate analysis, then age, gender, and age x gender cross-product were not significantly different. Fatigue, the 8 ancillary criteria, Sum8 and the number of responses with severity scores of 2, 3 or 4 were all significantly higher in Fatigued than Not Fatigued groups (p < 10-10 by Tukey’s tests after significant ANOVAs). As a result, data from Cohorts 1 and 2 were combined into Cohort 1&2 for the rest of the analysis.
Table 1.
Comparisons between Not Fatigued and Fatigued groups with Cohort 1, 2 and 1&2. Data were shown for age, gender, each of the CFS Severity Scores, Sum8, and the number of ancillary symptoms scored at severities of 2, 3 or 4 (mean [95% confidence interval]. All symptom scores were significantly different between Not Fatigued and Fatigued groups (p < 10-10 by Tukey’s test after significant ANOVA)
| Cohort | Cohort 1 | Cohort 2 | Cohorts 1 & 2 | |||
|---|---|---|---|---|---|---|
|
| ||||||
| Group | Not Fatigued | Fatigued | Not Fatigued | Fatigued | Not Fatigued | Fatigued |
| N | 234 | 177 | 55 | 134 | 289 | 311 |
| Age | 37.9 [36.0-39.8] | 45.4 [43.6-47.2] | 46.6 [42.8-50.4] | 48.5 [46.7-50.3] | 40.1 [38.3-41.9] | 46.8 [45.5-48.1] |
| % Male | 33.3%* | 14.7%* | 56.4% | 46.2% | 40.5%* | 28.0%* |
| Fatigue | 0.68 [0.57-0.79] | 3.49 [3.42-3.56] | 0.75 [0.54-0.96] | 3.59 [3.51-3.67] | 0.69 [0.60-0.78] | 3.53 [3.47-3.59] |
| Memory | 0.64 [0.51-0.77] | 2.64 [2.47-2.81] | 0.76 [0.49-1.03] | 2.85 [2.67-3.03] | 0.66 [0.54-0.78] | 2.73 [2.60-2.86] |
| Sore throat | 0.50 [0.38-0.62] | 1.44 [1.26-1.62] | 0.25 [0.08-0.42] | 1.38 [1.19-1.57] | 0.45 [0.35-0.55] | 1.41 [1.28-1.54] |
| Lymph nodes | 0.25 [0.16-0.34] | 1.13 [0.94-1.32] | 0.09 [0.00-0.20] | 1.31 [1.09-1.53] | 0.22 [0.14-0.30] | 1.21 [1.06-1.36] |
| Myalgia | 0.63 [0.50-0.76] | 2.85 [2.65-3.05] | 0.78 [0.48-1.08] | 3.04 [2.84-3.24] | 0.66 [0.54-0.78] | 2.93 [2.79-3.07] |
| Arthralgia | 0.57 [0.44-0.70] | 2.29 [2.07-2.51] | 0.89 [0.60-1.18] | 2.75 [2.53-2.97] | 0.63 [0.51-0.75] | 2.48 [2.32-2.64] |
| Headache | 0.83 [0.68-0.98] | 2.47 [2.28-2.66] | 0.80 [0.50-1.10] | 2.58 [2.36-2.80] | 0.83 [0.70-0.96] | 2.51 [2.37-2.65] |
| Sleep | 1.00 [0.84-1.16] | 3.11 [2.94-3.28] | 1.09 [0.76-1.42] | 3.48 [3.34-3.62] | 1.02 [0.87-1.17] | 3.27 [3.16-3.38] |
| Exertional exhaustion | 0.39 [0.28-0.50] | 2.80 [2.61-2.99] | 0.64 [0.36-0.92] | 3.32 [3.14-3.50] | 0.44 [0.34-0.54] | 3.02 [2.88-3.16] |
| Sum8 | 4.81 [4.14-5.48] | 18.74 [17.81-19.67] | 5.31 [3.90-6.72] | 20.69 [19.70-21.68] | 4.91 [4.31-5.51] | 19.57 [18.88-20.26] |
| Responses of 2, 3 or 4 | 1.4 [1.2-1.6] | 5.8 [5.5-6.1] | 1.6 [1.1-2.1] | 6.2 [5.9-6.5] | 1.4 [1.2-1.6] | 6.0 [5.8-6.2] |
p < 0.001 by Fisher’s Exact Test within each cohort.
Cohort 1&2 subject classification by fatigue severity and Sum8
The Not Fatigued group was defined by fatigue levels of 0 (none), 1 (trivial) or 2 (mild) (n = 289) (Figure 1). The most frequent score was 0 for fatigue and 0 for Sum8 (13.1% of Cohort 1&2). The distribution of Sum8 was unimodal but highly skewed (kurtosis 18.4; skewness 3.02), and it extended as high as 25 out of 32. There was a spline suggesting a trend that correlated fatigue with Sum8 scores.
Figure 1.

Distribution of Sum8 for each Fatigue Score in Cohort 1 & 2. The study population was divided into not fatigued (HC), chronic idiopathic fatigue (CIF), and Chronic Fatigue Syndrome (CFS) groups. The nonfatigued group was defined by fatigue levels of 0 (none, red bars), 1 (trivial, gold bars) or 2 (mild, pink bars). The most frequent score was 0 for fatigue and 0 for Sum8 (13.1% of Cohort 1&2). The perspective was optimized to show the scatter of Sum8 for HC. The CIF group had fatigue scores of 3 (moderate, yellow cylinders) or 4 (severe, green cylinders) and ≤ 3 ancillary criteria with severity scores of 2, 3 or 4. The highest Sum8 score in the CIF group was 15. At this initial stage, CFS was defined by moderate (3, aqua bars) or severe (4, blue bars) fatigue plus at least 4 ancillary criteria with severities of 2, 3 or 4. Receiver operator analysis of Sum8 set the threshold between HC and CFS at 14 (blue arrow). The overall distribution of data was unique to Cohort 1&2 as this was not a population - based epidemiology study.
The Fatigued group (n = 311) was divided into CIF and CFS. The CIF group had fatigue scores of 3 (moderate) or 4 (severe), and ≤ 3 ancillary criteria with severity scores of 2, 3 or 4. The highest Sum8 score in the CIF group was 15. The CIF group was small because the original recruitment strategy targeted healthy control and CFS subjects. The Sum8 distribution for CIF was unimodal, and overlapped with the lower end of the preliminary CFS distribution.
At this initial stage of the analysis, CFS was defined by moderate (3) or severe (4) fatigue plus at least 4 ancillary criteria with severities of 2, 3 or 4. The importance of 3 versus 4 positive ancillary criteria was demonstrated by the difference in the Sum8 distributions for CIF and CFS groups (Figure 1). CFS had much higher Sum8 scores. The distribution of Sum8 scores in CFS was close to symmetrical (kurtosis -1.20; skewness 0.062).
The Sum8 distributions of CFS and HC subjects overlapped. Receiver operator analysis of Sum8 set the threshold between HC and CFS at 14 (blue arrow, Figure 1 and 2). This threshold had specificity of 0.934 and sensitivity of 0.928 (area under the curve = 0.98) in this unique population (Figure 2). The threshold was applied to the HC subjects (Figure 1). The distal tails of the distribution curves with Sum8 ≥ 14 was defined as CFS – like with insufficient fatigue syndrome (CFSLWIFS).
Figure 2.
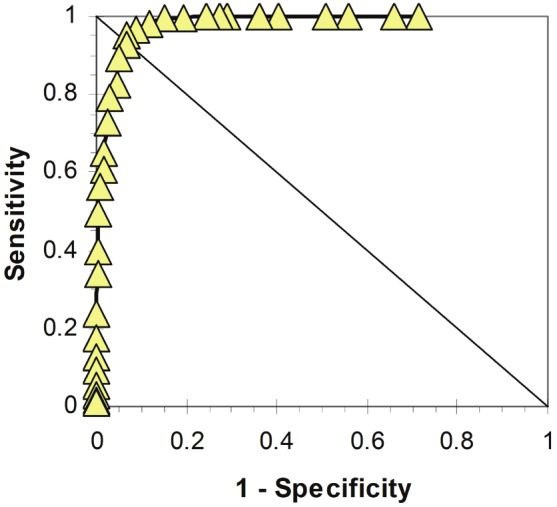
Receiver – operator curve (ROC) for Sum8.
In essence, fatigue scores of ≥ 3 and Sum8 ≥ 14 divided the Cohort 1&2 population into 4 quadrants (Figure 3). The left side with Fatigue < 3 showed HC plus the CFSLWIFS group and their higher Sum8 scores. The right lower quadrant represented CIF with Fatigue of 3 or 4 and Sum8 scores < 14. The CFS group (upper right quadrant) had at least 4 significantly problematic symptoms and a Sum8 score ≥ 14.
Figure 3.
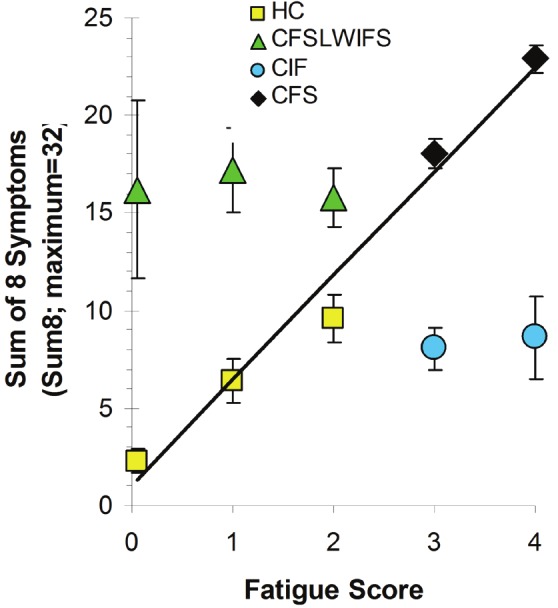
Sum of 8 ancillary symptom scores (Sum8). Sum8 scores for HC (n=259, yellow squares) and CFS (n=276, black diamonds) were plotted as a function of Fatigue Severity Score (means with 95% confidence intervals). The explained variance for Fatigue and Sum8 was 97.7%. Scores for the CFSLWIFS group (n=30, green triangles) were shown separately to indicate their “CFS-like nature”. Scores for the CIF group (n=31, blue circles) were not included in the linear regression.
Sum8 as a proxy of fatigue
The mean Sum8 was highly correlated with Fatigue Severity Scores for the combined HC and CFS quadrants and groups (R2 = 0 .977) (Figure 3). This indicated that Sum8 could be an effective proxy for Fatigue when subjects were strictly defined as HC and CFS. However, the CFSLWIFS subjects with high Sum8 and Fatigue Scores of 0 to 2, and the CIF subjects with Fatigue Scores of 3 or 4 but only 0 to 3 ancillary complaints, were outlier groups. Sum8 was not correlated with Fatigue for these two groups or in their quadrants (Figures 1 and 3).
Severity scores for groups in Cohort 1&2
The HC group was younger than the CIF (p = 0.0001) and CFS (p < 10-10) groups (Table 2). However, age, gender, and age x gender crossproduct were not related to either fatigue or Sum8 by multivariate linear regression.
Table 2.
CFS Severity Scores and demographics for the combined Cohort 1&2. Data for HC, CFSLWIFS, CIF and CFS groups were shown as means with [95% confidence intervals]
| Cohort | Cohort 1&2 | |||
|---|---|---|---|---|
|
| ||||
| Group | HC | CFSLWIFS | CIF | CFS |
| N | 269 | 20 | 55 | 256 |
| Age | 39.9 [38.0-41.8] | 43.1 [35.4-50.8] | 46.2 [42.4-50.0] | 47.0 [45.7-48.3] |
| % Male | 31% | 10% | 20% | 27% |
| Fatigue | 0.62*** [0.53-0.71] | 1.55*** [1.25-1.85] | 3.18*** [3.07-3.29] | 3.61*** [3.55-3.67] |
| Cognition | 0.54*** [0.44-0.64] | 2.35* [1.79-2.91] | 1.69* [1.36-2.02] | 2.94* [2.82-3.06] |
| Sore throat | 0.38† [0.29-0.47] | 1.45†† [0.89-2.01] | 0.51† [0.27-0.75] | 1.59†† [1.45-1.73] |
| Lymph nodes | 0.16† [0.09-0.23] | 1.10†† [0.53-1.67] | 0.10† [0.00-0.20] | 1.43†† [1.27-1.59] |
| Myalgia | 0.56*** [0.45-0.67] | 2.05* [1.57-2.53] | 1.27* [0.93-1.61] | 3.26*** [3.14-3.38] |
| Arthralgia | 0.48** [0.37-0.59] | 2.70†† [2.32-3.08] | 1.04** [0.68-1.40] | 2.77†† [2.61-2.93] |
| Headache | 0.66* [0.54-0.78] | 3.05†† [2.59-3.51] | 1.12* [0.75-1.49] | 2.79†† [2.66-2.92] |
| Sleep | 0.87*** [0.73-1.01] | 3.00†† [2.57-3.43] | 2.10** [1.75-2.45] | 3.50†† [3.41-3.59] |
| Exertional exhaustion | 0.31*** [0.23-0.39] | 2.20††† [1.62-2.78] | 1.63††† [1.22-2.04] | 3.30*** [3.18-3.42] |
| Sum8 | 3.94*** [3.47-4.41] | 17.90*** [16.61-19.19] | 9.45*** [8.66-10.24] | 21.58*** [21.04-22.12] |
| Responses of 2, 3 or 4 | 1.1*** [0.9-1.3] | 5.9†† [5.5-6.3] | 3.2*** [2.9-3.5] | 6.5†† [6.4-6.6] |
The numbers of ancillary symptoms with severity responses of 2, 3 or 4 were shown. Groups with scores significantly different from the other 3 groups were identified.
p < 0.05,
p < 0.005,
p < 0.0005; Tukey’s test after significant ANOVA.
Pairs of groups that had equivalent symptom scores were also indicated.
HC & CIF,
CFSLWIFS & CFS,
CFSLWIFS & CIF.
Fatigue (p < 10-10), cognitive function (p < 0.05), and myalgia (p < 0.02) scores were significantly different between the 4 groups. HC and CIF had equivalent scores (p > 0.05) for sore throat and lymph nodes. CFSLWIFS and CFS had equivalent scores for sore throat, lymph nodes, arthralgia, headache and sleep. Exertional exhaustion was equivalent between CFSLWIFS and CIF. Sum8 was ranked CFS > CIF > CFSLWIFS > HC with all groups being significantly different from each other (p < 0.005). The number of positive ancillary criteria was equivalent for CFSLWIFS and CFS (~6 symptoms), while these numbers for HC and CIF were lower and significantly different from the other 3 groups.
Cronbach’s alpha was 0.924. Exclusion of any single item maintained alpha between 0.907 and 0.925 indicating internal consistency and reliability.
Verification
Fourteen CFS subjects completed the questionnaire after 0, 6 and 12 weeks. Coefficients of variation ranged from 0.017 for memory and concentration to 0.81 for sore lymph nodes (Table 3). Symptoms for individuals did not change significantly over this 3 month longitudinal period. Gulf War Illness subjects had an almost identical pattern of scores as the CFS subjects suggesting overlap with regard to case designation criteria but without any inferences about comparable inciting or on-going pathogenesis. In contrast, 26.5% of Type II diabetics met CFS criteria. The co-existence of diabetes and CFS highlighted the primacy of the physician examination for determining the chronology of symptoms and syndrome onset, and influence of potential exclusionary disorders on the diagnosis of CFS.
Table 3.
Longitudinal CFS, Gulf War Illness, and diabetic group demographics and questionnaire scores. Data are shown as mean [95% confidence interval], with (coefficient of variation) for the longitudinal CFS group
| CFS Longitudinal Follow-up | Gulf War Illness (GWI) | Type II Diabetics | |
|---|---|---|---|
| N | 14 | 100 | 49 |
| Age | 47.1 [42.9 to 51.4] | 47.1 [42. 9 to 51.4] | 54.5 [51.1 to 57.9] |
| Male % | 74% | 69% | 63% |
| Body Mass Index | 29.4 [26.3 to 32.5] | 32.3 [30.1 to 34.4] | 33.5 [31.3 to 35.7] |
| CFS % | 100% | 89.4% | 26.5% |
| CIF % | 0% | 67.3% | 8.2% |
| CFSWIFS % | 0% | 0% | 4.1% |
| HC % | 0% | 3.8% | 61.2% |
| Fatigue | 3.74 [3.60 to 3.87] (0.02) | 3.51 [3.37 to 3.65] | 1.76 [1.34 to 2.17] |
| Memory and concentration | 3.02 [2.78 to 3.27] (0.17) | 2.83 [2.64 to 3.02] | 1.14 [0.81 to 1.48] |
| Sore throat | 1.45 [1.10 to 1.80] (0.44) | 1.36 [1.15 to 1.57] | 0.29 [0.07 to 0.50] |
| Lymph nodes | 1.10 [0.74 to 1.145] (0.81) | 1.32 [1.06 to 1.58] | 0.20 [0 to 0.41] |
| Muscle pain | 3.07 [2.89 to 3.25] (0.21) | 3.11 [2.92 to 3.30] | 1.63 [1.21 to 2.05] |
| Joint pain | 2.83 [2.46 to 3.20] (0.14) | 2.87 [2.62 to 3.12] | 1.92 [1.50 to 2.34] |
| Headaches | 2.81 [2.45 to 3.16] (0.32) | 2.73 [2.50 to 2.96] | 0.96 [0.61 to 1.31] |
| Sleep | 3.29 [3.00 to 3.57] (0.15) | 3.35 [3.16 to 3.54] | 1.59 [1.18 to 2.00 |
| Exertional exhaustion | 3.40 [3.11 to 3.69] (0.11) | 3.26 [3.04 to 3.48 | 1.51 [1.11 to 1.91] |
| Sum8 | 21.21 [19.69 to 22.73] (0.099) | 20.91 [19.71 to 22.11] | 9.24 [7.24 to 11.25] |
| Count of symptoms with severities of 2, 3, or 4 | 6.29 [5.91 to 6.66] (0.11) | 6.19 [5.85 to 6.53] | 2.61 [2.13 to 3.19] |
The validity of this approach and coherence of the CFS, CIF, CFSLWIFS and HC categories were corroborated by independent comparisons of fatigue, disability, pain and irritant sensitivity in Cohort 1&2.
Multidimensional Fatigue Inventory (MFI) [32]
General Fatigue scores were ranked CFS > CIF = CFSLWIFS > HC (Table 4). HC and CFS scores were significantly different from each of the other groups (p < 0.0005). Physical Fatigue and Reduced Activity had the same trend. Reduced Motivation scores were equivalent between HC, CFSLWIFS and CIF. The CFS and CFSLWIFS groups were equivalent due to the small size (n=16) and large variance of the latter group. Mental Fatigue was significantly lower for HC than the other 3 groups (p < 0.05). CFSLWIFS and CFS had equivalent scores. Although the MFI domain scores for CFSLWIFS and CIF were similar, the Fatigue Severity score distinguished between these 2 groups. MFI domains were positively correlated with both Fatigue Severity and Sum8; General Fatigue had the highest explained variances. Reduced Motivation was poorly correlated with both Fatigue and Sum8.
Table 4.
Multidimensional Fatigue Inventory Domains (mean [95% C.I.]) and correlations (R2). Some Cohort 1 subjects did not complete both this and the CFS Severity Questionnaire and so the group sizes were smaller than in Table 2
| Group | General Fatigue | Physical Fatigue | Reduced Activity | Reduced Motivation | Mental Fatigue |
|---|---|---|---|---|---|
| HC (n = 202) | 9.9*** [9.4-10.4] | 9.3*** [8.8-9.8] | 8.7* [8.3-9.8] | 8.8† [8.1-9.5] | 9.1* [8.6-9.6] |
| CFSLWIFS (n = 16) | 13.7† [11.8-15.6] | 13.3† [11.1-15.4] | 11.6† [9.4-13.8] | 10.3† [8.8-11.7] | 13.2† [11.1-15.3 |
| CIF (n = 44) | 13.9† [12.7-15.0] | 12.5† [11.2-13.9] | 10.7† [9.4-12.0] | 10.0† [8.9-11.1] | 10.8 [9.7-11.9] |
| CFS (n = 204) | 17.0*** [16.5-17.5] | 15.6 [15.1-16.1] | 14.9** [14.4-15.5] | 12.2 [11.6-12.7] | 14.5† [13.9-15.1] |
|
| |||||
| Explained Variance (R2) | |||||
|
| |||||
| Fatigue | 0.429 | 0.339 | 0.317 | 0.158 | 0.267 |
| Sum8 | 0.452 | 0.383 | 0.392 | 0.222 | 0.326 |
p < 0.05;
p < 0.005;
p < 0.0005, compared to the other 3 groups by Tukey’s test after significant ANOVA;
Scores were equivalent between groups indicated by †.
Disability and quality of life
SF-36 Domain Scores [33,34] were generally similar for HC, CFSLWIFS and CIF groups, and significantly different from CFS scores (Table 5). Physical Functioning, Role Physical, Bodily Pain, General Health, Vitality and Social Functioning had similar patterns of responses. CFS had significantly worse (lower) scores for these compared to the other 3 groups, while CFSLWIFS and CIF had equivalent scores. The latter 2 groups were also equivalent for Role Physical, General Health, Vitality, and Social Functioning. These two group’s scores for Role Physical, General Health and Vitality were significantly lower than the HC group. HC and CFSLWIFS scores for Physical Functioning and Bodily Pain were equivalent. The general pattern of HC > CFSLWIFS = CIF > CFS was reinforced by the high explained variances for these 6 domains with Fatigue Severity and Sum8 (R2 > 0.527).
Table 5.
SF-36 Domain scores for each Group (mean [95% confidence intervals])
| HC (n = 134) | CFSLWIFS (n = 11) | CIF (n = 25) | CFS (n = 141) | Fatigue R2 | Sum8 R2 | |
|---|---|---|---|---|---|---|
| Physical Functioning | 89.6† [86.2-92.9] | 84.5† [72.9-96.2] | 69.2 [57.1-81.3] | 42.9*** [38.8-47.0] | 0.527 | 0.584 |
| Role Physical | 85.6*** [80.4-90.9] | 47.7† [13.8-81.7] | 54.0† [35.5-72.5] | 10.5** [6.4-14.6] | 0.534 | 0.558 |
| Bodily Pain | 80.3† [76.6-84.0] | 69.1† [54.5-83.7] | 59.6 [49.1-70.1] | 31.7*** [28.4-35.1] | 0.552 | 0.664 |
| General Health | 75.1** [71.8-78.4] | 54.0† [37.2-70.8] | 53.6† [45.8-61.4] | 29.5*** [26.5-32.5] | 0.582 | 0.616 |
| Vitality | 65.6*** [62.6-68.5] | 37.7† [21.8-53.7] | 33.2† [25.3-41.1] | 16.1*** [13.7-18.4] | 0.706 | 0.632 |
| Social Functioning | 84.9 [81.7-88.1] | 68.2† [54.5-81.9] | 62.5† [51.2-73.8] | 29.3*** [25.4-33.1] | 0.626 | 0.602 |
| Role Emotional | 89.3 [85.0-93.6] | 72.7† [44.7-100] | 68.0† [51.4-84.6] | 45.4 [37.9-52.9] | 0.244 | 0.220 |
| Mental Health | 76.2† [73.6-78.9] | 71.3† [59.9-82.6] | 68.2† [61.6-74.7] | 56.5 [52.9-60.1] | 0.227 | 0.228 |
p < 0.05;
p < 0.005;
p < 0.0005 compared to the other 3 groups by Tukey’s test after significant ANOVAs;
Scores were equivalent between groups indicated by †.
In contrast, Role Emotional and Mental Health were relatively poorly correlated with fatigue and Sum8 (R2 between 0.220 and 0.244) suggesting that these domains were inefficient for separating Fatigued from Not Fatigued subgroups. Mental Health scores were equivalent for HC, CFSLWIFS and CIF. HC had higher scores than CFS for Role Emotional and Mental Health.
Pain
McGill Affective, Sensory and Total Pain Scores [35] were equivalent for HC, CFSLWIFS and CIF groups, and significantly lower than CFS (p < 0.005) (Table 6). The Sensory scores were more highly correlated with Sum8 (R2 = 0.573) than Fatigue (R2 = 0.454). This was consistent with the painful ancillary symptoms included in Sum8. These data indicate that pain is a significant discriminator between CFS and the other 3 groups. This conclusion was supported by other findings of systemic hyperalgesia, allodynia and central sensitization in CFS [36].
Table 6.
McGill short form Pain Scores. Scores are shown for HC, CFSLWIFS, CIF and CFS subjects who also completed the CFS Severity Questionnaire (mean [95% C.I.])
| Groups | Total Score | Sensory | Affective |
|---|---|---|---|
| HC (n = 110) | 3.1† [2.0-4.2] | 2.6† [1.7-3.5] | 0.5† [0.3-0.7] |
| CFSLWIFS (n = 9) | 8.4† [3.0-13.8] | 7.3† [2.7-11.9] | 1.1† [0.0-2.3] |
| CIF (n = 19) | 6.8† [3.2-10.4] | 5.2† [2.4-8.0] | 1.6† [0.5-2.7] |
| CFS (n = 131) | 19.8*** [18.1-21.5] | 15.1** [13.8-16.4] | 4.7*** [4.1-5.3] |
|
| |||
| Explained Variance (R2) | |||
|
| |||
| Fatigue | 0.466 | 0.454 | 0.393 |
| Sum8 | 0.588 | 0.573 | 0.501 |
p < 0.05;
p < 0.005;
p < 0.0005, compared to the other 3 groups by Tukey’s test after significant ANOVAs;
Scores were equivalent between groups indicated by †.
Irritant sensitivity
The Irritant Rhinitis Questionnaire showed that rhinorrhea scores were equivalent for CFSLWIFS, CIF and CFS subjects (Table 7). Congestion was equivalent in the CFSLWIFS and CFS groups, and significantly higher than HC. Congestion may be due to nasal vascular dilation, mucous hypersecretion, or be a trigeminal nociceptive perception of decreased nasal airflow [26,31]. Fatigue and Sum8 were poorly correlated with congestion and rhinorrhea scores suggesting that mechanisms responsible for mucosal irritant sensitivity, fatigue, and the pain - and cognition - related Sum8 were distinct.
Table 7.
Irritant Rhinitis scores. Scores are shown for HC, CFSLWIFS, CIF and CFS subjects who also completed the CFS Severity Questionnaire (mean [95% C.I.])
| Groups | Congestion | Rhinorrhea | Irritant Rhinitis Score |
|---|---|---|---|
| HC (n = 110) | 4.6*** [4.0-5.2] | 3.5 [3.0-4.0] | 8.2** [7.2-9.2] |
| CFSLWIFS (n = 9) | 11.8† [9.2-14.4] | 6.7† [3.9-9.5] | 18.4† [14.2-22.6] |
| CIF (n = 19) | 7.7 [5.7-9.7] | 5.9† [4.3-7.5] | 13.5 [10.3-16.7] |
| CFS (n = 249) | 11.5† [10.6-12.4] | 7.8† [7.0-8.6] | 19.3† [17.8-20.8] |
|
| |||
| Explained Variance (R2) | |||
|
| |||
| Fatigue | 0.220 | 0.162 | 0.252 |
| Sum8 | 0.233 | 0.162 | 0.261 |
p < 0.05;
p < 0.005;
p < 0.0005, compared to the other 3 groups by Tukey’s test after significant ANOVAs;
Scores were equivalent between groups indicated by †.
Unsupervised hierachical clustering
Clusters of subjects were defined within the HC, CIF and CFS groups based on their CFS symptom severity scores. The CFSLWIFS group was too small for cluster analysis. Their mean scores were above 2 for all symptoms except fatigue, sore throat and tender lymph nodes (Figure 4A). This pattern was distinct from CFS and HC clusters. Headache and arthralgia scores were significantly higher for CFSLWIFS than for any of the HC clusters.
Figure 4.

Clusters based on CFS Severity Score components. Clusters within A. CFSLWIFS, B. HC, C. CFS and D. CIF are shown. The single clade with severity scores that were significantly different from all of the other clades in the group were indicated on each graph. For example, fatigue severity for HC clade “A” was significantly different from clades “B”, “C” and “D” with p<10-5 by Tukey’s test following ANOVA. (Ftg, fatigue; HA, headaches; Cog, memory and other cognitive problems; ExEx, exertional exhaustion; Myal, mayalgia; Arth, arthralgia; SThr, sore throat; LN, sore lymph node regions).
HC had 4 clusters. The largest cluster (“A”, n=130) had scores of 0.2 or less for all symptoms (Figure 4B). HC cluster “A” symptom scores were significantly different from the other 3 clusters except for exertional exhaustion (equivalent to cluster “C”). Cluster “C” was the next largest (n=69), and generally had scores that were intermediate between “A” and the other HC clades. Clades “B” (n=37) and “D” (n=33) had similar, relatively elevated scores except for significantly higher scores for headache and myalgia in “D”. In preliminary examinations, a 3 cluster solution identified clades “A” and “C”, but combined clades “B” and “D”. When HC and CFSLWIFS were combined, a 5 cluster solution was obtained where the 4 HC clades were generally distinct from CFSLWIFS.
CFS subjects satisfied a 4 cluster solution (Figure 4C). CFS clade “A” had high scores for all symptoms. Clade “A” scores for sore throat and lymph nodes were significantly higher than the other 3 clades. This suggested that 40% of this CFS study population had chronic pharyngitis-like symptoms. Clade “D” (n=52) was similar to “A” except for significantly lower sore throat and lymph node scores. Clade “B” (n=53) was similar to “D” but had significantly lower myalgia scores compared to “A” and “D”, and arthralgia versus the 3 other clades. Clade “C” (n = 54) was unique in having significantly lower headache, cognition, and exertional exhaustion scores than the other 3 CFS clades.
The CIF group was optimally divided into 3 distinct clades. By definition, all had fatigue ≥ 3. CIF clade “A” (n = 14) had significant exertional exhaustion (p < 10-7 vs. the other 2 clades). Clade “C” (n = 22) had significant headaches compared to the other 2 clades (p < 10-5). Clade “B” had 15 subjects with low headache and exertional exhaustion scores.
Clustering for proteomic analysis
To demonstrate utility, CFS questionnaire responses were clustered for 56 CFS subjects who had lumbar punctures for cerebrospinal fluid proteomics [19]. Questionnaire outcomes and ion peak signal intensities were assessed by 2-dimensional unsupervised hierarchical clustering. A heat map was generated showing synchrony between ion peaks and 4 clades of CFS subjects. This suggested that the ordinal scores were in some way indicative of the mechanisms leading to differences in cerebrospinal fluid constituents between the 4 clades. These relationships and proteomic results will be discussed in a separate publication.
Discussion
Fatigue severity, Sum8, and the number of positive ancillary criteria divided this study population into 4 groups: HC, CFSLWIFS, CIF and CFS. Severity scores for fatigue, cognitive dysfunction and myalgia were significantly different between each group. Exertional exhaustion was equivalent between CFSLWIFS and CIF, and significantly different for HC and CFS compared to the other groups. This supported the emphasis placed on this symptom in the 2011 myalgic encephalomyelitis (ME) criteria [37-39]. The equivalence of CFSLWIFS and CFS scores for ancillary criteria was consistent with the Sum8 threshold score that separated CFSLWIFS from HC subjects and the skewed Sum8 distribution in subjects without fatigue (Figure 1). CIF had 3 positive criteria (Table 2) reflecting the requirement for 4 significantly severe symptoms to meet the 1994 CFS criteria [1].
Severity scoring of the ancillary criteria and Sum8 dramatically increased the distinction between HC and CFS. These data raise the possibility that it is the wide diversity of ancillary symptoms that makes CFS distinct from other fatiguing syndromes. This was reinforced by the large number of sedentary adults in the HC group who had relatively low SF-36 domain scores but no significant fatigue. Using the current questionnaire data, the clinical designation of CFS would be confirmed by 6 months of unexplained fatigue with scores of 3 (moderate) or 4 (severe) plus at least 4 ancillary symptoms with scores of 2 (mild), 3 or 4 that gave a Sum8 ≥ 14. CIF would be identified by moderate or severe fatigue but with ≤ 3 ancillary symptoms and Sum8 < 14. CFSLWIFS would be defined by fatigue scores of 0, 1, or 2 plus Sum8 ≥ 14. Subjects with fatigue scores of 0, 1, or 2 plus Sum8 ≤ 13 would be considered HC, with most of the HC subjects having scores of 0 for all 9 symptoms.
Large scale prospective epidemiological validation studies may provide tighter limits for the fatigue, individual symptoms, and Sum8 threshold scores so that subgroups can be differentiated with greater confidence. Population studies will yield larger CFSLWIFS and CIF groups. Longitudinal studies will be required to determine if these symptom patterns are consistent for CFS subjects over time, related to years since illness onset, or are artifacts due to cross-sectional analysis of this single population. Cluster analysis of larger populations of putative CFSLWIFS and CIF subjects linked to longitudinal studies may identify specific patient subsets or phenotypes at risk for progression to CFS.
Extent of disease is an essential component of many illness - defining criteria. The need to define the severity of each of the minor criteria to meet CFS case designation has been a missing element in disease evaluation [5]. More standardized definitions of the CFS ancillary criteria would be of value to increase the positive and negative predictive value of questions used for history taking and other questionnaires. For example, inquiries about migraine with and without aura [24] and tension headaches [40] would provide information that could modify treatment plans compared to simply asking if new onset headaches had developed since the beginning of the fatigue [1]. Parallel assessments of pain and tenderness (systemic hyperalgesia and allodynia, respectively) are appropriate since 5 of the ancillary criteria may be related to chronic neuropathic pain and central sensitization [36]. The range of questionnaire severity grades and Sum8 should be valuable to avoid statistical ceiling effects.
Application of the CFS Severity questionnaire to ME, [37-39] fibromyalgia, [41,42] multiple chemical sensitivity [43] Gulf War Illness, [44,45] veterans returning from Iraq and Afghanistan with traumatic brain injury and posttraumatic stress disorder, [46-49] and other allied illnesses may provide a basis for identifying common symptomatic trends and potentially pathophysiological mechanisms in these syndromes. Comparisons to post-infectious, post-chemotherapy, post-lupus, major depression, cachexia, elderly and other fatigue groups are necessary to clearly define parallels and discrepancies between CFS, CIF, psychiatric and medically-related fatigue. It remains to be determined if psychiatric (major depression) and medical syndromes have lower ancillary criteria severity scores, and fewer positive symptoms than CFS subjects. This is particularly important for ME where exertional exhaustion, cognitive problems (“brain fog”), autonomic dysfunction, and other clearly defined complaints are embedded in the case designation criteria [37-39]. Comparisons to these groups will improve the sensitivity and specificity estimates for the CFS Severity Questionnaire. Expansion of the system to incorporate self – report symptom severities that complement the necessary physician - diagnosed components such as dyspnea, irritable bowel, bladder and other interoceptive syndromes, and autonomic features such as postural orthostatic tachycardia syndrome may be of value for the next iteration of ME diagnostic criteria.
At a deeper mechanistic level (Figure 5), the severity of CFS - and ME - related symptom complexes may help clarify the differential diagnosis of nonpsychiatric dysesthesia, neuropathic pain, cognitive, autonomic, and patterns of dysfunction related to central sensitization [36]. Success of fMRI, [50,51] proteomic [6,19], genotyping, and other, more intensive tools for CFS subgroup diagnosis will be enhanced if the spectrum of CFS phenotypes, allied syndromes, other potential illnesses, potential mechanisms, and symptom severities are more precisely defined [52]. Clinical subsets with distinct, severity - based patterns of symptoms may offer more homogenous phenotypes for candidate gene, epigenetic, and genome wide association studies [20,21].
Figure 5.

CFS clades clustered for proteomic analysis. A. Proteomic mass spectrometry peptide ion abundances in cerebrospinal fluid samples from 56 CFS subjects were clustered. B. Two - dimensional unsupervised clustering by CFS questionnaire responses and peptide ion abundances generated a heat map with apparent relationships between sets of ion peaks and clades based upon the CFS questionnaire responses. This suggests that as yet unknown pathophysiological principles may regulate the association of CFS case designation criteria and cerebrospinal fluid dynamics. This work is currently under separate investigation.
Conclusions
The CFS Symptom Severity Questionnaire is a handy, self-administered tool to include in research investigations, and may be valuable in clinical practice to assist physicians in reaching diagnoses of CFS, ME, and related syndromes. Although the questionnaire is subjective, it interrogates the same subjective symptoms that physicians question in historical examinations. As such, the direct, written responses from patients may provide cues for focusing the history taking and so improve diagnostic accuracy. Future, population - based surveys and longitudinal studies using this instrument may identify specific phenotypic clades within heterogenous HC, CFSLWIFS, CIF and CFS groups. Long-term patterns of change for symptom severities may identify persons and phenotypes at risk for development or progression of CFS. We encourage other investigators to collaborate using our eZhentricity system [53,54] to better characterize their patient populations and the responsiveness of the questionnaire.
Acknowledgments
Author contributions: JNB developed the CFS questionnaire with the assistance of MA, UL and KNP. Clinical investigations were performed by SJM, MA, MKR, CRT, RR, YZ, UL, RE, KNP and JNB. OA, RR and JNB performed the statistical analysis. YZ created eZhentricity© as a secure open source tool for questionnaire completion and database creation. All authors were involved in data analysis and manuscript preparation, and approved the final manuscript. Funding: This work was funded by the National Institute of Environmental and Health Sciences (NIEHS) (RO1 ES015382) and the Congressionally Directed Medical Research Program (CDMRP awards W81XWH-07-1-0618 and W81XWH-09-1-0526). This project has been funded in whole or in part with Federal funds (Grant # UL1TR000101, previously UL1RR031975) from the National Center for Advancing Translational Sciences (NCATS), National Institutes of Health (NIH), through the Clinical and Translational Science Awards Program (CTSA), a trademark of DHHS, part of the Roadmap Initiative, “Re-Engineering the Clinical Research Enterprise.” Competing interests: The authors declare they have no competing interests.
Abbreviations
- CFS
Chronic Fatigue Syndrome
- CFSLWIFS
Chronic Fatigue Syndrome–like with Insufficient Fatigue Syndrome
- CIF
chronic idiopathic fatigue
- HC
healthy control
- ME
myalgic encephalomyelitis
- MFI
Multidimensional Fatigue Inventory
- SF-36
Medical Outcomes Survey short form 36 questions
- Ftg
fatigue
- HA
headaches
- Cog
memory and other cognitive problems
- ExEx
exertional exhaustion
- Myal
mayalgia
- Arth
arthralgia
- SThr
sore throat
- LN
sore lymph node regions
References
- 1.Fukuda K, Straus SE, Hickie I, Sharpe MC, Dobbins JG, Komaroff A. The chronic fatigue syndrome: a comprehensive approach to its definition and study. International Chronic Fatigue Syndrome Study Group. Ann Intern Med. 1994;121:953–959. doi: 10.7326/0003-4819-121-12-199412150-00009. [DOI] [PubMed] [Google Scholar]
- 2.Reeves WC, Lloyd A, Vernon SD, Klimas N, Jason LA, Bleijenberg G, Evengard B, White PD, Nisenbaum R, Unger ER. International Chronic Fatigue Syndrome Study Group: Identification of ambiguities in the 1994 chronic fatigue syndrome research case definition and recommendations for resolution. BMC Health Serv Res. 2003;3:25. doi: 10.1186/1472-6963-3-25. [DOI] [PMC free article] [PubMed] [Google Scholar]
- 3.Reeves WC, Wagner D, Nisenbaum R, Jones JF, Gurbaxani B, Solomon L, Papanicolaou DA, Unger ER, Vernon SD, Heim C. Chronic fatigue syndrome—a clinically empirical approach to its definition and study. BMC Med. 2005;3:19. doi: 10.1186/1741-7015-3-19. [DOI] [PMC free article] [PubMed] [Google Scholar]
- 4.Reeves WC, Jones JF, Maloney E, Heim C, Hoaglin DC, Boneva RS, Morrissey M, Devlin R. Prevalence of chronic fatigue syndrome in metropolitan, urban, and rural Georgia. Popul Health Metr. 2007;5:5. doi: 10.1186/1478-7954-5-5. [DOI] [PMC free article] [PubMed] [Google Scholar]
- 5.Jason LA, Corradi K, Torres-Harding S, Taylor RR, King C. Chronic fatigue syndrome: the need for subtypes. Neuropsychol Rev. 2005;15:29–58. doi: 10.1007/s11065-005-3588-2. [DOI] [PubMed] [Google Scholar]
- 6.Schutzer SE, Angel TE, Liu T, Schepmoes AA, Clauss TR, Adkins JN, Camp DG, Holland BK, Bergquist J, Coyle PK, Smith RD, Fallon BA, Natelson BH. Distinct cerebrospinal fluid proteomes differentiate post-treatment lyme disease from chronic fatigue syndrome. PLoS One. 2011;6:e17287. doi: 10.1371/journal.pone.0017287. [DOI] [PMC free article] [PubMed] [Google Scholar]
- 7.Janal MN, Ciccone DS, Natelson BH. Sub-typing CFS patients on the basis of ‘minor’ symptoms. Biol Psychol. 2006;73:124–131. doi: 10.1016/j.biopsycho.2006.01.003. [DOI] [PubMed] [Google Scholar]
- 8.Sullivan PF, Pedersen NL, Jacks A, Evengård B. Chronic fatigue in a population sample: definitions and heterogeneity. Psychol Med. 2005;35:1337–1348. doi: 10.1017/S0033291705005210. [DOI] [PubMed] [Google Scholar]
- 9.Evengård B, Jacks A, Pedersen NL, Sullivan PF. The epidemiology of chronic fatigue in the Swedish Twin Registry. Psychol Med. 2005;35:1317–1326. doi: 10.1017/S0033291705005052. [DOI] [PubMed] [Google Scholar]
- 10.Steele L, Dobbins JG, Fukuda K, Reyes M, Randall B, Koppelman M, Reeves WC. The epidemiology of chronic fatigue in San Francisco. Am J Med. 1998;105:83S–90S. doi: 10.1016/s0002-9343(98)00158-2. [DOI] [PubMed] [Google Scholar]
- 11.Bhui KS, Dinos S, Ashby D, Nazroo J, Wessely S, White PD. Chronic fatigue syndrome in an ethnically diverse population: the influence of psychosocial adversity and physical inactivity. BMC Med. 2011;9:26. doi: 10.1186/1741-7015-9-26. [DOI] [PMC free article] [PubMed] [Google Scholar]
- 12.Ciccone DS, Chandler HK, Natelson BH. Illness trajectories in the chronic fatigue syndrome: a longitudinal study of improvers versus non-improvers. J Nerv Ment Dis. 2010;198:486–493. doi: 10.1097/NMD.0b013e3181e4ce0b. [DOI] [PubMed] [Google Scholar]
- 13.Furberg H, Olarte M, Afari N, Goldberg J, Buchwald D, Sullivan PF. The prevalence of self-reported chronic fatigue in a U. S. twin registry. J Psychosom Res. 2005;59:283–290. doi: 10.1016/j.jpsychores.2005.05.008. [DOI] [PMC free article] [PubMed] [Google Scholar]
- 14.Jones JF, Lin JM, Maloney EM, Boneva RS, Nater UM, Unger ER, Reeves WC. An evaluation of exclusionary medical/psychiatric conditions in the definition of chronic fatigue syndrome. BMC Med. 2009;7:57. doi: 10.1186/1741-7015-7-57. [DOI] [PMC free article] [PubMed] [Google Scholar]
- 15.Schmaling KB, Fiedelak JI, Katon WJ, Bader JO, Buchwald DS. Prospective study of the prognosis of unexplained chronic fatigue in a clinic-based cohort. Psychosom Med. 2003;65:1047–1054. doi: 10.1097/01.psy.0000088587.29901.69. [DOI] [PubMed] [Google Scholar]
- 16.Darbishire L, Ridsdale L, Seed PT. Distinguishing patients with chronic fatigue from those with chronic fatigue syndrome: a diagnostic study in UK primary care. Br J Gen Pract. 2003;53:441–445. [PMC free article] [PubMed] [Google Scholar]
- 17.Arpino C, Carrieri MP, Valesini G, Pizzigallo E, Rovere P, Tirelli U, Conti F, Dialmi P, Barberio A, Rusconi N, Bosco O, Lazzarin A, Saracco A, Moro ML, Vlahov D. Idiopathic chronic fatigue and chronic fatigue syndrome: a comparison of two case-definitions. Ann Ist Super Sanita. 1999;35:435–441. [PubMed] [Google Scholar]
- 18.Fletcher MA, Rosenthal M, Antoni M, Ironson G, Zeng XR, Barnes Z, Harvey JM, Hurwitz B, Levis S, Broderick G, Klimas NG. Plasma neuropeptide Y: a biomarker for symptom severity in chronic fatigue syndrome. Behav Brain Funct. 2010;6:76. doi: 10.1186/1744-9081-6-76. [DOI] [PMC free article] [PubMed] [Google Scholar]
- 19.Baraniuk JN, Casado B, Maibach H, Clauw DJ, Pannell LK, Hess S. A chronic fatigue syndrome related proteome in cerebrospinal fluid. BMC Neurology. 2005;5:22. doi: 10.1186/1471-2377-5-22. [DOI] [PMC free article] [PubMed] [Google Scholar]
- 20.Fang H, Xie Q, Boneva R, Fostel J, Perkins R, Tong W. Gene expression profile exploration of a large dataset on chronic fatigue syndrome. Pharmacogenomics. 2006;7:429–440. doi: 10.2217/14622416.7.3.429. [DOI] [PubMed] [Google Scholar]
- 21.Frampton D, Kerr J, Harrison TJ, Kellam P. Assessment of a 44 gene classifier for the evaluation of chronic fatigue syndrome from peripheral blood mononuclear cell gene expression. PLoS One. 2011;6:e16872. doi: 10.1371/journal.pone.0016872. [DOI] [PMC free article] [PubMed] [Google Scholar]
- 22.Vanness JM, Snell CR, Strayer DR, Dempsey L th, Stevens SR. Subclassifying chronic fatigue syndrome through exercise testing. Med Sci Sports Exerc. 2003;35:908–913. doi: 10.1249/01.MSS.0000069510.58763.E8. [DOI] [PubMed] [Google Scholar]
- 23.Rowe PC, Lucas KE. Orthostatic intolerance in chronic fatigue syndrome. Am J Med. 2007;120:e13. doi: 10.1016/j.amjmed.2006.02.033. [DOI] [PubMed] [Google Scholar]
- 24.Ravindran MK, Zheng Y, Timbol C, Merck SJ, Baraniuk JN. Migraine headaches in chronic fatigue syndrome (CFS): comparison of two prospective cross-sectional studies. BMC Neurol. 2011;11:30. doi: 10.1186/1471-2377-11-30. [DOI] [PMC free article] [PubMed] [Google Scholar]
- 25.Neu D, Hoffmann G, Moutrier R, Verbanck P, Linkowski P, Le Bon O. Are patients with chronic fatigue syndrome just ‘tired’ or also ‘sleepy’? J Sleep Res. 2008;17:427–431. doi: 10.1111/j.1365-2869.2008.00679.x. [DOI] [PubMed] [Google Scholar]
- 26.Baraniuk JN, Clauw JD, Gaumond E. Rhinitis symptoms in chronic fatigue syndrome. Annals Allergy Asthma Immunol. 1998;81:359–365. doi: 10.1016/S1081-1206(10)63129-8. [DOI] [PubMed] [Google Scholar]
- 27.Baraniuk JN, Naranch K, Maibach H, Clauw D. Irritant rhinitis in allergic, nonallergic, control and Chronic Fatigue Syndrome populations. J CFS. 2000;7:3–31. [Google Scholar]
- 28.Baraniuk JN, Naranch K, Maibach H, Clauw D. Tobacco sensitivity in Chronic Fatigue Syndrome. J CFS. 2000;7:33–52. [Google Scholar]
- 29.Baraniuk JN, Adewuyi O, Petrie K, Le U, Ali M, Merck SJ, Ravindran M, Zheng Y, Timbol CR, Esteitie R, Rayhan R, editors. A Chronic Fatigue Syndrome (CFS) Severity Score Questionnaire. 10th International ME/CFS Conference; September, 2011; Ottawa, Canada. [Google Scholar]
- 30.Naranch K, Park YJ, Repka-Ramirez SM, Velarde A, Clauw D, Baraniuk JN. A tender sinus does not always mean sinusitis. Otolaryngol Head Neck Surg. 2002;127:387–397. doi: 10.1067/mhn.2002.129038. [DOI] [PubMed] [Google Scholar]
- 31.Baraniuk JN, Petrie KN, Le U, Tai CF, Park YJ, Yuta A, Ali M, VandenBussche CJ, Nelson B. Neuropathology in rhinosinusitis. Am J Respir Crit Care Med. 2005;171:5–11. doi: 10.1164/rccm.200403-357OC. [DOI] [PubMed] [Google Scholar]
- 32.Smets EM, Garssen B, Bonke B, De Haes JC. The Multidimensional Fatigue Inventory (MFI) psychometric qualities of an instrument to assess fatigue. J Psychosom Res. 1995;39:315–325. doi: 10.1016/0022-3999(94)00125-o. [DOI] [PubMed] [Google Scholar]
- 33.Ware JE, Sherbourne CD. The MOS 36-item short-form health survey (SF-36): I. Conceptual framework and item selection. Med Care. 1995;30:473–483. [PubMed] [Google Scholar]
- 34.McHorney CA, Ware JE Jr, Raczek AE. The MOS 36-Item Short-Form Health Survey (SF-36): II. Psychometric and clinical tests of validity in measuring physical and mental health constructs. Med Care. 1993;31:247–263. doi: 10.1097/00005650-199303000-00006. [DOI] [PubMed] [Google Scholar]
- 35.Melzack R. The short-form McGill Pain Questionnaire. Pain. 1987;30:191–197. doi: 10.1016/0304-3959(87)91074-8. [DOI] [PubMed] [Google Scholar]
- 36.Latremoliere A, Woolf CJ. Central sensitization: a generator of pain hypersensitivity by central neural plasticity. J Pain. 2009;10:895–926. doi: 10.1016/j.jpain.2009.06.012. [DOI] [PMC free article] [PubMed] [Google Scholar]
- 37.Carruthers BM, Jain AK, De Meirleir KL, Peterson DL, Klimas NG, Lerner AM, Bested AC, Pierre Flor-Henry P, Joshi P, Peter ACP, Sherkey JA, van de Sande MI. Myalgic encephalomyelitis/chronic fatigue syndrome: clinical working case definition, diagnostic and treatment protocols. J CFS. 2003;11:7–115. [Google Scholar]
- 38.Carruthers BM. Definitions and aetiology of myalgic encephalomyelitis: how the Canadian consensus clinical definition of myalgic encephalomyelitis works. J Clin Pathol. 2007;60:117–119. doi: 10.1136/jcp.2006.042754. [DOI] [PMC free article] [PubMed] [Google Scholar]
- 39.Carruthers BM, van de Sande MI, De Meirleir KL, Klimas NG, Broderick G, Mitchell T, Staines D, Powles P, Speight N, Vallings R, Bateman L, Baumgarten-Austrheim B, Bell DS, Carlo-Stella N, Chia J, Darragh A, Jo D, Lewis D, Light AR, Marshall-Gradisbik S, Mena I, Mikovits JA, Miwa K, Murovska M, Pall ML, Stevens S. Myalgic Encephalomyelitis (ICD G93.3): International consensus criteria. J Int Med. 2011;270:327–338. doi: 10.1111/j.1365-2796.2011.02428.x. [DOI] [PMC free article] [PubMed] [Google Scholar]
- 40.Headache Classification Subcommittee of the International Headache Society. The International Classification of Headache Disorders: 2nd edition. Cephalalgia. 2004;24:9–160. doi: 10.1111/j.1468-2982.2003.00824.x. [DOI] [PubMed] [Google Scholar]
- 41.Wolfe F, Smythe HA, Yunus MB, Bennett RM, Bombardier C, Goldenberg DL, Tugwell P, Campbell SM, Abeles M, Clark P, et al. The American College of Rheumatology 1990 Criteria for the Classification of Fibromyalgia. Report of the Multicenter Criteria Committee. Arthritis Rheum. 1990;33:160–172. doi: 10.1002/art.1780330203. [DOI] [PubMed] [Google Scholar]
- 42.Wolfe F, Clauw DJ, Fitzcharles MA, Goldenberg DL, Katz RS, Mease P, Russell AS, Russell IJ, Winfield JB, Yunus MB. The American College of Rheumatology preliminary diagnostic criteria for fibromyalgia and measurement of symptom severity. Arthritis Care Res (Hoboken) 2010;62:600–610. doi: 10.1002/acr.20140. [DOI] [PubMed] [Google Scholar]
- 43.De Luca C, Scordo MG, Cesareo E, Pastore S, Mariani S, Maiani G, Stancato A, Loreti B, Valacchi G, Lubrano C, Raskovic D, De Padova L, Genovesi G, Korkina LG. Biological definition of multiple chemical sensitivity from redox state and cytokine profiling and not from polymorphisms of xenobiotic-metabolizing enzymes. Toxicol Appl Pharmacol. 2010 Nov 1;248:285–92. doi: 10.1016/j.taap.2010.04.017. [DOI] [PubMed] [Google Scholar]
- 44.Fukuda K, Nisenbaum R, Stewart G, Thompson WW, Robin L, Washko RM, Noah DL, Barrett DH, Randall B, Herwaldt BL, Mawle AC, Reeves WC. Chronic multisymptom illness affecting Air Force veterans of the Gulf War. JAMA. 1998;280:981–988. doi: 10.1001/jama.280.11.981. [DOI] [PubMed] [Google Scholar]
- 45.Steele L. Prevalence and patterns of Gulf War illness in Kansas veterans: association of symptoms with characteristics of person, place, and time of military service. Am J Epidemiol. 2000;152:992–1002. doi: 10.1093/aje/152.10.992. [DOI] [PubMed] [Google Scholar]
- 46.Miller G. Neuropathology. A battle no soldier wants to fight. Science. 2011;333:517–519. doi: 10.1126/science.333.6042.517. [DOI] [PubMed] [Google Scholar]
- 47.Heltemes KJ, Holbrook TL, Macgregor AJ, Galarneau MR. Blast-related mild traumatic brain injury is associated with a decline in selfrated health amongst US military personnel. Injury. 2012 Dec;43:1990–5. doi: 10.1016/j.injury.2011.07.021. [DOI] [PubMed] [Google Scholar]
- 48.McGeary D, Moore M, Vriend CA, Peterson AL, Gatchel RJ. The evaluation and treatment of comorbid pain and PTSD in a military setting: an overview. J Clin Psychol Med Settings. 2011;18:155–163. doi: 10.1007/s10880-011-9236-5. [DOI] [PubMed] [Google Scholar]
- 49.Eglinton R, Chung MC. The relationship between posttraumatic stress disorder, illness cognitions, defence styles, fatigue severity and psychological well-being in chronic fatigue syndrome. Psychiatry Res. 2011;188:245–252. doi: 10.1016/j.psychres.2011.04.012. [DOI] [PubMed] [Google Scholar]
- 50.Barnden LR, Crouch B, Kwiatek R, Burnet R, Mernone A, Chryssidis S, Scroop G, Del Fante P. A brain MRI study of chronic fatigue syndrome: evidence of brainstem dysfunction and altered homeostasis. NMR Biomed. 2011 Dec;24:1302–12. doi: 10.1002/nbm.1692. [DOI] [PMC free article] [PubMed] [Google Scholar]
- 51.MacDonald CL, Johnson AM, Cooper D, Nelson EC, Werner NJ, Shimony JS, Snyder AZ, Raichle ME, Witherow JR, Fang R, Flaherty SF, Brody DL. Detection of blast-related traumatic brain injury in U. S. military personnel. N Engl J Med. 2011;364:2091–2100. doi: 10.1056/NEJMoa1008069. [DOI] [PMC free article] [PubMed] [Google Scholar]
- 52.Jason LA, Skendrovic B, Furst J, Brown A, Weng A, Bronikowski C. Data mining: Comparing the empiric CFS to the Canadian ME/CFS case definition. J Clin Psychol. 2012 Jan;68:41–9. doi: 10.1002/jclp.20827. [DOI] [PMC free article] [PubMed] [Google Scholar]
- 53.Zheng Y, Ravindran M, Adewuyi O, Di Poto C, Timbo C, Esteitie R, editors. eZhengtricity © 2010: A free novel way to confidentially administer, track, receive and score medical questionnaires instantly. 10th International ME/CFS Conference; September, 2011; Ottawa, Canada. [Google Scholar]
- 54. www9.georgetown.edu/faculty/baraniuj. [Google Scholar]
- 55.Wasserfallen JB, Gold K, Schulman KA, Milzman D, Baraniuk JN. Development and validation of a rhinoconjunctivitis and asthma symptom score for use as an outcome measure in clinical trials. J Allergy Clin Immunol. 1997;100:16–22. doi: 10.1016/s0091-6749(97)70189-1. [DOI] [PubMed] [Google Scholar]
- 56.Wasserfallen JB, Gold K, Schulman KA, Baraniuk JN. Item responsiveness of a rhinitis and asthma symptoms score during a pollen season. J Asthma. 1999;36:459–465. doi: 10.3109/02770909909087288. [DOI] [PubMed] [Google Scholar]
- 57.Klockars AJ, Hancock GR, McAweeney MJ. Power of unweighted and weighted versions of simultaneous and sequential multiple comparison procedures. Psychological Bulletin. 1995;118:300–307. [Google Scholar]
- 58.National Institute of Standards and Technology. Tukey’s method. Engineering Statistics Handbook. Section 7.4.7.1. http://www.itl.nist.gov/div898/handbook/prc/section4/prc471.htm. [Google Scholar]
- 59.STROBE Statement. http://www.strobe-statement.org/index.php?id=available-checklists. [Google Scholar]