

Abstract
Background: Diabetic nephropathy (DN) is one of the most common chronic complications of diabetes and the leading cause of end-stage renal disease. Recent research has found that oxidative stress participates in the development of diabetic nephropathy. α-lipoic acid (α-LA), a powerful antioxidant, plays an important role in renal protection against DN, but the underlying mechanism remains unknown. This study modeled the renal protective effects of α-lipoic acid in streptozotocin (STZ) induced diabetic rats and explore the underlying mechanism, which provides new theoretical bases for clinical treatment of diabetic nephropathy. Methods: The diabetic model was induced by intraperitoneal injection of STZ on Male SD and then the diabetic rats were randomly divided into two groups: untreated-diabetic group (DM group), α-LA treated-diabetic group (α-LA group), and the normal rats served as control group (NC group). After 8 weeks of STZ induction, Blood glucose (BG), Blood Urea Nitrogen (BUN), Serum Creatinine (SCr) and urinary albumin excretion rate (UAER) were examined, and morphological changes were assessed by histology. The levels of malondialdehyde (MDA) and the activities of superoxide dismutase (SOD) were also evaluated in serum and renal cortex. Additionally, kidney mitochondrial membrane potential and mitochondrial swelling were measured for different groups. The expression of voltage-dependent anion channel (VDAC) on mitochondria were evaluated by both Western blotting and Immunohistochemistry. Results: After 8 weeks induction of STZ, significant reductions in BUN, SCr, UAER (P<0.01 or P<0.05) and histological improvement were observed in the α-LA group compared to the DM group. In the serum and renal cortex of α-LA group, the content of MDA and the activities of SOC were both significantly decreased (P<0.05). Compared to the DM group, the mitochondrial membrane potential in the α-LA group was significantly increased (P<0.05) and mitochondrial swelling was reduced. Meanwhile, the expression of VDAC on mitochondrial was significantly increased (P<0.05) in the α-LA group. Conclusion: Our findings indicate that antioxidant α-LA exerts a protective role against the development of DN, and the underlying mechanism may involve effective suppression of the generation of oxidants, protection of mitochondrial function, and up-regulating of VDAC expression.
Keywords: Diabetic nephropathy, reactive oxygen species, mitochondria, voltage-dependent anion channel, α-lipoic acid
Introduction
Diabetes mellitus has become a worldwide epidemic disease affecting both developing and developed countries. Nearly half of all patients with type 1 or type 2 diabetes will develop diabetic kidney disease (DKD) if they do not die of cardiovascular disease. Diabetic kidney disease is associated with a high cardiovascular mortality even in its early stages and about a third of patients with DKD will progress to end stage renal disease (ESRD) [1].
Oxidative stress has been considered a common pathogenetic factor of the diabetic complications including nephropathy, and reactive oxygen species (ROS) is the primary mediators in the oxidative stress. Interrupting the overproduction of ROS would normalize polyol pathway flux, AGE formation, PKC activation, hexosamine pathway flux and NF-kB activation, and each of the four mechanisms has been implicated in the pathogenesis of diabetic nephropathy [2].
As energy-generating organelles, mitochondria have potential roles in a variety of diseases which involve abnormal production of energy and reactive oxygen species (ROS) [3,4]. Mitochondrial permeability transition pore (PTP) is frequently the decisive event that delimits the frontier between survival and death [5,6]. Recently, the mitochondrial PTP, composed of a voltage-dependent anion channel (VDAC), adenine nucleotide translocator (ANT), etc., has been recognized as a major complex in MPT [7,8]. As a protein providing the pathway for transporting ions, ATP and other critical metabolites, VDAC plays a very important role in not only the regulation of basic mitochondrial function such as energy transduction but also substance metabolism and intracellular calcium homoeostasis. However, the relationship between mitochondrial pathology and mitochondrial VDAC level has not been described.
An earlier study has shown that treatment with antioxidant reduces diabetic complications [9]. α-Lipoic acid (α-LA) was a free radical scavenger and a potent natural antioxidant, which is useful in the prevention of diabetic nephropathy [10,11]. No study has been carried out on the effect of α-LA on mitochondria in the kidneys of diabetic rats. Hence, the present study evaluated the renal protection of α-LA against diabetic kidneys injury induced by STZ, addressed the activity of mitochondria in kidneys and the possible action of α-LA on mitochondrial PTPs by regulation of VDACs to explore possible mitochondrial mechanism underlying the renal protection of α-LA.
Methods
Diabetic rat model
A total of 24 male Sprague-Dawley rats (180–220 g) were purchased from the Comparative Medicine Center, Yangzhou University of China. They were housed in wire-bottomed cage under a 12 light/dark cycle. Room temperature (about 24±1 °C) and humidity (about 60%) were controlled automatically. They were allowed free access to standard laboratory chow and tap water. All animals were strictly treated in accordance with the Guideline for Use and Care of Medical Laboratory Animals from the National Institute of Health Guide for the Care and Use of Laboratory Animals. After several days of adaptation, streptozotocin (STZ, Sigma USA) diluted in citrate buffer 0.1M (pH 4.2) was injected intraperitoneally at a dose of 65mg/kg following overnight fasting. Rats were considered diabetic if the random tail blood glucose concentration was greater than 16.7 mmol/L 7 days after STZ treatment. Blood glucose levels were measured twice a week. Diabetic rats were divided into 2 groups (n =8 per group): untreated-diabetic group (DM group), α-LA treated-diabetic group (α-LA group), and the normal rats served as a control group (NC group). The NC and DM group were given distilled water, while the α-LA group was given intraperitoneal injections of α-LA (20 mg/kg per day) for 8 weeks, starting at the onset of diabetes.
Blood sample and tissue collection
After 8 weeks, body weight was measured at the conclusion of the experiment. Rats were then anesthetized by intraperitoneal injection of ketamine (100mg/kg), Blood was collected in tubes from abdominal aorta. The serum was rapidly separated from blood and processed for determination of serum creatinine (SCr) and blood urea nitrogen (BUN) using commercially available kits (He Fu Ltd, shanghai, China).
Both kidneys were isolated from each rat. Changes in kidney weight were recorded. Kidney tissues were homogenized in normal saline and aliquots of this homogenate were used for the assays. Kidney tissues were immediately excised after sacrifice and rinsed with ice-cold physiological saline for histological studies. The tissues were fixed in 10% buffered formalin immediately upon removal. They were gradually dehydrated, embedded in paraffin, cut into 5μm sections and stained with hematoxylin and eosin for histological examination.
Urinary albumin excretion (UAER)
Prior to being sacrificed, rats were placed in metabolic cages for collection of urine over 24 h for measurement of albumin concentration. Urine samples from each rat were measured. After centrifugation, aliquots of the supernatant were frozen at -70 °C for subsequent analysis of albumin concentration. Urinary albumin concentration was measured by enzyme-linked immunoabsorbent assay using an anti-rat albumin antibody and 24 h protein excretion was calculated by multiplying the urinary protein excretion by the 24 h urine volume.
Assessment of SOD activities and MDA content
Kidney tissues were rinsed, weighed, and put into tubes with nine volumes of 9g/l normal saline; the tubes were homogenized for 10min after wards. After centrifugation at 3000r/min for ten minutes at 4 degrees, the supernatants were collected and used immediately for the assays of MDA and SOD. The content of MDA were assayed by thiobarbituric acid, and the activities of SOD were measured by spectrophotometer assays. All steps were used according to the manufacturer’s instructions (Jiancheng Limited Company, Nanjing, Jiangsu, China).
Isolation of kidneys mitochondria
Mitochondria were prepared from rat kidneys according to the method of Apprille et al [12]. In brief, rats kidneys were excised and homogenized in isolation buffer containing 225 mmol/L mannitol, 75 mmol/L sucrose, 0.05 mmol/L EDTA, and 10 mmol/L Tris–HCl (pH 7.4) at 4 °C. The homogenates were centrifuged at 600g for 5 min to remove cell debris and the nuclear fraction. The supernatant was further centrifuged at 8800g for 10 min. The pellet was washed twice with the same medium. Protein concentration was determined using Coomassie brilliant blue.
Determination of mitochondrial swelling
Mitochondrial swelling was assessed by measuring the absorbance of their suspension at 540 nm. Kidney mitochondria of normal mice were prepared in the assay buffer (1.0 mg protein/ml) containing 125 mmol/L sucrose, 50 mmol/L KCl, 2 mmol/L KH2PO4, 5 μmol/L rotenone, 10 mmol/L Hepes, and 5 mmol/L succinate. The extent of mitochondrial swelling was assayed by measuring the decrease in absorbance (A540) every 30 seconds for 7 min with the multiplate reader (MD)after the addition of 50μmol/L Ca2+ at 30 degrees [13].
Measurement of mitochondrial membrane potential
Mitochondrial membrane potential (MMP) was evaluated according to Emaus et al. [14] from the uptake of the fluorescent dye rhodamine 123 (Rh123) which accumulates electrophoretically into energized mitochondria in response to their negative inside membrane potential. Kidney mitochondria isolated from normal mice were incubated at 25 °C in the assay buffer (0.5 mg protein ml-1) containing 225 mmol/L D-mannitol, 70 mmol/L sucrose, 5 mmol/L Hepes(N-2-hydroxyethylpiperazine-N-2-ethanesulfonic acid), 5 mmol/L succinate, and 5μmol/L rotenone, pH 7.2. MMP was assessed by fluorescence multiplate reader (MD) with excitation at 505 nm and emission at 534 nm after addition of 0.3μmol/L Rh123 at 25 °C [15].
Immunohistochemistry
4 μm paraffin serial sections were prepared from 4% paraformaldehyde fixed, paraffin embedded kidneys of the rats. Sections were de-waxed and hydrated, then endogenous peroxidase was quenched for 20 min using 3% (v/v) hydrogen peroxide in phosphate-buffered saline (PBS). Immunohistochemical staining was performed for VDAC protein using mouse anti-rat VDAC immunoglobulin (IgG) at a dilution of 1:50 (cell signaling , CA, USA) overnight at 4 °C. The following secondary biotinylated rabbit antibodies (cell signaling, CA, USA) at a dilution of 1:1000 were added to sections for 30 min at room temperature. Specific staining was detected using the standard ABC (avidin–biotin complex) Briefly, slides were incubated for 20 min with the appropriate secondary antibody and the avidin–biotin Vectastain ABC system (Vector Laboratories, CA, USA) was then applied for 20 min. After thorough washing, the final detection step was carried out using 3,3’-diaminobenzidine (Sigma, St Louis, Mo., USA) as the chromogen. Sections were lightly counterstained with haematoxylin. Non-specific staining was tested with 1% non-immunized goat serum. Images were acquired on an LAICA microscope.
Western blot analysis
Kidney samples were homogenized and lysed in SDS-PAGE sample buffer, boiled, centrifuged, and the supernatant recovered. The protein content was estimated by the dye binding assay of Bradford, with bovine serum albumin used as a standard. Samples were separated by SDS-PAGE, electroblotted onto nitrocellulose membranes, incubated with Blocking Buffer for 1 h, and incubated with primary antibody overnight at 4 °C. After the blots were washed, they were incubated with a HRP-labeled goat anti-rabbit IgG. The bound secondary antibody was detected by enhanced chemiluminescence. Housekeeping protein β-actin was used as a loading control. Positive immunoreactive bands were quantified densitometrically (Leica Q500IW image analysis system) and expressed as ratio of VDAC and to β-actin in optical density units.
Statistical analysis
All statistical analyses were performed with SPSS 11.0. Data were collected from repeated experiments and were presented as mean ± standard deviation (SD). One-way analysis of variance (ANOVA) and Student’s Newman Keuls test (SNK) was used for statistical analysis. Differences were considered significant if the P value was less than 0.05.
Results
Clinical parameters
Table 1 showed rats in the DM group had reduced body weight (BW) and increased kidney weight (KW), the ratio of KW to BW (KI) and blood glucose level (BG) (P <0.05 or P <0.01). No effects were observed with α-LA treatment.
Table 1.
Changes of BW、KW、KI and BG in different groups
| groups | n | BW(g) | KW(g) | KI(‰) | BG(mmol/L) |
|---|---|---|---|---|---|
| NC | 8 | 491.98±14.49 | 1.34±0.14 | 3.19±0.53 | 5.80±1.57 |
| DM | 8 | 228.10±21.2** | 1.72±0.11** | 6.93±0.56** | 21.27±4.10** |
| α-LA | 8 | 272.48±19.80* | 1.70±0.15** | 6.17±0.34** | 26.27±3.09** |
P <0.05,
P <0.01 vs NC (ANOVA and SNK).
In the DM group, BUN, SCr and UAER were significantly increased (P <0.05 or P <0.01) when compared to NC group, treatment with α-LA attenuated BUN, SCr and UAER from the diabetic rats (P <0.01), but BUN and UAER were still higher than that observed in NC group (P <0.05). (Table 2).
Table 2.
The level of BUN, SCr and UAER in different groups
| groups | n | BUN (mmol/L) | SCr (umol/L) | UAER (mg/24h) |
|---|---|---|---|---|
| NC | 8 | 6.30±1.26 | 32.00±2.52 | 21.55±7.05 |
| DM | 8 | 14.42±3.70** | 42.00±3.23* | 132.07±17.75** |
| α-LA | 8 | 9.61±1.90* ‡ | 33.17±2.85† | 100.88±28.92* † |
P <0. 05,
P <0. 01 vs NC;
P <0. 05,
P <0. 01 vs DM (ANOVA and SNK).
Pathological changes in kidneys
Histopathological studies of the kidneys revealed that the NC group presented kidneys with normal architecture (Figure 1A). The histopathological examination of kidneys in diabetic rats showed glomerular hypertrophy, mesangial cell proliferation, extracellular matrix accumulation were observed by optics microscope in the kidneys (Figure 1B). These abnormal pathological findings of tissue injury were reduced in α-LA group (Figure 1C).
Figure 1.
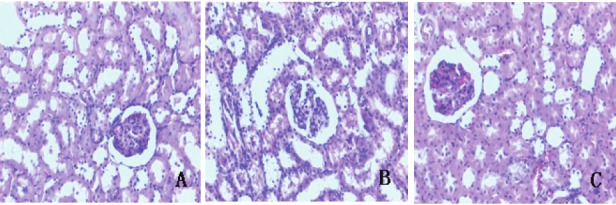
Structural changes in kidneys of different groups (A–C, HE staining, original magnification×200). Tissue A from NC group, B from DM group, C from α-LA group.
Oxidative stress parameter
In the serum and renal cortex of DM group, the content of MDA was significantly increased (P <0.01), and there was decrease in the activities of SOD (P <0.01). Both were significantly improved by α-LA treatment (P <0.05 or P <0.01). (Table 3).
Table 3.
SOD activities and MDA content in both serum and renal cortex of different groups
| groups | n | serum | renal cortex | ||
|---|---|---|---|---|---|
|
| |||||
| SOD (U/ml) | MDA (nmol/ml) | SOD (U/mgprot) | MDA (nmol/mgprot) | ||
| NC | 8 | 124.10± 9.27 | 2.97±0.77 | 89.89±17.62 | 2.98±0.75 |
| DM | 8 | 89.13±22.73** | 5.95±0.97** | 46.05±10.24** | 4.80±0.83** |
| α-LA | 8 | 114.71±8.82 † | 4.45±1.09* † | 74.13±10.48‡ | 3.49±0.50† |
P <0. 05,
P <0. 01 vs NC;
P <0. 05,
P <0. 01 vs DM (ANOVA and SNK).
The function of mitochondria
There were significant collapse of the mitochondrial membrane potential (P <0.05 ) and attenuation of Ca2+-induced mitochondrial swelling in the kidneys of diabetic rats, which indicated the decrease of the mitochondrial activity. Treatment with α-LA significantly inhibited the alterations of these parameters in the kidneys of diabetic rats (P <0.05 ) (Figure 2).
Figure 2.
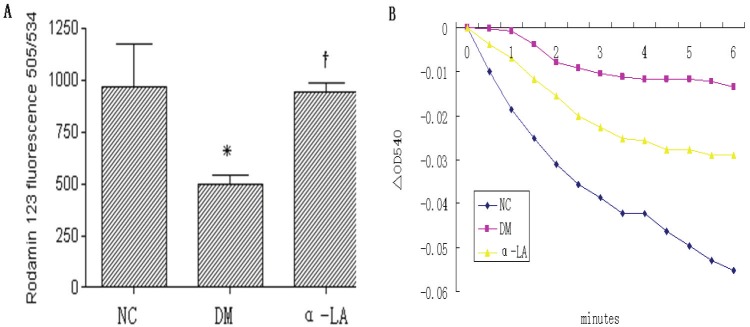
Mitochondria membrane potential (MMP) and Ca2+-induced mitochondrial swelling in kidneys of different groups. A: mitochondria membrane potential (ΔΨ) in kidneys of different groups. Each column represents mean values ± SD. There were eight rats per group. *p<0.05 vs NC. †p<0.05 α-LA vs DM. B: Ca2+-induced mitochondrial swelling in kidneys of different groups, which was assayed by the decrease in absorbance at 540 nm. The curves represent typical recordings from experiments of at least three different mitochondrial preparations.
The expression of VDAC on mitochondrial
VDAC protein expression was corroborated by Immunostaining and Western blot (Figure 3 and 4). VDAC in kidneys of NC group showed a strong signal, and in DM group showed a significant decrease (P <0.05). α-LA treatment significantly improved VDAC protein expression compared with diabetes rats (P <0.05).
Figure 3.
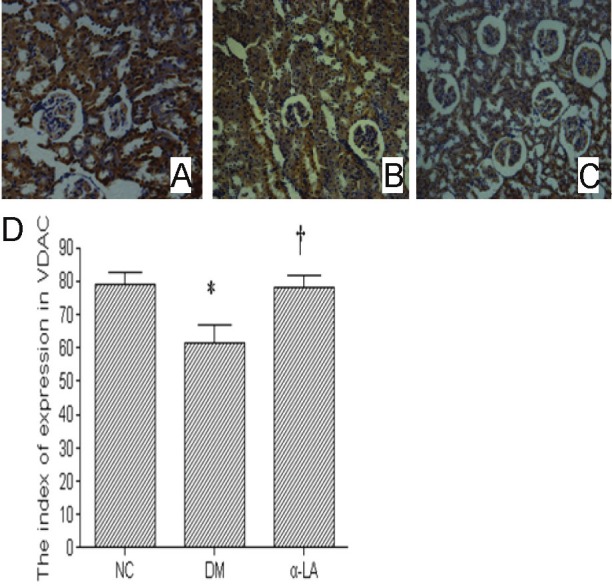
These example slides were processed for VDAC Immunostaining (200×). Tissue A was NC group, B from DM group, C from α-LA group. There were eight rats per group. Figure D showed data for index of expression in VDAC. There were eight rats per group. Data presented as mean values ± SD. *P <0.05 vs NC, †P <0.05 vs DM.
Figure 4.
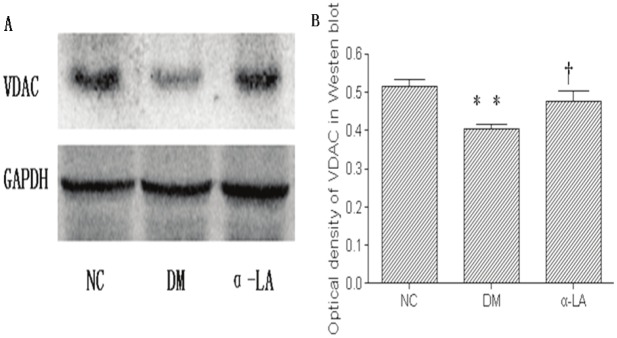
Western blotting for expression of VDAC in NC group, DM group and α-LA group (A). The optical density of VDAC is displayed in B. There were eight rats per group. Data presented as mean values±SD. **P <0.01 vs NC, †P <0.05 vs DM.
Discussion
ROS include free radicals such as superoxide (O2-), hydroxyl (OH), peroxide (H2O2) and non radical species such as hydrogen peroxide (H2O2) and hydrochlorous acid (HCIO). These free radicals act directly through oxidative damage on macromolecules (proteins, lipids, DNA) or indirectly [16]. MDA, the end product of lipid peroxidation, is considered a good marker of free radical–mediated damage and oxidative stress [17]. Efficient biochemical and bioenergetic mechanisms aimed at decreasing ROS production and clearing cellular ROS have emerged. The first antioxidant enzyme described is superoxide dismutase (SOD). This enzyme catalyzes the reaction that converts two O2 - and two H+ to H2O2 and O2 [18,19].
Our data suggests that diabetic rats presented early stage DN, such as the increase of BUN, SCr , UAER and damage of glomerular, mesangial cell after 8 weeks induction of STZ. Meanwhile, the ROS increase in the kidneys of diabetic rats were confirmed, which was indicated by the MDA content and the SOD activities. ROS production is exacerbated by the high concentrations of Ca2+, which is driven from the cytosol into the mitochondria by restoration of the mitochondrial membrane potential. These conditions favor an increase in mitochondrial membrane permeability and the induction of the mitochondrial permeability transition pore (mPTP), which cause swelling, collapse of membrane potential, and ultimately total inhibition of mitochondrial functions [20]. Significant Collapse of the mitochondrial membrane potential and attenuation Ca2+-induced mitochondrial swelling in the kidneys proved the decrease in the renal mitochondrial activities of diabetic rats. We can infer that the increased generation of ROS and mitochondrial injury form a vicious circle, while a large number of ROS can activate the four main mechanisms to produce more ROS, thereby aggravate the damage in the kidneys of diabetic rats.
Voltage-dependent anion channels (VDAC), also known as mitochondrial porins, are membrane proteins encoded by nuclear gene and synthesized in ribosome [21]. It is recognized that VDAC plays crucial roles in the physiological and pathologic process, including energy metabolism [22,23] and cell apoptosis [24,25]. However, there is a study showing that the fibroblasts lacking all VDACs were actually more sensitive to oxidative stress-induced cell death, suggesting that VDAC more likely functions as a protective protein [26]. Up to now, there is only scant information regarding the functions of VDAC on the mitochondrial in the kidneys of diabetic rats. In this study, we found normal rat kidneys showed a strong signal for VDAC, which was decreased in kidneys of diabetic rats. The up-regulation of VDAC exerts a protective role against the mitochondrial injury. The detailed mechanism awaits further study.
Alpha-lipoic acid (α-LA), a naturally occurring dithiol compound, has long been known as an essential cofactor for mitochondrial bioenergetic enzymes. As an antioxidant, α-LA directly terminates free radicals, chelates transition metal ions, increases cytosolic glutathione and vitamin C levels, and prevents toxicities associated with their loss [27]. In this study, we observed that α-LA treatment provided renal protection in diabetic rats with decreased BUN, SCr, UAER, alleviated glomerular and mesangial cell injuries without changing blood glucose levels. While, α-LA treatment significantly reduced the generation of ROS, which is proved by decreased MDA content and elevated SOD activities. Collapse of the mitochondrial membrane potential, attenuation of Ca2+-induced mitochondrial swelling and VDAC signal decrease in kidneys of diabetic rats were significantly ameliorated. In conclusion, the antioxidant α-LA exerts a protective role against the development of DN, the underlying mechanism may include effectively preventing the generation of oxidants, protecting mitochondrial function, and up-regulating the expression of VDAC protein.
Acknowledgement
This work was supported in part by Health research projects in Jiangsu Province (No. 200830).
References
- 1.Hakim FA, Pflueger A. Role of oxidative stress in diabetic kidney disease. Med Sci Monit. 2010;6:RA37–48. [PubMed] [Google Scholar]
- 2.Brownlee M. Biochemistry and molecular cell biology of diabetic complications. Nature. 2001;414:813–820. doi: 10.1038/414813a. [DOI] [PubMed] [Google Scholar]
- 3.Quintero M, Colombo SL, Godfrey A, Moncada S. Mitochondria as signaling organelles in the vascular endothelium. Proc Natl Acad Sci U S A. 2006;103:5379–84. doi: 10.1073/pnas.0601026103. [DOI] [PMC free article] [PubMed] [Google Scholar]
- 4.Armstrong JS. Mitochondria-Directed Therapeutics. Antioxid Redox Signal. 2008;10:575–578. doi: 10.1089/ars.2007.1929. [DOI] [PubMed] [Google Scholar]
- 5.Skulachev VP. Bioenergetic aspects of apoptosis, necrosis and mitoptosis. Apoptosis. 2006;11:473–485. doi: 10.1007/s10495-006-5881-9. [DOI] [PubMed] [Google Scholar]
- 6.Bernardi P, Krauskopf A, Basso E, Petronilli V, Blachly-Dyson E, Di Lisa F, Forte MA. The mitochondrial permeability transition from in vitro artifact to disease target. FEBS J. 2006;273:2077–2099. doi: 10.1111/j.1742-4658.2006.05213.x. [DOI] [PubMed] [Google Scholar]
- 7.Kim JS, Na CS, Pak SC, Kim YG. Effects of yukmi, an herbal formula, on the liver of senescence accelerated mice (SAM) exposed to oxidative stress. Am J Chin Med. 2000;28:343–350. doi: 10.1142/S0192415X00000404. [DOI] [PubMed] [Google Scholar]
- 8.Godbole A, Varghese J, Sarin A, Mathew MK. VDAC is a conserved element of death pathways in plant and animal systems. Biochim Biophys Acta. 2003;1642:87–96. doi: 10.1016/s0167-4889(03)00102-2. [DOI] [PubMed] [Google Scholar]
- 9.Wohaieb SA, Godin DV. Alterations in free radical tissue-defense mechanisms in streptozocin-induced diabetes in rat. Effects of insulin treatment. Diabetes. 1987;36:1014–1018. doi: 10.2337/diab.36.9.1014. [DOI] [PubMed] [Google Scholar]
- 10.Melhem MF, Craven PR, Derubertis FR. Effects of dietary supplementation of alpha-Lipoic Acid on early glomerular injury in diabetes mellitus. J Am Soc Nephrol. 2001;12:124–133. doi: 10.1681/ASN.V121124. [DOI] [PubMed] [Google Scholar]
- 11.Siu B, Saha J, Smoyer WE, Sullivan KA, Brosius FC 3rd. Reduction in podocyte density as a pathologic feature in early diabetic nephropathy in rodents: Prevention by lipoic acid treatment. BMC Nephrology. 2006;7:6. doi: 10.1186/1471-2369-7-6. [DOI] [PMC free article] [PubMed] [Google Scholar]
- 12.Aprille JR, Hom JA, Rulfs J. Liver and skeletal muscle mitochondrial function following burn injury. J Trauma. 1977;17:279–288. doi: 10.1097/00005373-197704000-00004. [DOI] [PubMed] [Google Scholar]
- 13.Lee CS, Han JH, Jang YY, Song JH, Han ES. Differential effect of catecholamines and MPP(+) on membrane permeability in brain mitochondria and cell viability in PC12 cells. Neurochem Int. 2002;40:361–369. doi: 10.1016/s0197-0186(01)00069-9. [DOI] [PubMed] [Google Scholar]
- 14.Emaus RK, Grunwald R, Lemasters JJ. Rhodamine 123 as a probe of transmembrane potential in isolated rat-liver mitochondria: spectral and metabolic properties. Biochim Biophys Acta. 1986;850:436–448. doi: 10.1016/0005-2728(86)90112-x. [DOI] [PubMed] [Google Scholar]
- 15.Varbiro G, Veres B, Gallyas F Jr, Sumegi B. Direct effect of Taxol on free radical formation and mitochondrial permeability transition. Free Radic Biol Med. 2001;31:548–558. doi: 10.1016/s0891-5849(01)00616-5. [DOI] [PubMed] [Google Scholar]
- 16.Forbes JM, Coughlan MT, Cooper ME. Oxidative stress as a major culprit in kidney disease in diabetes. Diabetes. 2008;57:1446–1454. doi: 10.2337/db08-0057. [DOI] [PubMed] [Google Scholar]
- 17.Kasperska-Zajac A, Brzoza Z, Rogala B, Polaniak R, Birkner E. Antioxidant enzyme activity and malondialdehyde concentration in the plasma and erythrocytes of patients with urticaria induced by nonsteroidal anti-inflammatory drugs. J Investig Allergol Clin Immunol. 2008;18:372–5. [PubMed] [Google Scholar]
- 18.Magder S. Reactive oxygen species: toxic molecules or spark of life? Crit Care. 2006;10:208. doi: 10.1186/cc3992. [DOI] [PMC free article] [PubMed] [Google Scholar]
- 19.Storz P. Reactive oxygen species-mediated mitochondria-to-nucleus signaling: a key to aging and radical-caused diseases. Sci STKE. 2006;2006:re3. doi: 10.1126/stke.3322006re3. [DOI] [PubMed] [Google Scholar]
- 20.Crompton M. The mitochondrial transition pore and its role in cell death. Biochem J. 1999;341:233–249. [PMC free article] [PubMed] [Google Scholar]
- 21.Schein SJ, Colombini M, Finkelstein A. Reconstitution in planar lipid bilayers of a voltage-dependent anion-selective channel obtained from paramecium mitochondria. J Membr Biol. 1976;30:99–120. doi: 10.1007/BF01869662. [DOI] [PubMed] [Google Scholar]
- 22.Zizi M, Forte M, Blachly-Dyson E, Colombini M. NADH regulates the gating of VDAC, the mitochondrial outer membrane channel. J Biol Chem. 1994;269:1614–1616. [PubMed] [Google Scholar]
- 23.Rostovtseva TK, Bezrukov SM. ATP transport through a single mitochondrial channel, VDAC, studied by current fluctuation analysis. Biophys J. 1998;74:2365–2373. doi: 10.1016/S0006-3495(98)77945-7. [DOI] [PMC free article] [PubMed] [Google Scholar]
- 24.Desagher S, Martinou JC. Mitochondria as the central control point of apoptosis. Trends Cell Biol. 2000 Sep;10:369–377. doi: 10.1016/s0962-8924(00)01803-1. [DOI] [PubMed] [Google Scholar]
- 25.Tsujimoto Y, Shimizu S. The voltage-dependent anion channel: an essential player in apoptosis. Biochimie. 2002;84:187–193. doi: 10.1016/s0300-9084(02)01370-6. [DOI] [PubMed] [Google Scholar]
- 26.Baines CP, Kaiser RA, Sheiko T, Craigen WJ, Molkentin JD. Voltage-dependent anion channels are dispensable for mitochondrial-dependent cell death. Nat Cell Biol. 2007;9:550–555. doi: 10.1038/ncb1575. [DOI] [PMC free article] [PubMed] [Google Scholar]
- 27.Singh U, Jialal I. Alpha-lipoic acid supplementation and diabetes. Nutr Rev. 2008;66:646–657. doi: 10.1111/j.1753-4887.2008.00118.x. [DOI] [PMC free article] [PubMed] [Google Scholar] [Retracted]