Summary
Background
Chronic obstructive pulmonary disease (COPD) is an inflammatory disease associated with reactive oxygen species (ROS) production. The aim of this study was to evaluate the effect of Hypoxen® treatment and the effect of HyFnC60 on ROS production in patients’ blood.
Material/Methods
ROS production in blood was estimated using chemiluminescence (CL) measurement with CL-amplifiers: luminol (LM), LM + zymosan (ZM) or lucigenin (LC) in the presence or absence of hydrated fullerenes (HyFnC60) added to blood in low concentrations.
Results
In all the patients with COPD in remission phase with Hypoxen® prescription, the LM-dependent CL (LM-CL) with ZM and LC-enhanced CL (LC-CL) decreased after the treatment. Parameters of CL and effects of HyFnC60 upon them depended on blood state. Addition of HyFnC60 to blood decreased data scattering and helped to improve discrimination between different groups of patients. Using the discriminator analysis, we found the most important time-points in the kinetic curves of CL for classification of patients into groups (eg, COPD patients before and after treatment with Hypoxen®; patients’ blood with different sensitivity to HyFnC60 concentration).
Conclusions
Monitoring of CL of non-diluted whole blood in COPD patients can be used for the estimation of the Hypoxen® efficiency in complex therapy. Addition of HyFnC60 to blood increases sensitivity of the method.
Keywords: blood, chemiluminescence, reactive oxygen species, chronic obstructive pulmonary disease, Hypoxen®, hydrated C60 fullerenes
Background
The bronchopulmonary system depends on the oxygen balance in the whole body, so broncho-obstructive disease or injury to the lung parenchyma will inevitably lead to the development of more or less deep hypoxia, depending on the severity of the disease. One such disease is COPD, which is characterized by airflow limitation and prolonged chronic inflammation that violate the architectonics of the bronchi and lung parenchyma [1]. It is believed that some diseases, such as cardiovascular diseases, osteoporosis, cachexia, and anaemia, are systemic consequences of COPD [2,3].
The key mechanism of pathogenesis of COPD is the inflammation that occurs in response to exposure to toxic substances that leads to inflammation, which contributes to mucus secretion, fibrosis, and destruction of alveolar walls. In addition, genetic factors [4], the immune system, oxidative stress, and abnormal expression of reparative processes contribute to the development and maintenance of COPD.
Currently, the role of oxidative stress is regarded as an important additional factor contributing to the disease [5,6]. Under the conditions of hypoxia and inflammation, characteristic for COPD, different cells are involved in the generation of ROS, represented by superoxide anion radical, hydrogen peroxide, hydroxyl radical and other highly reactive chemical compounds. Reactions in which ROS appear may be monitored using sensitive luminometers if chemiluminescent probes, in particular LM or LC, are added to the reaction systems.
ROS are highly chemically reactive and need to be controlled to prevent damage. The system of control is generally known as the antioxidant system. In this study we used Hypoxen®, which is the promising new antioxidant and anti-hypoxant that demonstrates remarkable ROS protective effect in patients with COPD and appears to have very few contradictions.
The aim of the current study was to compare the level of ROS in the undiluted whole blood of 3 groups of volunteers: patients with COPD before treatment with Hypoxen®, patients with COPD after treatment with Hypoxen®, and patients suffering from acute attack. A statistically significant decrease in ROS contents in blood was observed after Hypoxen® treatment of COPD. We also found that addition of HyFnC60 to whole blood generally alters the intensity of CL developing in blood, and also decreased data scattering between parallel probes.
Material and Methods
This was an open, nonrandomized, prospective study of the efficacy of Hypoxen®, including patients with COPD (GOLD stages III and IV). Criteria of inclusion: age ≥40 years, smoking ≥20 packs/year, forced expiratory volume in 1 second (FEV1) <50%, FEV1/forced vital capacity (FVC) <70% of predicted, stable COPD, no changes in treatment, and no exacerbations COPD. Therapy for COPD includes treatment with a β2-agonist and/or anti-cholinergetic and/or inhalation corticosteroids.
The study was approved by the Hospital Medical Ethics Committee (Moscow City Clinical Hospital #23 *Medsantrud*), and all the patients gave informed consent.
The patients (60 persons) involved in the study took Hypoxen® 250 mg (750 mg b.d.) during 2 months. Hypoxen® therapy was added to the standard treatment of stable COPD.
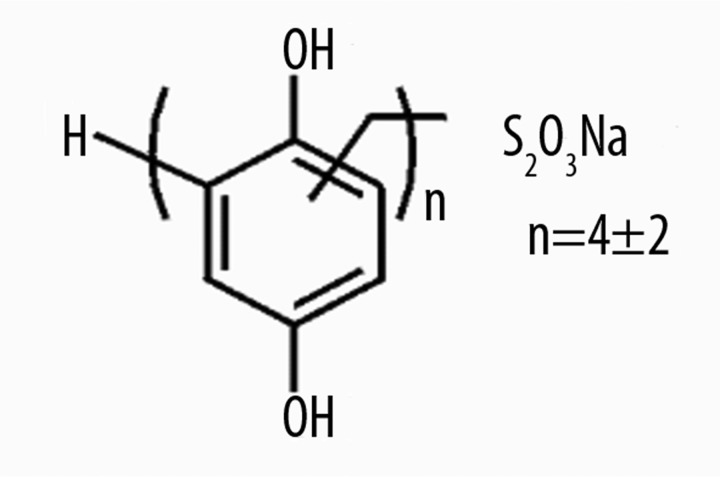
Hypoxen® (Polydihydroxyphenylenthiosulfonate sodium) (Figure 1).
Figure 1.
Hypoxen structure.
The estimates of efficacy were based on spirometric assessment of lung function. Patients had a FEV1 and FVC by spirometer (Master Screen Pneumo, Erich Jaeger GmbH, Germany). Oxygen saturation (SaO2) was estimated by pulse oximeter (Beijing Choice Electronic Tech Co., LtdJ., China). We used the COPD Assessment Test (CAT) for measuring the impact of COPD on patients (http://www.CATestonline.org). Lung function tests, SaO2, and CL were made the first and the last day of the study (2-months treatment with Hypoxen®).
The patients with acute attack of COPD were involved in the study as a comparison group. We compared the level of CL in the blood in the patients with stable COPD and exacerbation of COPD. The measurement was made only once in both groups of patients. The patients with exacerbation of COPD did not take Hypoxen®. Therapy of acute attack of COPD included antibacterial treatment and/or corticosteroids (i.v. or per os), mucoactive treatment (except for N-acetylcysteine), β2-agonist by nebulizer (Table 1).
Table 1.
Characteristics of patients with COPD.
| Stable COPD | Exacerbation of COPD | |
|---|---|---|
| No. of patients | 60 | 20 |
| Age, years | 60.5±8.7 | 58.2±9.2 |
| Smoking, packs/years | 36.9±9.18 | 40.2±7.8 |
| Therapy of LABA,% of patients | 60 | 50 |
| Therapy of ICS,% of patients | 80 | 60 |
| Dose of ICS (beclometasone), μg | 648.9±163.2 | 726.2±124.2 |
| Therapy of IA,% of patients | 40 | 40 |
| FEV1, L | 1.32±0.53 | 0.62±0.43* |
| FEV1,% of predicted | 39.6±14.1 | 25.6±9.6* |
| FEV1/FVC,% of predicted | 53.9±10.85 | 44.2±9.5* |
| SaO2,% | 94.8± 1.29 | 89.7±0.5* |
| CAT | 19.3± 9.3 | 10.1±6.2* |
p<0.05;
LABA – inhaled long-acting b2-agonist; ICS – inhaled corticosteroid; IA – inhaled anticholinergics.
Summary statistics are presented as proportions [with 95% confidence intervals (CI)] or means [with standard deviations (SD)]. The invariable associations between time period and variables were examined using 2-sample t-tests.
Blood of patients with COPD was obtained by venous puncture and was stabilized by heparin 0.1 ml (1000 IU)/10 ml of blood. Blood was obtained between 9.00 and 10.00 a. m. and was used exactly 3 hours after extravasion. During this period it was kept in plastic tubes at 20–25°C.
Whole undiluted blood CL was registered after addition to blood of either LC (a probe for superoxide radical anion) or LM (a probe for multiple ROS). The stock solution of LM was obtained by dissolving it in DMSO to a concentration of 0.02 M. The stock solution of LC was obtained by dissolving it in saline to a concentration of 0.02 M. Both were added to whole blood to a final concentration of 0.1 mM. In cases when respiratory burst was induced in blood by ZM, the latter was added to blood to make a final concentration of 0.5 mg/ml, 5 minutes after LM addition. Additives (10 μl each) were added to 0.2 ml of blood in 1.5 ml Eppendorf polyethylene test tubes.
Initial solution HyFnC60 (1 mM) was provided by G.V. Andrievsky. Serial decimal dilutions of HyFnC60 were carried out in saline and each next dilution was stirred on a Vortex shaker for 5 seconds. Five μl HyFnC60 dilutions were added to blood 1 min before adding of LM or LC. As a control, 5 μl of saline solution was added to blood instead of HyFnC60.
CL from blood was registered using a single photon counter ≪Biotox-7a≫ (Russia) (Figure 2), equipped with a photomultiplier with a S-11 photocathode having a maximum response (sensitivity) in the wavelength range 400–500 nm, and a window 5 cm in diameter. The photomultiplier was deployed horizontally and registered flux of photons from the lateral surface of test tubes with blood. Kinetics of CL was registered from undiluted whole blood without or in the presence of HyFnC60 for 5–15 min. The results were automatically fed to the computer in the ASCII format. CL intensity was expressed as the number of impulses per second. All the operations were performed at dim ambient illumination.
Figure 2.

Equipment for the registration of nondiluted whole blood CL (Biotox-7a).
Processing of the results and calculations was performed using the software packages Microsoft® (USA) – Microsoft Office 2003 – Excel 2003; statistical multifunctional program Statistica V.5.0 and V.6.0. Discriminant analysis (DA), a section of multivariate statistical analysis, was used for the interpretation of intergroup differences, classification and analysis of the results obtained in the studied group of patients.
Results
There were no differences in age, smoking and treatment characteristics between stable and exacerbation of COPD patients. The patients with exacerbation of COPD had lower FEV1, FEV1/FVC, SaO2 and CAT than patients with stable COPD (p<0.05).
We have not found any changes in FEV1 (L and% of predict.), FEV1/FVC (% of predict) and SaO2 before and after taking Hypoxen® (Table 2).
Table 2.
Lung function measurements, results of SaO2 and questionnaire data of CAT in the patients with stable COPD.
| Before taking Hypoxen® | After taking Hypoxen® | |
|---|---|---|
| FEV1, L | 1.32±0.53 | 1.37±0.43 |
| FEV1,% of predicted | 39.6±14.1 | 42.7±10.6 |
| FEV1/FVC,% of predicted | 53.9±10.85 | 56.2±11.2 |
| SaO2,% | 94.8±1.29 | 94.9±1.4 |
| CAT | 19.3±9.3 | 15.3±9.0* |
p<0.05.
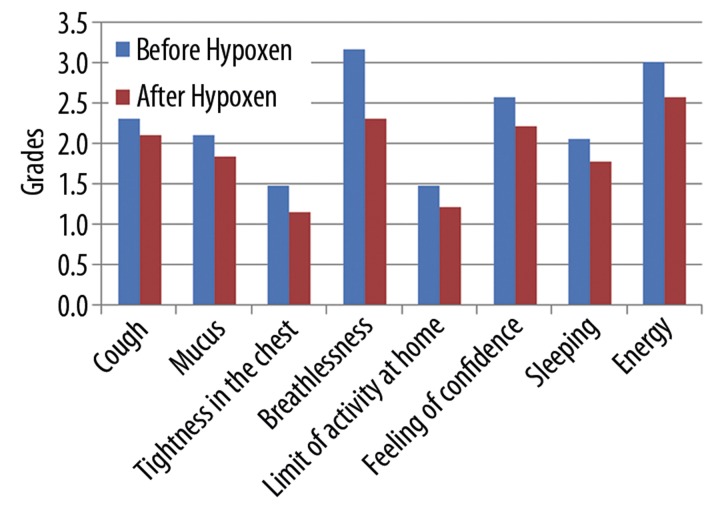
The data (Figure 3) show decrease in breathlessness, increase in any activity at home, improvement in feeling of confidence and increase in energy in the patients after taking Hypoxen®. We did not find any influence on cough, mucus, feeling of tightness in the chest and sleeping (p>0.05).
Figure 3.
Changes in clinical parameters of patients before Hypoxen® treatment and after it.
We found statistically significant decrease in total score of CAT after Hypoxen® therapy (18.3±9.3 vs. 15.2±9.0 [p=0.0002]).
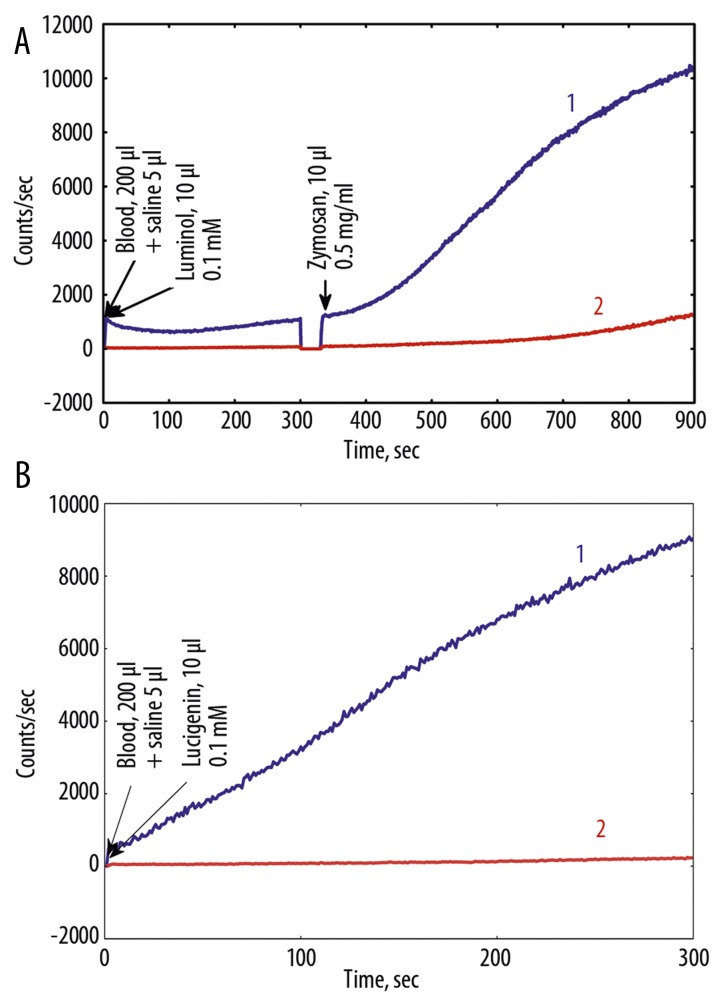
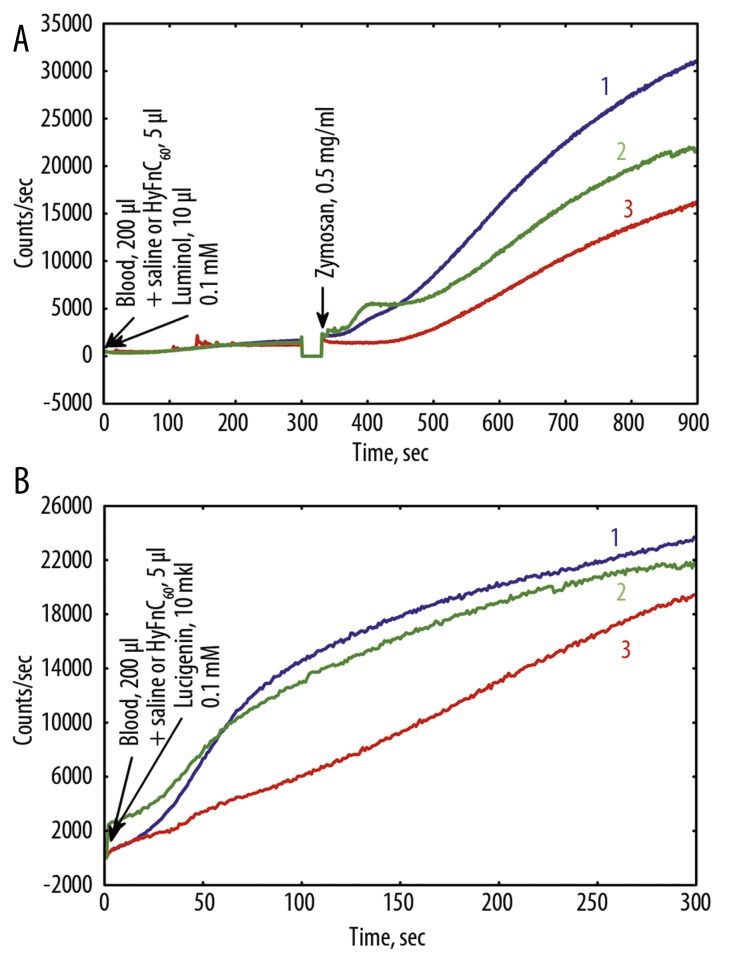
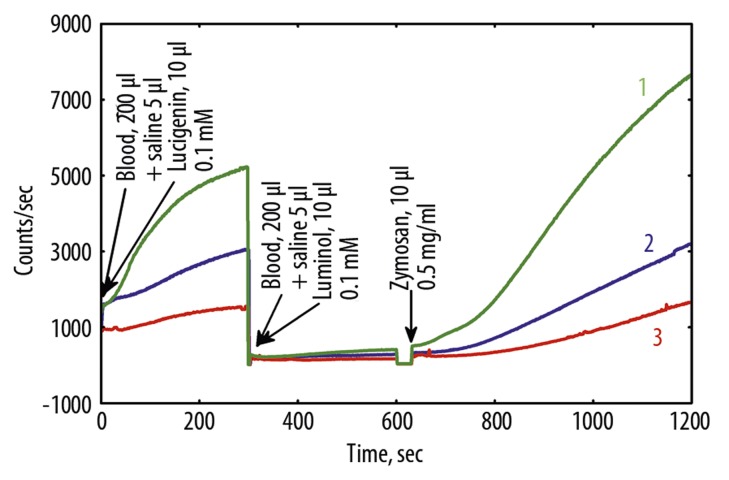
Dynamics of CL of whole venous blood of all patients was measured and analyzed. Dynamics of clinical symptoms in all patients with COPD during the treatment with Hypoxen® was also estimated. In each case, measurement of CL intensity was carried out on not less than 3 samples of undiluted blood of patients with COPD. Typical kinetics of CL in blood of 2 patients before treatment, after treatment with Hypoxen® with different CL intensity is presented in Figure 4, 5.
Figure 4.
(A) Luminol and luminol+Zymosan, and (B) lucigenin dependent CL (high intensity case) of nondiluted blood before and after Hypoxen® treatment (patient P.). 1 – before Hypoxen® treatment, 18.08.09; 2 – after Hypoxen® treatment, 06.10.09.
Figure 5.
(A) Luminol and luminol+Zymosan, and (B) lucigenin dependent CL (low intensity case) of nondiluted blood before and after Hypoxen® treatment (patient R.). 1 – before Hypoxen®, 23.10.09; 2 – after Hypoxen® treatment, 29.12.09.
Parameters of blood CL depend both on the health status of patients, and properties of blood of a particular individual reflecting the immunity status of a patient. Therefore, the CL intensity of blood varied considerably from patient to patient. However, after treatment with Hypoxen®, CL intensity of blood was lower than that in patients prior to the application of Hypoxen®, as a rule, regardless of the intensity of CL (Figures 4, 5).
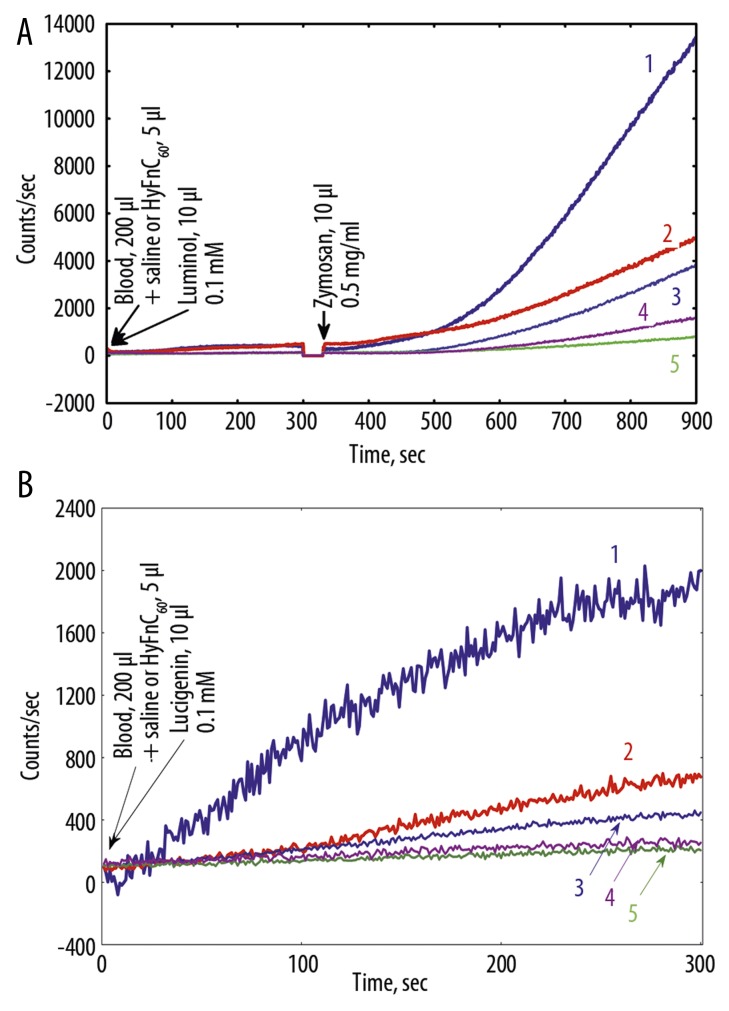
After treatment with Hypoxen® patient’s P. and patient’s R. FEV1 rose to 130 and 120 mm, respectively. Patient’s P. SaO2 increased from 95% to 97%. In contrast, patient’s R. SaO2 decreased from 95% to 93%. Both patients improved exercise tolerance from 2 to 3 points on the SAT Questionnaire. Addition of HyFnC60 to blood of COPD patients before and after Hypoxen® treatment altered LM-amplified CL-response to ZM and LC- CL (Figure 6). It is interesting that HyFnC60 in low (10−6 M) and especially ultra-low (10−19 M) concentrations drastically reduced LM- and LC-CL of blood after Hypoxen® treatment, amplifying the contrast between the groups of patients before and after treatment.
Figure 6.
Effects of HyFnC60 on Luminol and luminol+-zymosan- (A) and lucigenin- (B) dependent CL of nondiluted blood of COPD patient T. at HyFnC60 action. 1 – before Hypoxen® treatment, 15.10.09, no HyFnC60; 2 – 1 + HyFnC60 (10−19 M); 3 – after Hypoxen® treatment, 22.12.09, no HyFnC60; 4 – 3 + HyFnC60 (10−6 M); 5 – 3 + HyFnC60 (10−19 M).
In many cases of patients suffering acute attack, both LM-dependent CL and especially LC- CL of blood were rather high. Addition of 10−6 M or 10−19 M of HyFnC60 to blood usually attenuated CL (Figure 7). It is interesting that HyFnC60 in concentrations 10−7 M and 10−11 M did not have any effect on blood CL.
Figure 7.
Effects of HyFnC60 on Luminol and luminol+zymosan- (A) and lucigenin- (B) dependent chemiluminescence of nondiluted blood of COPD patient T-v. suffering acute attack. 1 – no HyFnC60; 2 – HyFnC60 (10−19 M); 3 – HyFnC60 (10−6 M).
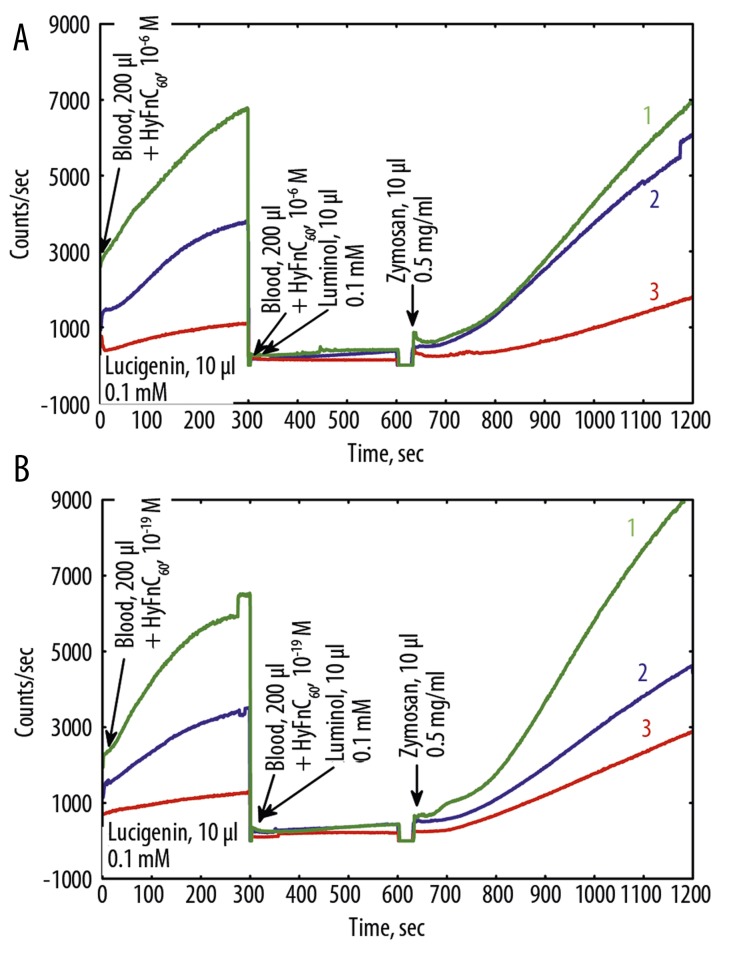
To apply DA to the all the experimental data, the averaged data of CL kinetics for all the patients were plotted on graphs. Figure 8 shows averaged kinetics for blood of patients in remission before treatment with Hypoxen® and after treatment, as well as the blood of patients in a state of acute attack, Figure 9 shows the kinetics of CL of blood of patients in the presence of 10−6 M of HyFnC60 (Figure 9A), and 10−19 M of HyFnC60 (Figure 9B). In these graphs we can see the difference between kinetics of CL of blood before and after treatment and in the state of acute attack, and the effects of HyFnC60 upon CL parameters.
Figure 8.
Changes in the dynamics of the average values of the intensity of whole blood CL in 30 patients with COPD before (2) and after (3) therapy by Hypoxen® and during acute attack (1)
Figure 9.
Changes in the dynamics of the average values of the intensity of whole blood CL in patients with COPD before (2) and after (3) therapy with Hypoxen® and during acute attack (1) in the presence of HyFnC60: (A) – 10−6 M; (B) – 10−19 M.
We compared the intensity of CL at selected time-points (143 s, 260 s, 772 s, 804 s, 860 s, 907 s, 951 s, 1094 s, 1110 s, 1150 s) corresponding to the maximum difference in the intensity of CL between the groups, and applied DA for these time-points. The results of such data processing may be presented in the form of the coefficients of the classification function for each patient’s group in tabular form.
The coefficients of the variables for the discriminant function were calculated using Statistica V.6.0. A linear classification function for patients from different groups was designed. A linear function:
The function is called the canonical discriminant function with unknown coefficients βi. Here dkm – the value of the discriminant function for the m-th object in the group k; xikm – the value of the discriminant variable xi for the m-th object in the group of k. From a geometric point of view, the discriminant functions define a hypersurface in p-dimensional space. In the particular case p=2 it is a straight line, and p=3 plane [7].
Thus, estimation of CL intensity of blood of all the tested patients before and after treatment allowed us to pick out time-points during the registration process of CL.
For example, discrimination functions for groups of patients with COPD before (1), after (2) are the following:
where X143, X260, X1150 – CL intensity values in corresponding time points.
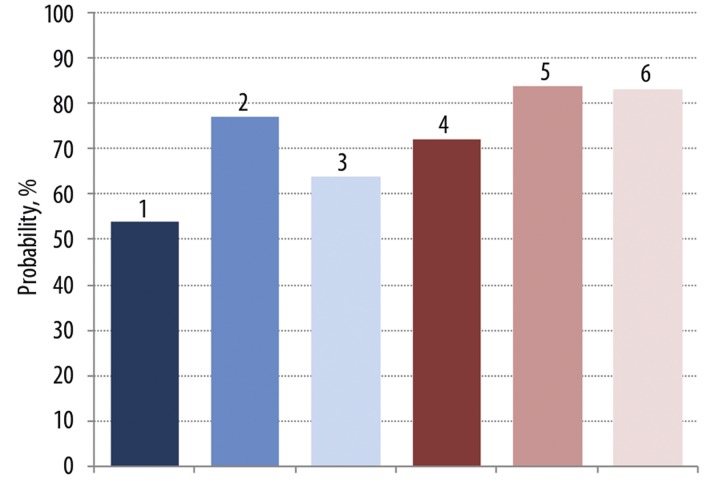
Discrimination functions for 3 groups of patients with COPD (before and after treatment with Hypoxen® and during the acute attack) were also calculated (Figure 10). Here the probability of discrimination between 3 groups was 54%. In the presence of 10−6 M or 10−19 M HyFnC60 in blood, the probability of discrimination between 3 groups increased to 77% and 64%, respectively. Thus, addition of HyFnC60 in low and ultra-low concentrations to blood of patients for the evaluation the parameters of LM, LM+ZM, and LC-CL helps to improve discrimination between the groups of COPD patients.
Figure 10.
The measured parameters changed in a group of COPD patients before and after Hypoxen® treatment and at acute attack by 54% without HyFnC60 (1st bar). In presence of HyFn (10−6 and 10−19 M) in blood of these patients – by 77 and 64% (2nd and 3th bars). Kinetic CL parameters of COPD patients blood before and after Hypoxen® treatment can be discriminated with the probability of 72, 85 and 83% (4th, 5th and 6th bars respectively). The results of the 5th bar were obtained in presence of 10−6 M HyFnC60, 6th contained 10−19 M HyFnC60.
Application of these classification functions to the whole set of experimental data of CL measurement of whole blood of patients before and after Hypoxen® treatment allowed us to evaluate the probability of inclusion of patients to a particular group, which is 72%. Taking into consideration that the whole number of patients whose blood was used for CL measurements was only 30, this probability is rather high. If CL measurement was performed on blood in the presence of 10−6 M or 10−19 M HyFnC60, the probability of discrimination between the 2 groups increased to 83–84%.
Figure 8 shows averaged kinetics for blood of patients in remission before treatment with Hypoxen® and after treatment, as well as the blood of patients in a state of acute attack, Figure 9 shows the kinetics of CL of blood of patients in the presence of 10−6 M of HyFnC60 (Figure 9A), and 10−19 M of HyFnC60 (Figure 9B). In these graphs we can see the difference between kinetics of CL of blood before and after treatment and in the state of acute attack, and the effects of HyFnC60 upon CL parameters.
Discussion
Recent estimations have shown that in adults >15% of oxygen consumed is turned into ROS under resting conditions and much more when their activity is high [8]. The process of one-electron oxygen reduction, in which energy of electronic excitation is generated, continuously occurs in human blood [9]. We have previously shown that LM-CL from undiluted whole blood of angina pectoris patients significantly exceeds that of blood of healthy donors, and its intensity diminishes in the course of successful treatment [10].
In this study it has been shown that Hypoxen® treatment significantly lowers the possibility of intense LM+ZM- and LC-induced ROS production in whole undiluted blood of COPD patients in vitro. In numerous parallel CL measurements it is shown that without Hypoxen® treatment and without addition of HyFnC60 ROS production is comparatively more intense in whole blood. 10−6 M and 10−19 M concentrations of HyFnC60 were used in the study because they had the most statistically significant impact on ROS production rate. Interestingly, 10−19 M HyFnC60 alone added to blood of patients without Hypoxen® treatment remarkably lowered ROS production (by more than 50%, Figure 5). Hypoxen® treatment promoted even lower ROS production than in the latter case. Addition of HyFnC60 to blood in vitro in a concentration of 10−6 M noticeably enhanced the effect of Hypoxen® and 10−19 M brought ROS production almost to the zero level. This data refers both to LM+ZM and LC-dependent ROS generation. The above data were obtained from patients with a chronic course of COPD. The same pattern of HyFnC60 effect without Hypoxen® treatment was observed with blood of patients suffering an acute attack, except that 10−6 M concentration of HyFnC60 had a larger effect on ROS production decrease than 10−19 M did. Comparing Figure 5 and Figure 6 it is clear that ROS generation rate is more than twice as intense in case of an acute attack than in a chronic case. HyFnC60 are 12% more effective in case of acute attack.
Recently, peculiar antioxidant properties of HyFnC60 were described [11]. Fullerenes are closed spherical polyhedrons entirely constructed of three coordinated carbon atoms. Fullerene C60 is the most stable compound, with 12 pentagonal and 20 hexagonal rings [12,13].
Fullerenes are insoluble in water but they can be hydrated without their modification or use of detergents. This method allows us to produce a genuine solution of fullerenes in which each C60 molecule is covered by a rather thick stable water shell that may consist of multiple water layers [14,15]. Fullerene molecules in HyFnC60 preparations cannot directly interact with any other molecules besides water of aqueous shells, and it is considered that their multiple biological effects including antioxidant effects are related to structured water that represents a unique biologically active agent [16].
Currently, much data has been accumulated on the potential use of fullerenes in medicine and biology [17]. Hydrated fullerenes (HyFnC60) in low concentrations cause nonspecific antibacterial, antiviral and anti-inflammatory effects, and a neuroprotective effect in alcoholism [18]. Of particular interest are studies in which the effect of hydrated fullerenes on cancers was studied [17]. As shown, no toxicity was traced during the whole period of the experiments [19].
In the presence of HyFnC60 the effect of Hypoxen® became clearer and the 3 groups of the examined patients appeared more discrete, according to DA. Thus, HyFnC60 help better identify differences between groups of patients studied.
Numerous studies have confirmed the antioxidant activity of fullerenes. Antiradical properties of fullerenes were usually explained by direct scavaging of free radicals by the fullerene carbon cage. However, most recent studies show that numerous effects of HyFn upon a wide range of processes going on both in vivo and in vitro may be related both to their ability to make the aqueous environment in which these processes go on more ordered, and simultaneously to modulate redox reactions that continuously proceed in aqueous systems [20]. It had been shown previously that antioxidants can function in very low concentrations [21], supposedly via water structuring, which is consistent with the data of this study.
Conclusions
Hypoxen® treatment of COPD patients resulted in significant alternation of LM-ZM-dependent and LC-CL of whole blood of patients. This is consistent with the claimed strong antioxidant activity of Hypoxen®. HyFnC60 added to blood in vitro enhanced the effect caused by Hypoxen®, which was given in vivo. Moreover, HyFnC60 lowered standard deviation values of the data. Interestingly, not all the studied HyFnC60 concentrations equally influenced the ROS production rate – the best effect upon DA between different groups of patients was caused by HyFnC60 in concentrations of 10−6 M and 10−19 M.
Acknowlegements
We thank G.V. Andrievsky, PhD, Senior Scientist of Lab. of Bio-Medical Testing for Nanomaterials, ISMA, STC ‘Institute for Single Crystals’ NAS of Ukraine, for the provision of the solution of HyFnC60. The investigation was partially funded by Closed Joint Stock Company “Corporation Olifen”, Moscow.
Footnotes
Source of support: Departmental sources
References
- 1.MacNee W, Tuder RM. 2 New paradigms in the pathogenesis of phronic pbstructive pulmonary pisease. Proc Am Thorac Soc. 2009;6:527–31. doi: 10.1513/pats.200905-027DS. [DOI] [PubMed] [Google Scholar]
- 2.The Global Initiative for Chronic Obstructive Lung Disease (GOLD) 2007. [Google Scholar]
- 3.Skyba P, Kluchova Z, Joppa P, et al. Nutritional status in relation to respiratory impairment and systemic inflammation in patients with acute exacerbations of COPD. Med Sci Monit. 2009;15(10):CR528–33. [PubMed] [Google Scholar]
- 4.Pietras T, Szemraj J, Witusik A, et al. The sequence polymorphism of MnSOD gene in subjects with respiratory insufficiency in COPD. Med Sci Monit. 2010;16(9):CR427–32. [PubMed] [Google Scholar]
- 5.Cavalcante AGM, de Bruin PFC. The role of oxidative stress in COPD: current concepts and perspectives. J Bras Pneumol. 2009;35:1227–37. doi: 10.1590/s1806-37132009001200011. [DOI] [PubMed] [Google Scholar]
- 6.Bolevich SB. Bronchial asthma and free-radical processes. Moscow: Medicine; 2006. (in Russian) [Google Scholar]
- 7.Duke VA. Construction of psychodiagnostic tests: traditionalmathematical models and algorithms. S.-P. 1994. (in Russian) [Google Scholar]
- 8.Voeikov VL. Reactive oxygen species (ROS): pathogens or sources of vital energy? Part 1. ROS in normal and pathologic physiology of living systems. J Alternat Complem Med. 2006;12:111–18. doi: 10.1089/acm.2006.12.111. [DOI] [PubMed] [Google Scholar]
- 9.Voeikov VL, Asfaramov R, Bouravleva EV, et al. Biophoton research in blood reveals its holistic properties. Indian J Exp Biol. 2003;43:473–82. [PubMed] [Google Scholar]
- 10.Voeikov VL, Novikov CN, Siuch NI. Alterations in Luminol-enhanced CL from nondiluted whole blood in the course of low-level laser therapy of angina pectoris patients. In: Cohn GE, Soper SA, editors. Ultrasensitive Biochemical Diagnostics II; SPIE Proc 1997; San Jose, CA, USA 2985. pp. 286–94. [Google Scholar]
- 11.Andrievsky GV, Kosevich MV, Vovk OM, et al. On the production of an aqueous colloidal solution of fullerenes. J Chem Soc Chem Commun. 1995;12:1281–82. [Google Scholar]
- 12.Kroto HW, Heath JR, O’Brien SC, et al. C60: Buckminsterfullerene. Nature. 1985;318:162–63. [Google Scholar]
- 13.Fowler PW, Manolopoulos DE. An Atlas of Fullerenes. Oxford: Clarendon Press; 1995. [Google Scholar]
- 14.Andrievsky GV, Kosevich MV, Vovk OM, et al. On the production of an aqueous colloidal solution of fullerenes. J Chem Soc Chem Commun. 1995;12:1281–82. [Google Scholar]
- 15.Andrievsky GV, Kondakov IK, Vovk OM. Comparative analysis of two aqueous-colloidal solutions of C60 fullerene with help of FT-IR reflectance and UV-VIS spectroscopy. Chem Phys Letters. 2002;364:8–17. [Google Scholar]
- 16.Andrievsky GV, Bruskov VI, Tykhomyrov AA, Gudkov SV. Peculiarities of the antioxidant and radioprotective effects of hydrated C60 fullerene nanostuctures in vitro and in vivo. Free Rad Biol Med. 2009;47:786–93. doi: 10.1016/j.freeradbiomed.2009.06.016. [DOI] [PubMed] [Google Scholar]
- 17.Andrievsky GV, Burenin IS. On medicinal and preventive efficacy of small doses of hydrated C60 fullerenes at cancer pathologies. Chemistry Preprint Archive. 2002;6:53–68. [Google Scholar]
- 18.Tykhomyrov AA, Nedzvetsky VS, Klochkov VK, Andrievsky GV. Nanostructures of hydrated C60 fullerene (C60HyFnC60) protect rat brain against alcohol impact and attenuate behavioral impairments of alcoholized animals. Toxicology. 2008:1–8. doi: 10.1016/j.tox.2008.01.005. [DOI] [PubMed] [Google Scholar]
- 19.Andrievsky GV, Klochkov VK, Derevyanchenko LI. Is C60 fullerene molecular toxic?! Fullerenes, Nanotubes and Carbon Nanostructures. 2005;13:363–76. [Google Scholar]
- 20.Andrievsky G, Shakhnin A, Tronza A, Zhernosekov D, Tykhomyrov A. The acceleration of blood plasma clot lysis in the presence of hydrated C60 fullerene nanostructures in super-small concentration. Fullerenes, Nanotubes and Carbon Nanostructures. 2010;18:303–11. [Google Scholar]
- 21.Pal’mina NP, Mal’tseva EL, Kurnakova NV, Burlakova EB. The effect of alpha-tocopherol over a wide range of concentrations (10(-2)-10(-17) M) on protein kinase C activity. Connection with proliferation and tumor growth. Biochimika (Russian) 1994;59:193–200. [PubMed] [Google Scholar]


