

Summary
Background
Vitamin D has been associated with multiple cardiometabolic risk factors in children but there is a paucity of studies examining its correlation to vascular function and structure. Our objective was to determine whether there is a correlation between vitamin D, cardiometabolic risk, vascular distensibility and carotid artery intima-media thickness (CIMT) in high-risk children.
Material/Methods
This was a cross-sectional, cohort study that compared vitamin D to cardiometabolic risk factors, carotid artery distensibility, and CIMT in 74 children with multiple, modifiable atherosclerosis-promoting risk factors. Vitamin D was used as a continuous variable and also categorized as deficient (<20 ng/mL) or sufficient (≥20 ng/mL). Seven modifiable atherosclerosis-promoting risk factors were analyzed – body mass index, systolic blood pressure, total cholesterol, triglyceride, high density lipoprotein cholesterol, fasting insulin, & tobacco smoke exposure history.
Results
For the entire cohort, vitamin D was 26.1±9.4 ng/mL (6–63 ng/mL); and the levels were deficient in 20%. The number of modifiable atherosclerosis promoting risk factors per child was 3.3±1.6. Distensibility index was 2.62±0.87% per 10 mmHg, CIMT 0.54±0.06 mm. There was an inverse correlation between vitamin D and risk factor score (r=−0.27, p=0.02); this remained significant after adjusting for age, sex, and race. There was no association between vitamin D levels and distensibility index or CIMT.
Conclusions
Even though vitamin D levels were inversely correlated with cardiometabolic risk factor score in high-risk children, there are no demonstrable vascular functional or structural effects.
Keywords: Vitamin D, children, cardiovascular, lipids, obesity
Background
Vitamin D deficiency is prevalent in the US [1,2] and has been attributed to multiple medical problems including rickets in children and osteoporosis in older adults. In addition to skeletal problems, deficient vitamin D states have been linked to extra-skeletal diseases including cardiovascular disease in some observational and experimental studies [3–6] but other studies have shown no association or mixed results [7,8]. Vitamin D levels are inversely associated with hypertension, diabetes, atherosclerosis, myocardial infarction, congestive heart failure, stroke, microalbuminuria and decreased kidney function [4,9–14].
In children, the role that vitamin D plays in cardiometabolic risk is not well studied and the results are contradictory. National Health and Nutrition Examination Survey (NHANES) cross-sectional studies confirmed a high prevalence of vitamin D deficiency (defined by this group as serum levels <30 ng/mL) among the pediatric population and this was associated with adverse cardiovascular risk, such as hypertension, low high density lipoprotein cholesterol (HDL) levels [15], high body mass index (BMI), central adiposity, and metabolic syndrome [16]. A recent study performed in urban school children with a high prevalence of obesity and vitamin D deficiency, however, confirmed no association between vitamin D deficiency (defined by this group as serum levels <20 ng/mL), adiposity, and cardiometabolic risk factors [17].
The effect of vitamin D on vascular function and structure has been examined in several adult studies that have shown inverse correlations between vitamin D status and vascular endothelial function [18,19], brachial artery distensibility [18], and carotid artery intima-media thickness (CIMT), a marker of atherosclerosis [11,20]. There are, however, very few studies in children that examine the correlation between vitamin D deficiency and vascular function and structure. A recent report in children and adolescents found an inverse correlation between serum vitamin D levels and adiposity, metabolic syndrome, and hypertension but found no correlation with vascular endothelial function or CIMT [21]. In contrast, another study performed in children on dialysis showed that CIMT had a U-shaped bimodal distribution across vitamin D levels so children with extremely low or high vitamin D had increased CIMT [22].
In view of these inconsistent reports in the literature and paucity of studies examining the vascular changes that may be associated with vitamin D deficiency in children, we undertook this study to investigate the relationship between vitamin D deficiency and vascular function as assessed by common carotid artery distensibility index and vascular structure as assessed by CIMT in high-risk children. We hypothesized that vitamin D deficiency is associated with a decreased carotid artery distensibility index, an increased CIMT, and a higher number of risk factors that promote atherosclerosis.
Material and Methods
This cross-sectional, cohort study involved 74 children, 13.7±3.1 years who attended the Children’s Mercy Hospital Preventive Cardiology Clinic over a two-year period (January 1, 2009 to December 31, 2010). These children were referred for evaluation of obesity, dyslipidemia and other atherosclerosis-promoting risk factors. Demographic and anthropometric data including age, sex, race (per self report), weight (in kilograms), height (in centimeters), and BMI (kg/m2) were recorded. Race data was obtained as vitamin D levels are known to be lower in African Americans and Hispanics. Exposure to tobacco smoke, defined as any exposure to primary or secondary tobacco smoke, was recorded. Blood pressure was obtained over the right arm in the sitting position using a Dinamap blood pressure monitor [23]. A fasting total cholesterol (TC), HDL C, triglyceride (TG), fasting insulin, and serum 25-hydroxyvitamin D levels were performed. The season in which this data was obtained was also recorded as spring/summer (March to August) and fall/winter (September to February). Children’s Mercy Hospital Institutional Review Board approved the study.
A common carotid artery B-mode ultrasound was obtained for measurement of arterial distensibility and CIMT at the clinic visit. The carotid arteries were imaged by trained sonographers using a standard ultrasound machine (Philips iE 33, Bothell, Wash) and a high resolution, L9-3 MHz linear array transducer. A simultaneous EKG tracing was obtained for the purposes of gating. The digital images of both the left and right common carotid arteries were stored for offline reading. A single, trained reader who was blinded to the clinical data performed all measurements prospectively. Scanning of the carotid arteries and reading of CIMT were performed per previously published protocols [24,25].
Arterial distensibility
The common carotid arterial diameter was measured using B-mode images with ultrasonic calipers placed from the near-end intima to the far end intima of the arterial lumen. The diameter was measured on still frames at the QRS complex (“QRS”) reflecting diastole and on still frames between the QRS complexes (“non-QRS”), reflecting systole. The “non-QRS” point is the moment in which the vessel is maximally dilated. Twenty-five measurements of the arterial lumen at “QRS” and 25 at “non-QRS” were measured over both the right and left common carotid arteries within 10 mm from the carotid bifurcation. The “QRS” diameter measurements were averaged to obtain a mean “QRS” diastolic diameter and the “non-QRS” diameter measurements were averaged to obtain a mean “non-QRS” systolic diameter for each child. The distensibility index was calculated as [(“non-QRS” diameter – “QRS” diameter)/“QRS” diameter]/(Systolic blood pressure – Diastolic blood pressure) and reported as percentage per 10 mm/Hg. This measure reflects how distensible the artery is with higher distensibility indices indicating healthier vasculature [26].
In order to ensure the accuracy of arterial diameter measurements, intra-reader reliability was calculated. For this, the reader measured carotid artery diameters from identical frames on two separate occasions while being blinded to the other reading. The intra-reader reliability was excellent at 94%.
CIMT
CIMT measurements were taken from the far wall of both the left and right common carotid arteries using a semi-automated, edge detection software (QLAB, Philips iE 33). This software was used to measure the CIMT within a 10-mm-wide box that was placed along the far wall of the common carotid artery within 2 cm of the carotid bifurcation. CIMT was measured in end-diastole (“QRS”), which started at 2 frames before the QRS complex to 2 frames after the QRS complex. Along with the CIMT, the success rate of the measurement was also tabulated by QLAB. This is the percentage of the CIMT wall within the region of interest that was accurately measured. Only frames with CIMT measurements with a success rate of 95% or above were accepted. Each study consisted of measuring CIMT from 100 frames from the left and right common carotid artery [24] (Figure 1).
Figure 1.
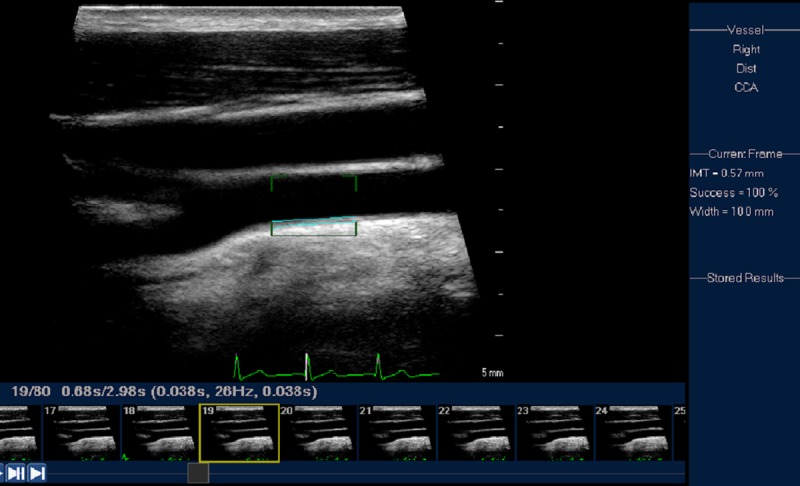
Carotid artery intima media thickness. A still frame from a clip of the common carotid artery is displayed. The measurement of the CIMT is taken within the 10 mm box (region of interest). The intima-media is highlighted and the semi-automated CIMT measurement is recorded on the right side of the frame (0.57 mm).
In order to ensure the accuracy of CIMT measurements, intra-reader reliability was calculated. For this, the reader measured the CIMT from identical frames on two separate occasions while being blinded to the other reading. The intra-reader reliability was excellent at 90%.
Modifiable atherosclerosis – promoting risk factors
Seven modifiable, atherosclerosis-promoting risk factors were considered in the data analysis – BMI, SBP, TC, TG, HDL C, insulin, & tobacco smoke exposure history. The number of sub-optimal, modifiable, atherosclerosis promoting risk factors that were present in each child was counted and the total was reported as the risk factor score. For this, the risk factors were dichotomized based on the following cutoff levels that are either previously published or norms accepted in our clinic: BMI ≥95th percentile for age and sex, SBP ≥95th percentile for age, sex and height, TC ≥170 mg/dL, TG ≥100 mg/dL, HDL C <45 mg/dL, insulin ≥18 uIU/mL, and history of tobacco smoke exposure. We have previously noted that an increased number of risk factors (>3) are associated with an increased CIMT [24]. The relation between the risk factor score and vitamin D status was further explored adjusting for age, sex and race.
Statistics and analysis
Vitamin D (predictor) was used as a continuous variable and was also categorized into two levels – deficient defined as serum vitamin D level <20 ng/mL or sufficient defined as serum vitamin D level ≥20 ng/mL as per the Institute of Medicine [1] and American Academy of Pediatrics recommendations [27]. Continuous variables were described as mean ± standard deviation and categorical variables were described as percentages. We compared demographic, anthropometric and laboratory data, CIMT, and distensibility indices between vitamin D sufficient and insufficient children using Student t test for continuous variables and chi squared test for categorical variables. Vitamin D levels were compared among demographic variables (gender, race), season, and the dichotomized risk factors using a Student t test. For univariate analysis, we assessed the association between vitamin D levels and the individual risk factors, risk factor score, distensibility index and CIMT using the Pearson correlation coefficient. We then performed multivariate analysis to assess the impact of risk factor score on vitamin D taking gender, age, and race into account using general linear models. Statistical analysis was performed using SPSS 18 and SAS 9.2 (Cary, NC). Statistical significance was claimed at 95% confidence level (p<0.05).
Results
74 children (33 male), aged 13.7±3.1 years who had both a carotid artery ultrasound performed as well as vitamin D levels drawn at the same clinic visit were selected for this study. Vitamin D levels in white children (28.0±8.5 ng/mL) were significantly higher than in children of the other races (23.0±10.2 ng/mL) (p=0.03). Fifty percent had vitamin D levels drawn in the Spring/Summer seasons and there were no seasonal differences in vitamin D levels noted.
Fifty-eight percent were obese (BMI ≥95th percentile for age and sex), 19% had SBP ≥95th percentile for age, sex and height, 85% had elevated TC, 62% had elevated TG, 47% had low HDL, fasting insulin was high in 30% and 30% had been exposed to tobacco smoke. The mean number of atherosclerosis promoting risk factors per child was 3.3±1.6 (Table 1).
Table 1.
Demographic characteristics and modifiable atherosclerosis promoting risk factors between Vitamin D deficient and sufficient children*.
| Vitamin D (ng/mL) | ||
|---|---|---|
| Deficient <20 | Sufficient ≥20 | |
| Age (years) | 14.1±2.2 | 13.6±3.3 |
| Male** | 6 (18%) | 27 (82%) |
| White** | 5 (11%) | 41 (89%)*** |
| BMI Z score | 1.9±0.6 | 1.4±1.1*** |
| SBP Z score | 0.7±0.9 | 0.7±0.9 |
| TC (mg/dL) | 214±26 | 216±49 |
| TG (mg/dL) | 282±621 | 173±139 |
| HDL (mg/dL) | 44±9 | 47±13 |
| Fasting Insulin (uIU/mL) | 25±36 | 15±15 |
| Exposure to tobacco smoke** | 6 (27%) | 16 (73%) |
| Risk factor score | 4.1±1.3 | 3.1±1.6*** |
Reported as mean ± SD unless otherwise specified;
Numbers (percentages);
p<0.05.
For the entire cohort, vitamin D levels were 26.1±9.4 ng/mL (6–63 ng/mL) with 15 of the 74 (20%) being deficient. There was an inverse correlation between vitamin D and risk factor score (r=−0.27, p=0.02) (Figure 2). However, when each risk factor was considered as a continuous or a dichotomous variable (suboptimal versus optimal), there was no significant association between vitamin D and risk factors with the exception of obesity status (p<0.05) (Table 2). After adjustment for age, gender, and race, the inverse correlation between vitamin D and risk factor score persisted (p=0.03) while the correlation between vitamin D and obesity status became insignificant.
Figure 2.

Relationship between cardiovascular risk factor score and Vitamin D levels. This graph shows the inverse correlation between the number of modifiable atherosclerosis promoting risk factors per child (risk factor score) and the vitamin D level.
Table 2.
Vitamin D (ng/mL) comparisons between groups.
| Vitamin D (mean ±SD) | |
|---|---|
| Gender | |
| Male | 25.5±9.1 |
| Female | 26.5±9.7 |
| Race* | |
| White | 28.0±14.2 |
| Non-White | 23.0±10.2 |
| Season | |
| Spring/Summer | 25.9±8.9 |
| Fall/Winter | 26.3±9.9 |
| BMI* | |
| Obese | 24.3±8.9 |
| Non-Obese | 28.7±9.6 |
| SBP | |
| ≥95th Percentile | 23.5±5.1 |
| <95th Percentile | 26.2±10.3 |
| TC | |
| ≥170 mg/dL | 25.2±9.9 |
| <170 mg/dL | 28.6±7.1 |
| TG | |
| ≥100 mg/dL | 26.3±10.6 |
| <100 mg/dL | 24.6±7.4 |
| HDL | |
| <45 mg/dL | 23.9±7.6 |
| ≥45 mg/dL | 27.5±11.0 |
| Fasting Insulin | |
| ≥18 uIU/mL | 23.1±5.9 |
| <18 uIU/mL | 27.0±10.7 |
| Tobacco Smoke Exposure History | |
| Yes | 24.4±8.8 |
| No | 26.3±8.8 |
p<0.05.
Vitamin D deficiency was not significantly associated with distensibility index; however, there was a trend towards lower distensibility indices in the vitamin D deficient children (2.48±0.81 vs. 2.65±0.89% per 10 mmHg). There was no difference in CIMT between vitamin D deficient and sufficient children (Table 3).
Table 3.
Distensibility Index and CIMT (mean ±SD).
| All children | Vitamin D Deficient <20 ng/mL | Vitamin D Sufficient ≥20 ng/mL | P value | |
|---|---|---|---|---|
| Distensibility Index (% per 10 mmHg) | 2.62±0.87 | 2.48±0.81 | 2.65±0.89 | 0.50 |
| CIMT (mm) | 0.54±0.07 | 0.53±0.07 | 0.54±0.06 | 0.82 |
Discussion
This is one of the few reports describing the vascular effects of vitamin D deficiency in high-risk children. Our study confirmed that while vitamin D levels correlated with increased cardiometabolic risk as measured by cardiovascular risk factor score, there were no clearly discernible functional or structural vascular changes. To our knowledge, studies examining the vascular effect of vitamin D status in children are limited to a report by Pacifico, et al. This study examined the link between total adiposity, metabolic profile, hypertension, and low vitamin D levels in children and they also confirmed a metabolic correlation with vitamin D deficiency but found no effects on vascular function or structure [21]. The lack of correlation between vitamin D levels and vascular function or structure may be because vascular changes may manifest only after a substantial length of exposure to vitamin D deficiency, so the vascular effects may only been seen in youth with a history of long standing vitamin D deficiency. Hence, there may be a long-term vascular benefit in maintaining vitamin D at sufficient levels in children as per the Institute of Medicine recommendations [1].
Vitamin D has been shown to be useful in optimal functioning of several extra-skeletal pathways including the circulatory system. Vitamin D is thought to be useful for maintaining appropriate levels of apolipoprotein A-1 (a main component of HDL) [28,29] and for regulating lipoprotein lipase activity thus influencing triglyceride levels [30]. Vitamin D has also been shown to negatively regulate the renin-angiotensin-aldosterone pathway thus helping regulate blood pressure [31,32]. In addition, vitamin D can alter insulin sensitivity and influence pancreatic beta-cell secretory function [6,33].
Although in our study the individual cardiometabolic risk factors showed no correlation with vitamin D levels, we did note an inverse correlation when all the modifiable risk factors were combined into a score, and this relationship persisted even after adjustment for age, sex, and race. This may suggest clustering effect, common underlying demographic and socioeconomic risks, or a not yet known mechanism by which vitamin D modulates cardiovascular function.
Our findings are in agreement with two, large scale, cross-sectional, community based, NHANES studies that confirmed an inverse correlation between vitamin D and cardiometabolic risk in children [15,16]. In contrast, a recent study performed in urban, inner city school children in winter did not confirm any correlation between vitamin D status and adiposity or cardiometabolic risk [17]. However, this population had a uniformly high prevalence of vitamin D deficiency with very few vitamin D sufficient children.
Vitamin D and obesity status were inversely correlated in our study; however, this correlation became insignificant after adjustment for age, sex, and race. Obese children are known to have lower vitamin D levels and this may be due to a combination of factors: less conversion of vitamin D from prometabolites in the skin due to reduced outdoor activity, reduced vitamin D intake due to poor diet choices (sugary beverages replacing dairy), and sequestration of vitamin D in fat tissue [15,16,34–36]. Even though 58% of our study population was obese, only 20% had vitamin D deficiency. This contrasts to the findings by Sacheck et al who confirmed a much higher prevalence of vitamin D deficiency in obese, urban, inner city school population [17]. The differences or lack thereof between vitamin D status and obesity in our study may be due to the fact that our children were screened during both winter and summer months or the effect of latitude (39° N for Kansas City). In our study, white children had higher vitamin D levels than non-white children, consistent with the findings of earlier studies [15]. This is due to decreased production of vitamin D from precursors as a result of increased melanin in darker skins allowing less ultraviolet light penetration [37,38].
Limitations of this study are that this small cohort is a convenience sample with variable stages of development and lack of healthy controls. The study sample is likely underpowered and the vitamin D deficient children in this cohort is underrepresented. It is likely that a study looking at adequate number of children with vitamin deficiency may contrast the changes in vascular function and structure, if any.
Conclusions
We have examined the rarely reported relationship between vitamin D, cardiometabolic risk, and vascular function and structure (as measured by distensibility index and CIMT respectively) in children and found that while vitamin D levels are inversely correlated with cardiometabolic risk factor score, there was a lack of clear association between vitamin D status and distensibility index or CIMT. Considering these mixed results and similar conflicting reports in the literature, it is our recommendation that a prospective, case controlled study in a large population of children with varying cardiometabolic risks be designed to further investigate the vascular effects of vitamin D deficiency. In the interim, in view of the association between vitamin D levels and cardiometabolic risk factor score, we recommend vitamin D supplementation for vitamin D deficient, high-risk children.
Footnotes
Disclosure statement
The authors have nothing to disclose and no conflicts of interest.
Source of support: Sarah Morrison medical student research fund awarded by the University of Missouri-Kansas City School of Medicine
References
- 1.Ross AC, Taylor CL, Yaktine AL, Del Valle H, editors. Dietary reference intakes for calcium and vitamin D. Washington, DC: National Academies Press; 2010. Committee to Review Dietary Reference Intakes for Vitamin D and Calcium, Institute of Medicine. [PubMed] [Google Scholar]
- 2.National Center for Health Statistics. National Health and Nutrition Examination Survey, 2001–2006. [Accessed June 9, 2011]. Available at: http://www.cdc.gov/nchs/nhanes/nhanes_questionnaires.htm.
- 3.Kenrick J, Targher G, Smits G, Chonchol M. 25-Hydroxyvitamin D deficiency is independently associated with cardiovascular disease in the Third National Health and Nutrition Examination Survey. Atherosclerosis. 2009;205:255–60. doi: 10.1016/j.atherosclerosis.2008.10.033. [DOI] [PubMed] [Google Scholar]
- 4.Wang TJ, Pencina MJ, Booth SL, et al. Vitamin D deficiency and risk of cardiovascular disease. Circulation. 2008;117(4):503–11. doi: 10.1161/CIRCULATIONAHA.107.706127. [DOI] [PMC free article] [PubMed] [Google Scholar]
- 5.Giovannucci E, Liu Y, Hollis BW, Rimm EB. 25-hydroxyvitamin D and risk of myocardial infarction in med. Arch Intern Med. 2008;168(11):1174–80. doi: 10.1001/archinte.168.11.1174. [DOI] [PMC free article] [PubMed] [Google Scholar]
- 6.Hu P, Hu B, Wang J, et al. Modulation of vitamin D signaling is a potential therapeutic target to lower cardiovascular risk in chronic kidney disease. Med Sci Monit. 2011;17(6):HY14–20. doi: 10.12659/MSM.881790. [DOI] [PMC free article] [PubMed] [Google Scholar]
- 7.Melamed ML, Michos ED, Post W, Astor B. 25-hydroxyvitamin D levels and risk of mortality in general population. Arch Intern Med. 2008;168(15):1629–37. doi: 10.1001/archinte.168.15.1629. [DOI] [PMC free article] [PubMed] [Google Scholar]
- 8.Wang L, Manson JE, Song Y, Sesso HD. Systematic review: Vitamin D and calcium supplementation in prevention of cardiovascular events. Ann Intern Med. 2010;152(5):315–23. doi: 10.7326/0003-4819-152-5-201003020-00010. [DOI] [PubMed] [Google Scholar]
- 9.Chiu KC, Chu A, Go VL, Saad MF. Hypovitaminosis D is associated with insulin resistance and beta cell dysfunction. Am J Clin Nutr. 2004;79:820–25. doi: 10.1093/ajcn/79.5.820. [DOI] [PubMed] [Google Scholar]
- 10.Cigolini M, Iagulli MP, Miconi V, et al. Serum 25-Hydroxyvitamin D3 concentrations and prevalence of cardiovascular disease among type 2 diabetic patients. Clin Endocrinol. 2006;65:593–97. doi: 10.2337/diacare.29.03.06.dc05-2148. [DOI] [PubMed] [Google Scholar]
- 11.Targher G, Bertolini L, Padovani R, et al. Serum 25-hydroxyvitamin D3 concentrations and carotid artery intima-media thickness among type 2 diabetic patients. Clin Endocrinol. 2006;65:593–97. doi: 10.1111/j.1365-2265.2006.02633.x. [DOI] [PubMed] [Google Scholar]
- 12.Zittermann A, Schleithoff SS, Tenderich G, et al. Low vitamin D status: a contributing factor in the pathogenesis of congestive heart failure? J Am Coll Cardiol. 2003;41:105–12. doi: 10.1016/s0735-1097(02)02624-4. [DOI] [PubMed] [Google Scholar]
- 13.de Boer IH, Ioannou GN, Kestenbaum B, et al. 25-Hydroxyvitamin D levels and albuminuria in the Third National Health and Nutrition Examination Survey (NHANES III) Am J Kidney Dis. 2007;50:69–77. doi: 10.1053/j.ajkd.2007.04.015. [DOI] [PubMed] [Google Scholar]
- 14.Chonchol M, Scragg R. 25-Hydroxyvitamin D, insulin resistance, and kidney function in Third National Health and Nutrition Examination Survey. Kidney Int. 2007;71:134–39. doi: 10.1038/sj.ki.5002002. [DOI] [PubMed] [Google Scholar]
- 15.Kumar J, Muntner P, Kaskel FJ, et al. Prevalence and Associations of 25-Hydroxyvitamin D deficiency in US children: NHANES 2001–2004. Pediatrics. 2009;124(3):e362–70. doi: 10.1542/peds.2009-0051. [DOI] [PMC free article] [PubMed] [Google Scholar]
- 16.Reis J, von Muhlen D, Miller E, et al. Vitamin D Status and Cardiometabolic Risk Factors in the United States Adolescent Population. Pediatrics. 2009;124(3):e371–79. doi: 10.1542/peds.2009-0213. [DOI] [PMC free article] [PubMed] [Google Scholar]
- 17.Sacheck J, Goodman E, Chui K, et al. Vitamin D deficiency, adiposity, and cardiometabolic risk in urban schoolchildren. J Pediatr. 2011;159(6):945–50. doi: 10.1016/j.jpeds.2011.06.001. [DOI] [PMC free article] [PubMed] [Google Scholar]
- 18.London GM, Guérin AP, Verbeke FH, et al. Mineral metabolism and arterial functions in end-stage renal disease: potential role of 25-hydroxyvitamin D deficiency. J Am Soc Nephrol. 2007;18(2):613–20. doi: 10.1681/ASN.2006060573. [DOI] [PubMed] [Google Scholar]
- 19.Sugden JA, Davies JI, Witham MD, et al. Vitamin D improves endothelial function in patients with Type 2 diabetes mellitus and low vitamin D levels. Diabet Med Mar. 2008;25(3):320–25. doi: 10.1111/j.1464-5491.2007.02360.x. [DOI] [PubMed] [Google Scholar]
- 20.Choi AI, Lo JC, Mulligan K, et al. Association of Vitamin D Insufficiency with Carotid Intima-Media Thickness in HIV-Infected Persons. Clin Infect Dis. 2011;52(7):941–44. doi: 10.1093/cid/ciq239. [DOI] [PMC free article] [PubMed] [Google Scholar]
- 21.Pacifico L, Anania C, Osborn JF, et al. Low 25(OH)D3 levels are associated with total adiposity, metabolic syndrome, and hypertension in Caucasian children and adolescents. Eur J Endocrinol. 2011;165(4):603–11. doi: 10.1530/EJE-11-0545. [DOI] [PubMed] [Google Scholar]
- 22.Shroff R, Egerton M, Bridel M, et al. A bimodal association of vitamin D levels and vascular disease in children on dialysis. J Am Soc Nephrol. 2008;19(6):1239–46. doi: 10.1681/ASN.2007090993. [DOI] [PMC free article] [PubMed] [Google Scholar]
- 23.National High Blood Pressure Education Program Working Group on High Blood Pressure in Children and Adolescents. The fourth report on the diagnosis, evaluation, and treatment of high blood pressure in children and adolescents. Pediatrics. 2004;114:555–76. [PubMed] [Google Scholar]
- 24.Le J, Zhang D, Menees S, et al. “Vascular age” is advanced in children with atherosclerosis-promoting risk factors. Circ Cardiovasc Imaging. 2010;3(1):8–14. doi: 10.1161/CIRCIMAGING.109.880070. [DOI] [PubMed] [Google Scholar]
- 25.Menees S, Zhang D, Le J, et al. Variations in carotid artery intima-media thickness during the cardiac cycle in children. J Am Soc Echocardiogr. 2010;23(1):58–63. doi: 10.1016/j.echo.2009.10.016. [DOI] [PubMed] [Google Scholar]
- 26.Juonala M, Jarvisalo M, Maki-Torkko N, et al. Risk Factors Identified in Childhood and Decreased Carotid Artery Elasticity in Adulthood: The cardiovascular risk in young Finns study. Circulation. 2005;112(10):1486–93. doi: 10.1161/CIRCULATIONAHA.104.502161. [DOI] [PubMed] [Google Scholar]
- 27.Wagner C, Greer F the Section on Breastfeeding and Committee on Nutrition. Prevention of rickets and vitamin D deficiency in infants, children, and adolescents. Pediatrics. 2008;122:142–52. doi: 10.1542/peds.2008-1862. [DOI] [PubMed] [Google Scholar]
- 28.Auwerx J, Boullon R, Kesteloot H. Relation between 25-hydroxyvitamin D3, apolipoprotein A-1, and high density lipoprotein cholesterol. Arterioscler Thromb. 1992;12(6):671–74. doi: 10.1161/01.atv.12.6.671. [DOI] [PubMed] [Google Scholar]
- 29.Carbone LD, Rosenberg EW, Tolley EA, et al. 25-Hydroxyvitamin D, cholesterol, and ultraviolet irradiation. Metabolism. 2008;57(6):741–48. doi: 10.1016/j.metabol.2008.01.011. [DOI] [PubMed] [Google Scholar]
- 30.Querfeld U, Hoffmann MM, Klaus G, et al. Antagonistic effects of vitamin D and parathyroid hormone on lipoprotein lipase in cultured adipocytes. J Am Soc Nephrol. 1999;10(10):2158–64. doi: 10.1681/ASN.V10102158. [DOI] [PubMed] [Google Scholar]
- 31.Li YC, Qiao G, Uskokovic M, et al. Vitamin D: a negative endocrine regulator of the renin-angiotensin system and blood pressure. J Steroid Biochem Mol Biol. 2004;89–90(1–5):387–92. doi: 10.1016/j.jsbmb.2004.03.004. [DOI] [PubMed] [Google Scholar]
- 32.Li YC, Kong J, Wei M, et al. 1,25-Dihydroxyvitamin D3 is a negative endocrine regulator of the renin-angiotensin system. J Clin Invest. 2002;110:229–38. doi: 10.1172/JCI15219. [DOI] [PMC free article] [PubMed] [Google Scholar]
- 33.Tai K, Need AG, Horowitz M, Chapman IM. Vitamin D, glucose, insulin, and insulin sensitivity. Nutrition. 2008;24(3):279–85. doi: 10.1016/j.nut.2007.11.006. [DOI] [PubMed] [Google Scholar]
- 34.Alemzadeh R, Kichler J, Babar G, Calhoun M. Hypovitaminosis D in obese children and adolescents: relationship with adiposity, insulin sensitivity, ethnicity, and season. Metabolism. 2008;57(2):183–91. doi: 10.1016/j.metabol.2007.08.023. [DOI] [PubMed] [Google Scholar]
- 35.Wortsman J, Matsuoka LY, Chen TC, et al. Decreased bioavailability of vitamin D in obesity. Am J Clin Nutr. 2000;72(3):690–93. doi: 10.1093/ajcn/72.3.690. [DOI] [PubMed] [Google Scholar]
- 36.Rajakumar K, Fernstrom JD, Holick MF, et al. Vitamin D status and response to vitamin D(3) in obese vs non-obese African American children. Obesity (Silver Spring) 2008;16(1):90–95. doi: 10.1038/oby.2007.23. [DOI] [PubMed] [Google Scholar]
- 37.Chen TC, Chimeh F, Lu Z, et al. Factors that influence the cutaneous synthesis and dietary sources of vitamin D. Arch Biochem Biophys. 2007;460(2):213–17. doi: 10.1016/j.abb.2006.12.017. [DOI] [PMC free article] [PubMed] [Google Scholar]
- 38.Clemens TL, Adams JS, Henderson SL, Holick MF. Increased skin pigment reduces the capacity of skin to synthesise vitamin D3. Lancet. 1982;1(8263):74–76. doi: 10.1016/s0140-6736(82)90214-8. [DOI] [PubMed] [Google Scholar]